The strength of the radial-breathing mode in single-walled carbon nanotubes
Abstract
We show by ab initio calculations that the electron-phonon coupling matrix element of the radial breathing mode in single-walled carbon nanotubes depends strongly on tube chirality. For nanotubes of the same diameter the coupling strength is up to one order of magnitude stronger for zig-zag than for armchair tubes. For (,) tubes depends on the value of , which allows to discriminate semiconducting nanotubes with similar diameter by their Raman scattering intensity. We show measured resonance Raman profiles of the radial breathing mode which support our theoretical predictions.
pacs:
63.20.Kr, 71.15.Mb, 78.30.NaThe radial breathing mode (RBM) is without doubt the best known feature in the Raman spectra of carbon nanotubes. In this vibration all carbon atoms move in the radial direction creating a breathing-like deformation of the entire tube. This mode is unique to single-walled carbon nanotubes and is taken as indicative of the presence of nanotubes in a sample. Moreover the frequency of the radial breathing mode is proportional to the inverse diameter of the tube Rao et al. (1997). Raman scattering is therefore often used to determine the diameter or diameter distribution in nanotube samples Bandow et al. (1998); Milnera et al. (2000); Jorio et al. (2001). In detail, the relation between nanotube diameters in real samples and the radial breathing mode spectrum is more complicated, because of the resonances in the Raman process and additional force constants coming from the tube-tube van-der-Waals interaction in bundled nanotubes Milnera et al. (2000); Venkateswaran et al. (1999); Thomsen et al. (1999). Furthermore, the RBM eigenvector has a small non-radial component Dobardžić et al. (2003); Kürti et al. (2003).
It was suggested to use the RBM to find not only the tube diameter but also the chiral angle, i.e., to identify a particular nanotube Jorio et al. (2001); Kramberger et al. (2003); Bacsa et al. (2002). and specify the chiral vector around the circumference of a nanotube in terms of the graphene unit cell vectors and . This assignment relied mostly on the frequency of the RBM, sometimes combined with an argument about the resonant enhancement of the Raman intensity for the laser excitation energy Jorio et al. (2001). It was, however, always assumed that the electron-phonon coupling of the RBM is independent of the chirality of a tube Richter and Subbaswamy (1997). This means that far from resonance or exactly in resonance the scattering intensity of the radial breathing mode is expected to be the same for different nanotubes. Only recently, Strano et al. Strano et al. (2003) suspected a smaller matrix element for armchair tubes than for zig-zag tubes from their measurements of the RBM signal strength of a series of carbon nanotubes in solution.
In this article we show that, contrary to the wide-spread assumption, the electron-phonon coupling strength of the radial breathing mode depends on the diameter and chirality of the nanotube. In ab initio calculations we find the squared electron-phonon matrix elements in zig-zag tubes to be up to one order of magnitude stronger than in armchair tubes for the same optical transition energy. In semiconducting nanotubes the matrix elements allow to distinguish between the nanotube families. A similar intensity difference is expected for the two transitions of metallic nanotubes in each branch of the Kataura plot Kataura et al. (1999). We show experimental evidence of this intensity difference based on measurements of resonant Raman profiles of the RBM of nanotubes in aqueous solution. The relative Raman intensities can independently confirm an assignment obtained, e.g., by photoluminescence.
In the expression for the Raman-scattering cross-section from perturbation theory the square of the electron-phonon matrix elements appears in the numerator. The intensity of the Raman signal in full resonance is scaled by the electron-phonon coupling Trallero-Giner et al. (1992). When calculating these matrix elements both electrons and holes must be taken into account. To every electron excited into a conduction band and interacting with a phonon, corresponds a hole in the valence band . Adding up the two contributions, i.e., assuming strict electron-hole symmetry, we obtain for the electron-phonon matrix element
| (1) |
where the minus sign comes from the opposite charges of holes and electrons.
The diagonal matrix elements of the electron-phonon coupling Hamiltonian for optical phonons can be obtained from the shift of the electronic bands under deformation of the atomic structure corresponding to the phonon-pattern Khan and Allen (1984)
| (2) |
where the sum runs over all atoms in the unit cell. k and denote, respectively, the wave vector and band index of the electronic state, indexes the phonon, is the atomic mass, the polarization vector of the phonon, normalized as , the electronic energy and ua the atomic displacement. is the number of unit cells in the system (1 in our calculation).
We calculated the -point phonon spectrum and the band structure of several isolated nanotubes in their minimum-energy configuration and under deformation due to the RBM to obtain the change of the electronic energies in Eq. (2) Verissimo-Alves et al. (2001). The RBM eigenvector was obtained from finite differences; it has a small non-radial component Dobardžić et al. (2003); Kürti et al. (2003) which lowers the calculated matrix elements by 30 %. All calculations were performed with the SIESTA code Soler et al. (2002) within the local density approximation Perdew and Zunger (1981). The core electrons were replaced by non-local norm-conserving pseudopotentials Troullier and Martins (1991). A double-, singly polarized basis set of localized atomic orbitals was used for the valence electrons, with cutoff radii of 5.12 a.u. for the and 6.25 a.u. for the and orbitals Junquera et al. (2001). 16 points in the direction were included for metallic nanotubes and 3 points for semiconducting tubes. Real-space integrations were done in a grid with a cutoff 270 Ry.
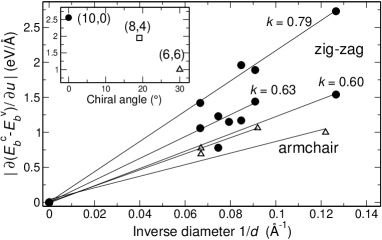
In Fig. 1 we show the energy change for several tubes as a function of inverse tube diameter. The data was evaluated at the region of the Brillouin zone with the highest optical transition probability, i.e., the band extrema Reich et al. (2002). We grouped the data corresponding to points that are close when mapped onto the graphene Brillouin zone (lines in Fig. 1). To first approximation, the points of a particular group correspond to the same transition energies. We find that for a particular transition energy, is proportional to and tends to zero in the infinite-diameter limit. This trend can be easily understood, since the same change in radius yields smaller bond-length changes for bigger tube radii. The infinite-diameter limit corresponds to a translation of graphene, which cannot affect the electronic system. It is clearly seen that for zig-zag tubes is up to 2.5 times larger than for armchair tubes. The inset of Fig. 1 shows the energy change for the first transition of tubes all with diameter 8 Å but different chiralities; in particular, the (8,4) tube lies between the armchair and the zig-zag values. The assumption of a chirality-independent electron-phonon interaction is thus incorrect. Our results suggest the use of relative Raman intensities for discriminating chiralities.
| (6,0) | (10,0) | (6,6) | (8,4) | (11,0) | (8,8) | (14,0) | (15,0) | (16,0) | (17,0) | (11,11) | (19,0) | |
| Å | 77.2 | 210 | 130 | 626 | 254 | 230 | 406 | 467 | 534 | 603 | 436 | 755 |
| d (Å) | 4.8 | 7.9 | 8.2 | 8.4 | 8.7 | 10.9 | 11.0 | 11.8 | 12.6 | 13.4 | 15.0 | 15.0 |
| (cm-1) | 446 | 287 | 278 | 274 | 257 | 209 | 203 | 188 | 179 | 170 | 151 | 149 |
| 0.050 | -0.028 | -0.015 | -0.013 | 0.021 | -0.010 | 0.016 | -0.022 | -0.017 | 0.014 | -0.005 | -0.015 | |
| (1.0) | (0.8) | (2.3) | (0.8) | (0.9) | (1.8) | (0.7) | (1.5) | (0.6) | (0.6) | (1.4) | (0.5) | |
| -0.062 | 0.017 | – | 0.004 | -0.028 | -0.015 | -0.020 | 0.013 | 0.013 | -0.016 | -0.010 | 0.012 | |
| (1.7) | (2.0) | (1.7) | (1.3) | (3.1) | (1.1) | (2.0) | (1.2) | (1.0) | (2.5) | (1.0) | ||
| – | -0.030 | – | -0.016 | -0.028 | -0.017 | -0.021 | -0.022 | -0.018 | -0.017 | -0.012 | -0.016 | |
| (2.4) | (2.6) | (2.6) | (3.7) | (2.4) | (2.6) | (1.9) | (2.1) | (3.3) | (1.6) | |||
| – | -0.031 | – | – | -0.028 | – | – | -0.022 | – | 0.009 | – | -0.016 | |
| (3.0) | (3.1) | (3.2) | (2.4) | (2.7) |
In Table 1, the calculated matrix elements and RBM frequencies are summarized; we found with cm-1nm in excellent agreement with the literature Kürti et al. (1998); Sánchez-Portal et al. (1999) and cm-1. The largest difference in the matrix elements between zig-zag (bold face) and armchair nanotubes of similar diameter and, hence, same RBM frequency is found for the (11,11) and the (19,0) tubes. The matrix element of the (19,0) tube is by a factor of three larger than of the (11,11) tube although the two transition energies are similar (see Table 1). Since the Raman signal is proportional to , we expect the RBM intensity to be nine times larger for the (19,0) than for the (11,11) nanotube from the difference in alone. For different transition energies this ratio could be even larger.
The matrix elements of zig-zag tubes show another interesting feature: they have either a larger magnitude and are negative or a smaller magnitude and are positive [e.g., for the (10,0) tube =0.028 and =0.017]. A change in sign is very uncommon in electron-phonon interaction in solid-state systems. The matrix elements are positive in most semiconductors Cardona (1982). To explain this unusual behavior we calculated of a graphene sheet ( Å) stretching the sheet in the zig-zag direction to simulate the radial atomic displacement and adding the non-radial component (see Fig 2).
In Fig. 2c we show for graphene when stretching it according to a (19,0) tube (solid line) and a (17,0) tube (dotted) together with the ab initio calculated values for these two tubes. depends in sign and magnitude on where the optical transition occurs with respect to the -point of graphene.
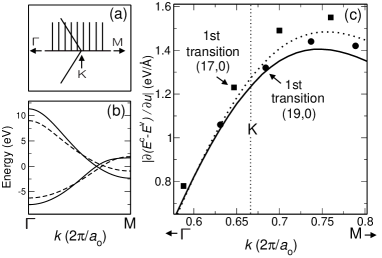
The -point states of an zig-zag tube in the graphene BZ are obtained by dividing the -- line into parts (see Fig. 2a). The states closest to the -point of graphene have the lowest transition energies. The (17,0) tube, e.g., has its 1st transition to the left of the -point and the 2nd one to the right. The energy shift of the graphene bands is smaller to the left of the K point than to its right (Fig. 2c). Therefore for this tube . The (19,0) tube, on the other hand, has its 1st transition to the right of the -point and the 2nd to the left, yielding . Furthermore, is negative to the right of the -point, and positive to the left, explaining the signs of . In general, all semiconducting tubes can be divided into families, which behave like the (17,0) and (19,0) tube with respect to sign and relative magnitude of the . Metallic nanotubes usually have two close-by transition energies due to trigonal warping Reich and Thomsen (2000). The transition with lower energy originates from the right of the -point, the one with higher energy from its left. Therefore, the lower-energy transition is expected to give a higher Raman intensity.
To confirm our theoretical predictions we performed Raman scattering measurements on nanotubes in solution Bachilo et al. (2002); Telg et al. (submitted, 2004). Raman spectra were excited with a Ti-Sapphire laser, recorded with a DILOR XY800 spectrometer, and corrected for the sensitivity of the experimental setup. We then calculated the squared scattering amplitudes from the Raman signal.
In Fig. 3a we show two selected resonance profiles of radial breathing modes. Using the assignment by Bachilo et al. Bachilo et al. (2002) we identify these resonances as the second transition of the (14,1) nanotube with and the (11,0) tube with fus . We predicted a higher Raman intensity for nanotubes with in excellent agreement with the experimental data. As shown in Fig. 1 is similar for nanotubes with similar diameter, chiral angle, and . Approximating the matrix element for the (14,1) tube by for the (16,0) nanotube we find theoretically 3. Experimentally, the ratio 4 is in excellent agreement with our ab-initio result and a uniform distribution of chiral angles in nanotube samples Henrard et al. (1999). We stress that the intensity difference between and tubes is generally observed in our experiment and not limited to the two profiles shown. A more detailed study is underway, but beyond the scope of this paper.
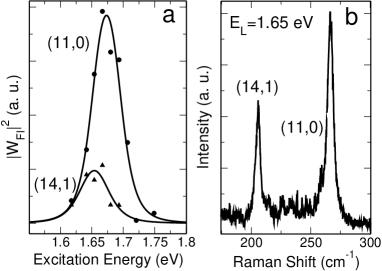
Raman-based assignments performed so far relied strongly on a Raman intensity analysis Jorio et al. (2001) that implicitly assumed constant electron-phonon coupling. As shown, this is not correct. The most intense peak does not necessarily correspond to the nanotube closest to resonance. As an example, we show in Fig. 3b a Raman spectrum for an excitation energy of 1.65 eV. This excitation energy corresponds to the maximum in the resonance profile of the (14,1) nanotube, whereas the (11,0) nanotube is excited 25 meV below its resonance. The Raman intensity thus depends not only on the resonance condition, but also on the particular tubes under study. Differences in Raman intensity due to resonances cannot be distinguished from the chiral angle dependence of using only a single excitation energy; instead a resonance profile has to be evaluated.
A chirality-dependent electron-phonon coupling naturally explains the observations by Strano et al. Strano et al. (2003). They mapped the electronic transitions of metallic nanotubes using Raman excitation profiles. Strangely, the armchair tubes were apparently missing in their sample. In contrast, photoluminescence experiments on the same type of sample Bachilo et al. (2002) suggested a predominance of large-chiral-angle tubes. Our calculations solve this apparent contradiction: the Raman signal of armchair nanotubes is small due to a weak electron-phonon coupling.
In conclusion, we calculated the electron-phonon matrix elements for carbon nanotubes. The matrix elements of zig-zag tubes are much larger than those of armchair tubes, leading to a larger Raman signal for smaller chiral angle tubes. Furthermore, for semiconducting tubes the magnitude and the sign of the matrix elements change systematically for different optical transitions and nanotubes. Relative Raman intensities can discriminate between armchair and zig-zag tubes as well as tube families. The latter we demonstrated by measuring the radial breathing mode resonance on a and nanotube. The family and chiral-angle dependence of the Raman intensities can be used for a refined assignment of chiral indices and chirality distributions.
We thank F. Hennrich for providing the samples. S. R. acknowledges financial support by the Berlin-Brandenburgische Akademie der Wissenschaften, the Oppenheimer Fund, and Newnham College. J. M. was supported by the DFG (Th 662/8-2). We acknowledge the MCyT (Spain) and the DAAD (Germany) for a Spanish-German Research action; P. O. acknowledges support from Spain’s MCyT grant BFM2003-03372-C03-01.
References
- Rao et al. (1997) A. M. Rao, E. Richter, S. Bandow, B. Chase, P. C. Eklund, K. A. Williams, S. Fang, K. R. Subbaswamy, M. Menon, A. Thess, et al., Science 275, 187 (1997).
- Bandow et al. (1998) S. Bandow, S. Asaka, Y. Saito, A. M. Rao, L. Grigorian, E. Richter, and P. C. Eklund, Phys. Rev. Lett. 80 (1998).
- Milnera et al. (2000) M. Milnera, J. Kürti, M. Hulman, and H. Kuzmany, Phys. Rev. Lett. 84, 1324 (2000).
- Jorio et al. (2001) A. Jorio, R. Saito, J. H. Hafner, C. M. Lieber, M. Hunter, T. McClure, G. Dresselhaus, and M. S. Dresselhaus, Phys. Rev. Lett. 86, 1118 (2001).
- Venkateswaran et al. (1999) U. D. Venkateswaran, A. M. Rao, E. Richter, M. Menon, A. Rinzler, R. E. Smalley, and P. C. Eklund, Phys. Rev. B 59, 10 928 (1999).
- Thomsen et al. (1999) C. Thomsen, S. Reich, A. R. Goñi, H. Jantoljak, P. Rafailov, I. Loa, K. Syassen, C. Journet, and P. Bernier, phys. stat. sol. (b) 215, 435 (1999).
- Dobardžić et al. (2003) E. Dobardžić, I. Milošević, B. Nikolić, T. Vuković, and M. Damnjanović, Phys. Rev. B 68, 045408 (2003).
- Kürti et al. (2003) J. Kürti, V. Zólyomi, M. Kertesz, and G. Sun, New Journal of Physics 5, 125 (2003).
- Kramberger et al. (2003) C. Kramberger, R. Pfeiffer, H. Kuzmany, V. Zólyomi, and J. Kürti, Phys. Rev. B 68, 235404 (2003).
- Bacsa et al. (2002) R. R. Bacsa, A. Peigney, C. Laurent, P. Puech, and W. S. Bacsa, Phys. Rev. B 65, 161404(R) (2002).
- Richter and Subbaswamy (1997) E. Richter and K. R. Subbaswamy, Phys. Rev. Lett. 79, 2738 (1997).
- Strano et al. (2003) M. S. Strano, S. K. Doorn, E. H. Haroz, C. Kittrell, R. H. Hauge, and R. E. Smalley, Nano Letters 3, 1091 (2003).
- Kataura et al. (1999) H. Kataura, Y. Kumazawa, I. Umezu, S. Suzuki, Y. Ohtsuka, and Y. Achiba, Synth. Met. 103, 2555 (1999).
- Trallero-Giner et al. (1992) C. Trallero-Giner, A. Cantarero, M. Cardona, and M. Mora, Phys. Rev. B 45, 6601 (1992).
- Khan and Allen (1984) F. Khan and P. Allen, Phys. Rev. B 29, 3341 (1984).
- Verissimo-Alves et al. (2001) M. Verissimo-Alves, R. B. Capaz, B. Koiller, E. Artacho, and H. Chacham, Phys. Rev. Lett. 86, 3372 (2001).
- Soler et al. (2002) J. M. Soler, E. Artacho, J. D. Gale, A. García, J. Junquera, P. Ordejón, and D. Sánchez-Portal, J. Phys. Condens. Mat. 14, 2745 (2002).
- Perdew and Zunger (1981) J. P. Perdew and A. Zunger, Phys. Rev. B 23, 5048 (1981).
- Troullier and Martins (1991) N. Troullier and J. Martins, Phys. Rev. B 43, 1993 (1991).
- Junquera et al. (2001) J. Junquera, O. Paz, D. Sánchez-Portal, and E. Artacho, Phys. Rev. B 64, 235111 (2001).
- Reich et al. (2002) S. Reich, C. Thomsen, and P. Ordejón, Phys. Rev. B 65, 155411 (2002).
- Kürti et al. (1998) J. Kürti, G. Kresse, and H. Kuzmany, Phys. Rev. B 58, 8869 (1998).
- Sánchez-Portal et al. (1999) D. Sánchez-Portal, E. Artacho, J. M. Soler, A. Rubio, and P. Ordejón, Phys. Rev. B 59, 12678 (1999).
- Cardona (1982) M. Cardona, in Light Scattering in Solids II, edited by M. Cardona and G. Güntherodt (Springer, Berlin, 1982), vol. 50 of Topics in Applied Physics, p. 19.
- Reich and Thomsen (2000) S. Reich and C. Thomsen, Phys. Rev. B 62, 4273 (2000).
- Bachilo et al. (2002) S. M. Bachilo, M. S. Strano, C. Kittrel, R. H. Hauge, R. E. Smalley, and R. B. Weisman, Science 298, 2361 (2002).
- Telg et al. (submitted, 2004) H. Telg, J. Maultzsch, S. Reich, F. Hennrich, and C. Thomsen (submitted, 2004); H. Telg, J. Maultzsch, S. Reich, F. Hennrich, and C. Thomsen, in Structural and Electronic Properties of Molecular Nanostructures, edited by H. Kuzmany, J. Fink, M. Mehring, and S. Roth (Melville, New York, 2004), AIP Conference Proceedings.
- (28) Bachilo et al. Bachilo et al. (2002) provide an empirical formula which reproduces their measurements in a systematic manner and allows an assignment of our peaks. It yields eV and cm-1 for the (14,1) nanotube, providing the best match with our peak at 206 cm-1. For the second peak, both (11,0) and (10,2) nanotubes provide a good match. Our argumentation does not depend strongly on this particular assignment and we therefore assign this peak to the (11,0) nanotube, which can be directly compared with the theory. The (14,1) peak in Fig. 3b contains a resonant contribution from other nanotubes not shown in (a) for clarity.
- Henrard et al. (1999) L. Henrard, A. Loiseau, C. Journet, and P. Bernier, Synth. Met. 103, 2533 (1999).