Epidemic spreading on undirected and directed scale-free networks with correlations
Abstract
Many complex networks have a common structure with power-law degree distributions, however the details such as the degree-degree correlations are different in social, technological, and biological systems. We numerically investigate the epidemic spreading on the network with a variety of correlations: the assortative, uncorrelated, and disassortative mixings. In a simulation for the mean-field-like susceptible-infected-recovered model, we observe different epidemic behavior according to the types of correlations particularly in a directed network. Our results suggest that the assortative connections between nodes with similar degrees enhance the epidemic spreading more significantly than the uncorrelated and disassortative connections between cooperative nodes with high and low degrees.
pacs:
87.23.Ge, 89.20.-a, 89.75.Hc, 05.10.-aSelf-organized complex networks have attracted a great attention to statistical physicists, computer scientists, and mathematical biologists, since many empirical studies have revealed the fact that a structure is commonly found in social, technological, and biological networks. The structure is called scale-free (SF) Barabasi99 and follows a power-law distribution , , for the number of nodes with degree . Since the heterogeneous characteristics of the SF network is crucial for the robustness of connectivity against failures Albert00a , the efficiency of information delivery Cancho01 , and the spread of epidemic disease transmitted by means of social or sexual contacts, e-mails, Internet, and so forth Satorras04 , we expect that the evolutional mechanisms and the structural properties of the SF network Albert00a are useful for improving the efficiency and the robustness of power supply, communication, and economy systems.
On the other hand, recent studies classify networks according to quantities of connectivity correlations of nodes with their neighbors Vazquez02 ; social networks tend to have assortative connections between peers with similar degrees Capocci03 Newman02c , while technological or biological networks tend to have disassortative ones between those nodes with high degrees, namely hubs, and those with low degrees Vazquez02 Newman03 . The properties for the epidemic incidence Moreno03 and for the percolation Vazquez03a have been compared in the considered forms of correlations defined as a weighted combination of the uncorrelated (or arbitrary correlated) term and the fully assortative term: a fully assortative connection allows only two nodes with the same degree to be connected. However the relation of the results stated above to the evolutional mechanisms of network is still unclear. Only a few analytical forms of correlations have been derived from the tree model Krapivsky01 and the configuration model restricted such that at most one link exists between any pair of nodes Park03 . Although the configuration model produces disassortative mixing, a non-trivial distribution of the desired degrees must be given for wiring in advance. Also, difficulties in estimating the conditional probability of degree-degree connectivity even from empirical data has been pointed out Dorogovtsev03 . Apart from the evolutional mechanisms, a numerical simulation has shown that the introduction of assortative hub-hub connections between different local areas on a lattice has the effects to shorten the average delivery time and to enlarge the spread of infection Singh03 . However, neither theoretical solutions nor numerical studies for the epidemic behavior have been reported except for the above special forms of correlations.
We study epidemic spreading on the SF network with a variety of assortative, disassortative, and uncorrelated connections, which are not specialized in social, technological, or biological systems. First, we review two growing network models: one is called the duplication-divergence model Vazquez03b , which is equipped with a control parameter of connectivity correlations between the assortative and the disassortative mixings, and the other is called the directed growing model, in which the existence of correlations is suggested Dorogovtsev03 . Then, we will estimate the conditional probability of degree-degree correlations from the average realizations of the growing network models. This estimation method can be applied to other network models. By using the estimated probability, we numerically investigate the epidemic behavior for the mean-field-like equations of the susceptible-infected-recovered/removed (SIR) model. We find different epidemic behavior according to the types of correlations.
(a)
(b)
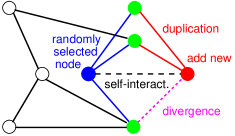
Let us consider the growing network models shown in Figs. 1 (a) and (b). The following procedures are repeated until the network reaches to the required size .
Dup: duplication-divergence model Vazquez03b
-
1.
At each time step, a new node is added to the network.
-
2.
Simultaneously, a node is randomly chosen, and new (undirected) links between all the neighbors of and the new node are duplicated.
-
3.
With probability , a link between and is established (self-interaction).
-
4.
In the divergence process, each duplicated link is removed with probability .
These local rules are biologically plausible Sole03 . Note that larger enhances the assortativity of network generated by the above rules because the self-interaction means connecting a pair of nodes with similar degrees. In other words, is a control parameter of the correlation.
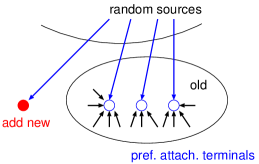
Dir: directed growing model Dorogovtsev03
-
1.
At each time step, a new node is added and connected from a randomly chosen node.
-
2.
Simultaneously, new links emerge from randomly chosen nodes in the network.
-
3.
The terminals of the new links become attached to nodes chosen with shifted linear preference Krapivsky01 : a node with in-degree is chosen as the terminal of a new link with probability proportional to , where is a positive constant.
The generation of new links includes the wiring between old nodes at each time step. In addition, to keep the connectivity of network, the first procedure is modified from the probabilistic addition of new nodes in Ref. Dorogovtsev03 . If a multi-link between already connected nodes or self-loop is created, it is skipped in the directed growing model, while there is no such link in the duplication-divergence model. In a sense of reality, the sender and the receiver of transmitted information or objects are distinguished from each other on a directed link.
| Model | ||||||||
|---|---|---|---|---|---|---|---|---|
| Dup | Ass | 0.9 | 0.42 | - | - | 7.463 | 45 | 122 |
| Unc | 0.3 | 0.48 | - | - | 7.356 | 55 | 159 | |
| Dis | 0.1 | 0.5 | - | - | 7.395 | 62 | 237 | |
| Dir | Ass | - | - | 3.0 | 7 | 7.33 | 80 | 142 |
| Unc | - | - | 2.1 | 9 | 7.354 | 251 | 339 |
In the directed growing model, the rate equations for the in-degree distribution are written as
| (1) |
where , , is Kronecker’s delta, the number of nodes with degree is denoted by as similar to Ref. Krapivsky01 , and we obtain the solution
| (2) |
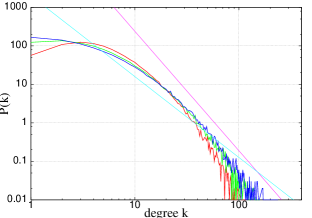
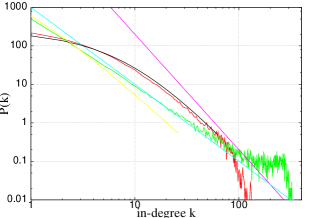
The second column of Table 1 shows the values of the parameters used in our simulation. Ass, Unc, and Dis denote the assortative, uncorrelated, and disassortative networks, respectively. We regulate these values so that they produce similar average degrees , because it is obvious that the epidemic spreading becomes larger as the degrees increase. Fig. 2 shows distributions of the degree and the connectivity correlation , where is the conditional probability of the connections between nodes with degrees and in Dup, or the connections from nodes with in-degree to those with in Dir. The degree distributions exhibit the power-law behavior: the exponents vary as corresponding to the parameters of Ass and Unc in Dir (Fig. 2 (b)), while they are close to each other in Dup (Fig. 2 (a)). The correlations are controlled between Ass and Dis in Dup (Fig. 2 (c)), while they are controlled between Ass and Unc that is nearly uncorrelated with very weak correlations in Dir (Fig. 2 (d)). If the connections are replaced by reciprocal ones after the configuration of Dir, the degree distribution becomes exponential, and the correlation disappears.
(a)
(b)
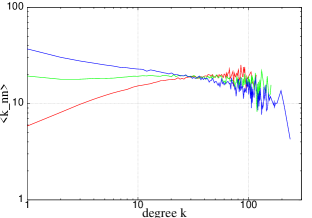
(c)
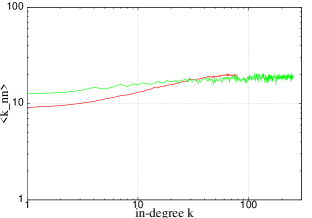
(d)
Next, we consider the SIR model in which individual nodes have three states: susceptible, infected, and recovered/removed. The densities of the nodes with degree (or in-degree in Dir) in the respective states are denoted by , , . By definition, the normalization condition holds at each time . Note that we distinguish the time-scales and for the evolution of network and the spreading of viruses. After the construction of a network for the Dir or Dup model, from an initial infected node, the epidemics is propagated by contacts between infected and susceptible individuals (from infected nodes to susceptible nodes through directed links in Dir) at the rate . The infected node is removed at the rate . Once an individual gets infected and then recovers or removed, the state is never changed any more. The microscopic stochastic simulation needs very expensive computation for studying the epidemic properties, therefore a macroscopic mean-field approximation is useful. We consider the spreading on the averages of randomly generated networks for each of Dup and Dir.
Following Ref. Boguna03 , the mean-field-like rate equations for the evolution of densities can be expressed as
| (3) |
| (4) |
where in the r.h.s of Eqs. (3) and (4) denotes the expectation of infection at degree ,
| (5) |
the factor is added taking account of the fact that one of the links is not available for transmitting the infection because it was already used Boguna03 . As applied to Fig. 2 (c) or (d), the is estimated from the average over 100 realizations for each parameter specification presented in Table 1. Since some degrees are missing in the range over the realizations, we apply the cut-off value defined by .
(a)
(b)

(c)
(d)
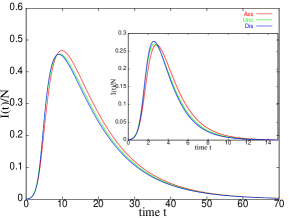
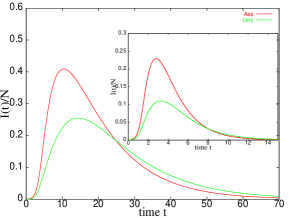
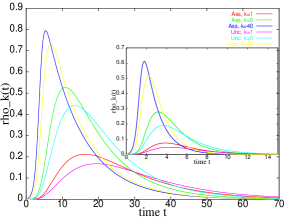
We numerically investigate the dynamic behavior depends on the connectivity correlations by using the 4-th order Runge-Kutta method for Eqs. (3) and (4) with a step width . In our simulation, we assume that an initial infection source is only on a hub with the degree . Hence, for the other degrees we set and . This assumption is natural since the hub is much more vulnerable against infection through the active communications with the outside.
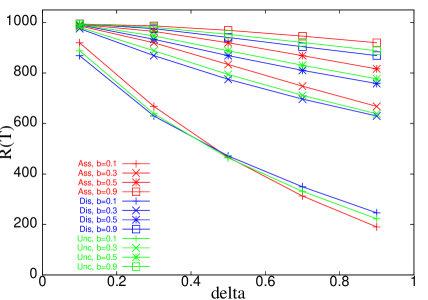
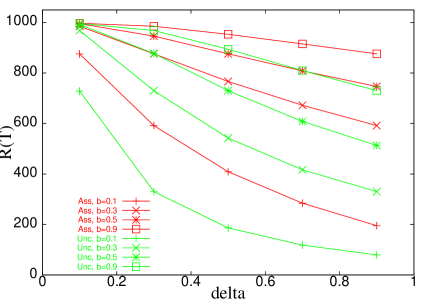
Figs. 3 (a) and (b) show the fraction of the infected nodes , and we see in the case of Ass (red line) it is slightly more insistent (Fig. 3 (a) for Dup) or larger (Fig. 3 (b) for Dir) than that in the case of Dis (blue line) and Unc (green line). The densities of the infected nodes in Figs. 3 (c) and (d) show a property similar to that of . The value of becomes larger as the degree increases, therefore the infection from the nodes with high degrees are dominant in the of Eq. (5) in particular through assortative connections. Fig. 4 shows the epidemic incidence , which denotes the number of transitions from the total infected nodes. We set taking the convergent time in Fig. 3 into account. The incidence is higher in the assortative networks (red line) than that in uncorrelated (green line) or disassortative networks (blue line), except at and in Dup. The exceptions suggest that the immune rate is an important factor for small . In other words, if we set by a variable change of time for Eqs. (3) and (4), we must use , which may be larger than 1, instead of . These differences according to the types of correlations remarkably appear in Dir with smaller . Furthermore, similar results are also obtained in the directed growing model based on preferentially attached terminals and sources by the in- and out-degrees, respectively.
(a)
(b)
In summary, we have numerically found different spreading properties on SF networks according to the connectivity correlations estimated from the averages of the growing models Dorogovtsev03 Vazquez03b . The differences are remarkable in the directed model. The results suggest that assortative connections enhance the epidemic spreading, and also they could contribute to improve the efficiency of information delivery. In contrast, the disconnections or setting gatekeepers between nodes with similar degrees becomes a local defense strategy such as acquaintance immunization Cohen03 for the spreading of viruses. Further works will be carefully considered for comprehending the effects of correlations on the spreading.
References
- (1) R. Albert, H. Jeong, and A.-L. Barabási, nature 406, 378, (2000).
- (2) A.-L. Barabási, R. Albert, and H. Jeong, Physica A 272, 173, (1999).
- (3) R.F.i Cancho, and R.V. Solé, SantaFe Inst. Working Paper, 01-11-068, (2001).
- (4) R. Pastor-Satorras, and A. Vespignani, Evolution and Structure of the Internet, -A Statistical Physics Approach-, Cambridge, 2004.
- (5) A. Vázquez, R. Pastor-Satorras, and A. Vespignani, Phys. Rev. E 65, 066130, (2002).
- (6) A. Capocci, G. Caldarelli, and P. De Los Rios, Phys. Rev. E 68, 047101, (2003).
- (7) M.E.J. Newman, Phys. Rev. Lett. 89, 208701, (2002).
- (8) M.E.J. Newman, Phys. Rev. E 67, 026126, (2003).
- (9) Y. Moreno, J.B. Gómez, and A. F. Pacheco, Phys. Rev. E 68, 035103(R), (2003).
- (10) A. Vázquez, and Y. Moreno, Phys. Rev. E 67, 015101(R), (2003).
- (11) P.L. Krapivsky, and S. Redner, Phys. Rev. E, 63, 066123, (2001).
- (12) J. Park, and M.E.J. Newman, Phys. Rev. E 68, 026112, (2003).
- (13) S.N. Dorogovtsev, and J.F.F. Mendes, Evolution of Networks -From Biological Nets to the Internet and WWW, Oxford University Press, 2003.
- (14) B.K. Singh, and N. Gupte, e-print cond-mat/0312090.
- (15) A. Vázquez, Phys. Rev. E 67, 056104, (2003).
- (16) R.V. Solé, R. Pastor-Satorras, E. Smith, and T. Kepler, Adv. Complex Syst, 5, 43, (2002). In S. Bornholdt, and H.G. Schuster (eds.) Handbook of Graphs and Networks -From the Genome to the Internet-, Chapter 7, pp.145-167, WILEY-VCH, 2003.
- (17) M. Boguñá, and R. Pastor-Satorras, e-print cond-mat/0301149, In R. Pastor-Satorras et. al (eds.) Lecture Notes in Physics 625, Chapter 7, pp.127-147, Springer, 2003.
- (18) R. Cohen, S. Havlin, and D. ben-Avraham, Phys. Rev. Lett. 91, 247901, (2003).