Abstract
Phase dynamics has been measured in a driven mesoscopic Josephson oscillator where the resonance is tuned either by magnetic flux or by gate charge modulation of the Josephson inductance. Phenomena are analyzed in terms of a ”phase particle picture”, and by numerical circuit simulations. An analogy to switching of a DC-biased junction into voltage state is discussed. Operation principle of the recently demonstrated Inductive Single-Electron Transistor (L-SET) based on the driven oscillator is reviewed. The obtained charge sensitivity implies that a performance comparable to the best rf-SETs has already been reached with the novel device.
Direct measurements of tunable Josephson plasma resonance in the L-SET
1 Introduction
Quantum measurement in the solid state has been shown to be feasible as several impressive realizations of qubits based on mesosocopic superconducting tunnel junctions have emerged [1, 2, 3, 4]. Sensitive measurement of physical quantities close to the limit set by the uncertainty principle is, on the other hand, an important issue in its own right.
The Single-Electron Transistor (SET) is a basic mesoscopic detector, sensitive to electric charge on a gate capacitor. In order to gain advantage of the inherently large bandwidth 10 GHz of the SET charge detector, basically two new technologies have been developed where the SET is read using an oscillator built from ”macroscopic” components but coupled directly to it. The ”rf-SET” (Radio-Frequency SET) [5] is based on gate modulation of the -value of the oscillator.
Because of limitations due to the dissipative nature of the rf-SET, a principally non-dissipative ”L-SET” (Inductive SET) technique has been developed very recently [6]. The L-SET is based on reactive readout of the Josephson inductance of a superconducting SET (SSET) in a resonator configuration [7]. Due to correlated Cooper pair tunneling, it does not exhibit shot noise or excessive dissipation.
In this paper we first review the operating principle of the L-SET charge detector. Then we concentrate on discussing classical dynamics of the phase under the microwave drive, and we present new experimental data. In particular, we discuss dynamical effects in the L-SET resonator which resemble the switching of a DC-biased Josephson junction into voltage state by drive or noise.
2 The L-SET circuit
In the absence of DC bias voltage, a SSET has the Hamiltonian
| (1) |
where is the gate charge, and is the phase difference across the SSET, assumed to be a classical variable here due to an environment having impedance much smaller than k. is the single-junction Josephson energy, and the charging energy is related to sum capacitance by . Eigenvalues of this well-known Hamiltonian form bands (see Fig. 1).
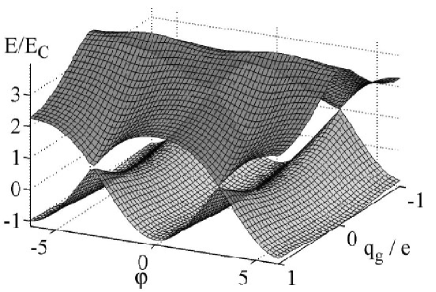
At the lowest band , the energy increases approximately quadratically as a function of the phase when moved to either direction from the minimum at . This type of dependence is characteristic of an inductor. The effective Josephson inductance of the SSET is then
| (2) |
where the Josephson coupling has the effective value
| (3) |
Here, is the flux quantum.
Since the energy band, and consequently, the inductance, depend on the gate charge , the L-SET electrometer is built so that the resonance frequency of an tank circuit connected to a SSET is tunable by . This allows in principle a purely reactive readout.
The L-SET circuit we use is shown in Fig. 2 where the SSET is coupled in parallel to an oscillator resonant at the frequency , roughly at 600 MHz. The total system has the gate-dependent plasma resonance at , where . The bandwidth , where is the coupled quality factor, is typically in the range of tens of MHz.
The resistor in series with the SSET is a model component for dissipation. As compared to the more standard way of drawing a resistor in parallel with the resonator, we got here a better agreement with the non-linear dynamics (see section 6.3).
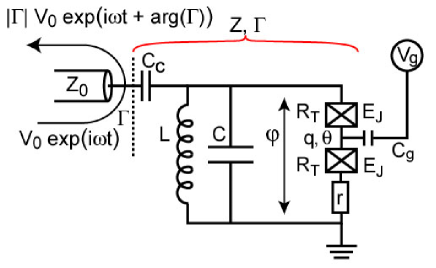
Charge detection is performed by measuring a change of amplitude or phase of the voltage reflection coefficient , when the setup is irradiated by microwaves of frequency roughly . In the best sample so far [8], we have measured charge sensitivity e over a bandwidth of about 100 MHz.
3 Plasma oscillations in L-SET
Dynamics of the L-SET oscillator can be analyzed in terms of a potential due to the Josephson inductance and the shunting , respectively, at the ground band approximately
| (4) |
At small oscillation amplitude, the phase particle experiences harmonic oscillations around , whose frequency is controlled by gate-tuning of the Josephson inductance (Fig. 3 (a)). This mode of operation, where the L-SET works as a charge-to-frequency converter, is the ”harmonic mode”.
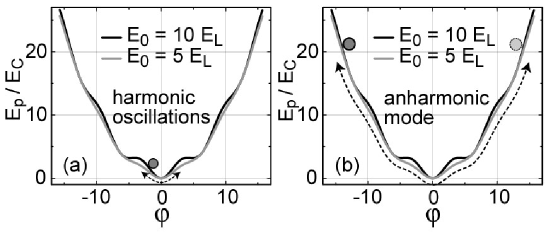
Once the oscillation amplitude is increased close to the critical current at , the term changes the local curvature of the potential, and hence, the resonance frequency changes. At very high amplitude, Fig. 3 (b), the cosine wiggle becomes averaged out. Thus, we expect a change of resonant frequency from to roughly at an AC current of critical current magnitude. This change of resonance frequency when the sample is probed by critical power is reminiscent of a DC-biased Josephson junction switching into a voltage state [9].
At large excitations above , the highly nonlinear oscillator experiences complicated dynamics which does not in general allow analytical solutions. Numerical calculations over a large range of parameters, however, show consistently that the system response depends on also in this case [8]. This mode of operation of the L-SET charge detector we call the ”anharmonic” mode.
4 Simulation scheme
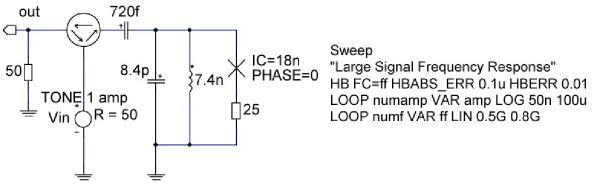
We simulated the transition from linear to non-linear oscillations in the L-SET circuit with the Aplac circuit simulation program which contains an implementation of a Josephson junction element. The SSET was modeled as a single tunable junction. We used the method of harmonic balance where amplitudes of the first and three upper harmonics were optimized to create an approximate solution. Screenshot of the simulation schematics is shown in Fig. 4.
5 Experiment
The measurements were done in a powerful Leiden Cryogenics MiniKelvin dilution refrigerator. At the base temperature of 20 mK, we used a microwave circulator which had about 20 dB backward isolation to cut back-action noise from the 4 Kelvin preamplifier [10].
The reflected probing excitation was amplified with a chain of amplifiers having a total of 5 K noise temperature, and detected with a network analyzer or a spectrum analyzer.
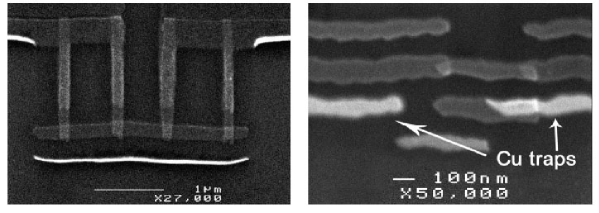
We studied two samples (Table 1 and Fig. 5) where sample 1 had a tunable . Since it had , where the temperature was probably set by leakage through the circulator, its response had a hardly detectable gate modulation. Accordingly, we were able to study the plasma resonance in an almost classical junction.
Sample 2 (discussed in Ref. [6], see section 6.1) was a sensitive detector, with a 15 MHz gate shift of the resonance frequency.
| \sphlinesample | (k) | (K) | (K) | (nH) | (nH) | (pF) | (pF) | |
|---|---|---|---|---|---|---|---|---|
| 1 | 4.2 | 3.5 … 0 | 0.17 | 6 | 3 | 23 | 0.72 | 13 |
| 2 | 9.6 | 1.6 | 0.92 | 16 | 7.4 | 8.4 | 0.72 | 18 |
| \sphline |
6 Results and discussion
6.1 Charge detection
For sample 2, , and hence, phase was properly localized in the potential. Accordingly, we got a rather good agreement for gate modulation of the resonance frequency (Fig. 6), where the resonance moves 15 MHz with respect to gate charge. This agrees well with the expectation of only 15 % modulation of based on the rather high of this sample. The minimum (w.r.t. gate) of , fitted best with 18 nH is about 20 % higher than expected. This is probably due to a small amount of phase noise, or partially due to inaccuracies in determination of the parameters.
Charge sensitivity was measured using amplitude readout. In the harmonic mode we got e at the maximum power dBm, corresponding to 20 fW dissipation in the whole resonator circuit. Note that due to Cooper pair tunneling, the power is not dissipated in the SSET island. In the anharmonic mode, significantly better sensitivity of e was obtained.
6.2 Harmonic oscillations
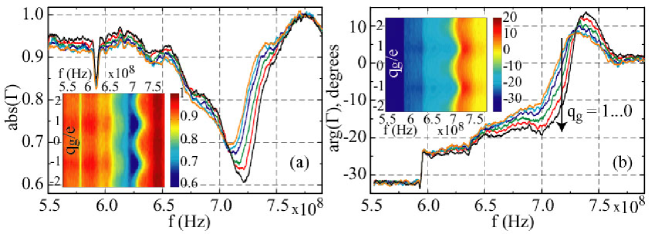
In Fig. 7 we plot data from sample 1 which behaves almost as a classical junction with negligible charging effect. By applied magnetic flux we tune simultaneously of both SQUID-shaped junctions of the SSET, and hence, . Periodicity of the resonance frequency with respect to applied magnetic flux is evident.
A prominent feature in Fig. 7 is the absence of reflected signal at ”critical” points where the resonance frequency switches to . This implies a strong dissipation which is visible as coupling to . Pronounced dissipation at the critical points is representative of strong fluctuations at the artificial ”phase transition” points.
In Fig. 8 we plot measured at a low excitation, roughly 1/10 of critical current peak amplitude. The data are fitted to theoretical flux modulation of . A symmetric SQUID has been assumed, where which affects the ratio and thus (see Eqs. 2 and 3). It is clear that something else is happening at low , where the resonance meets more rapidly than expected. Rounding of the cusp in experimental data cannot be explained by asymmetry in the SQUIDS either, since then the resonance would deviate from true which is not the case.
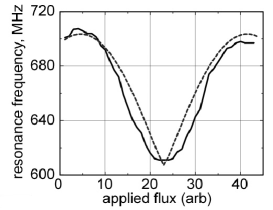
We argue this effect is due to ”premature switching” caused by noise in the oscillator. The effect is again in analogy to physics in a DC-biased junction, namely, noise-induced switching and delocalization of phase. In contrast to running of phase in a tilted washboard, the average of phase stays at zero in our case. Noise-induced switching happens when peak phase fluctuations reach . This condition corresponds to random motion of the phase particle at the bottom of the potential of Fig. 3 (a) with rms amplitude .
6.3 Switching and nonlinear oscillations
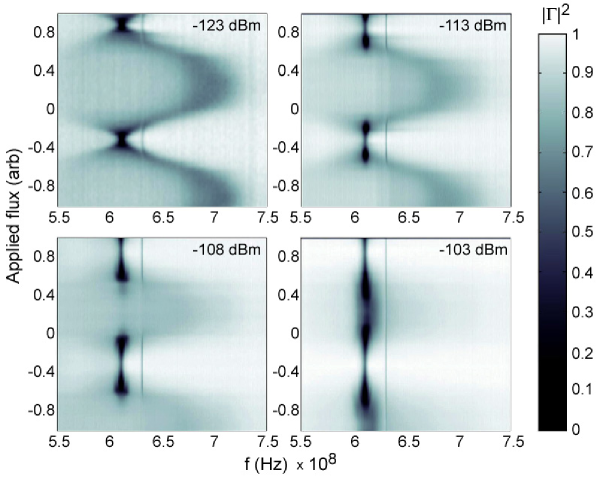
In this section, the discussion is based on experimental data from sample 2. In Fig. 9, at dBm, the resonant frequency switches from the broad plasma resonance, centered at 720 MHz, into a narrower tank resonance at 613 MHz. The wavelike texture at dBm is due to the Josephson-potential.
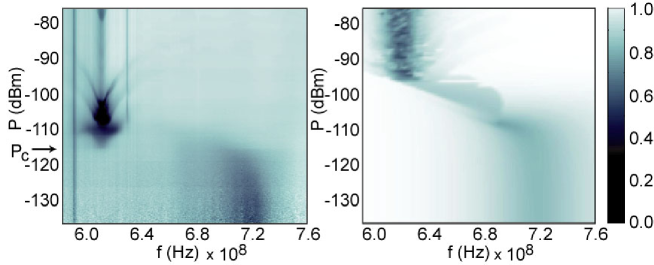
Changes in coupling, e.g., that goes through critical coupling at dBm, and sharpening of the resonance above , are due to an increase of the internal -value from 20 up to several hundreds. Since , and since acquires a large effective value at a high drive due to cancelling of positive and negative contributions, the supposed dissipation of in series with the SSET has less effect at .
The source of the dissipation modelled by the resistor , probably situated in the SSET itself, is presently unknown, but it may be related to quasiparticle poisoning. It also limits the quality factor up to 20 approximately.
Also plotted in Fig. 9 is an Aplac simulation for the circuit. It presents a qualitative agreement with experiment and predicts roughly correctly the end of the linear regime of plasma resonance. However, in experiment the switching is markedly sharp, which we attribute to the effect of higher bands of the SSET [12].
Acknowledgements.
It is a pleasure to thank T. Heikkil , G. Johansson, R. Lindell, H. Sepp , and J. Viljas for collaboration. This work was supported by the Academy of Finland and by the Large Scale Installation Program ULTI-3 of the European Union (Contract HPRI-1999-CT-00050).99
References
- [1] Y. Nakamura, Yu. A. Pashkin, and J. S. Tsai, Coherent control of macroscopic quantum states in a single-Cooper-pair box, Nature 398, 786 (1999).
- [2] D. Vion et al., Manipulating the Quantum State of an Electrical Circuit, Science 296, 886 (2002).
- [3] Y. Yu, S. Han, X. Chu, S. Chu, and Z. Wang, Coherent Temporal Oscillations of Macroscopic Quantum States in a Josephson Junction, Science 296, 889 (2002).
- [4] J. M. Martinis, S. Nam, J. Aumentado, and C. Urbina, Rabi Oscillations in a Large Josephson-Junction Qubit, Phys. Rev. Lett. 89, 117901 (2002).
- [5] R. J. Schoelkopf et al., The Radio-Frequency Single-Electron Transistor (RF-SET): A Fast and Ultrasensitive Electrometer, Science 280, 1238 (1998).
- [6] M. A. Sillanp , L. Roschier, and P. J. Hakonen, Inductive Single-Electron Transistor, Phys. Rev. Lett., to appear (2004); cond-mat/0402045.
- [7] A. B. Zorin, Radio-Frequency Bloch-Transistor Electrometer, Phys. Rev. Lett. 86, 3388 (2001).
- [8] M. A. Sillanp et al., to be published.
- [9] A similar effect was recently observed by I. Siddiqi et al., Direct Observation of Dynamical Switching between Two Driven Oscillation States of a Josephson Junction, cond-mat/0312553.
- [10] L. Roschier and P. Hakonen, Design of cryogenic 700 MHz amplifier, Cryogenics 44, 783 (2004).
- [11] A. Aassime, G. Johansson, G, Wending, R. J. Schoelkopf, and P. Delsing, Radio-Frequency Single-Electron Transistor as Readout Device for Qubits: Charge Sensitivity and Backaction, Phys. Rev. Lett. 86, 3376 (2001).
- [12] In a more classical junction, the transition is less sharp; Mika A. Sillanp , Leif Roschier, and Pertti J. Hakonen, Dynamics of the Inductive Single-Electron Transistor, submitted to Proceedings of the Vth Rencontres de Moriond in Mesoscopic Physics (2004).