Conformation (statistics and dynamics) Structure of associated liquids: electrolytes, molten salts, etc Macromolecular and polymer solutions; polymer melts, swelling
Srongly Charged Polymer Brushes
Abstract
Charged polymer brushes are layers of surface-tethered chains. Experimental systems are frequently strongly charged. Here we calculate phase diagrams for such brushes in terms of salt concentration , grafting density and polymer backbone charge density. Electrostatic stiffening and counterion condensation effects arise which are absent from weakly charged brushes. In various phases chains are locally or globally fully stretched and brush height has unique scaling forms; at higher salt concentrations we find , in good agreement with experiment.
pacs:
36.20.Eypacs:
61.20.Qgpacs:
61.25.Hq1 Introduction
Charged polymer layers are a major concern of polymer science, featuring in numerous applications such as colloid stabilization, surface modification technologies, membrane preparation [1] and emerging biotechnologies [2]. A much-studied class of layer is the polymer brush, an assembly of chains end-tethered to a substrate (see fig. 3). Charged brushes are important in biosensor technologies such as DNA microarrays [2] and have provided model systems to study collective physics of charged polymers at interfaces [3, 4, 5, 6, 7, 8, 9]. Properties such as brush height have been measured by the surface force apparatus, neutron scattering and other techniques [3, 4, 5]. The principal theoretical frameworks have been self consistent field theory and scaling theory [6]. Scaling theories identified distinct brush “phases” [7, 8] and later a full “phase” diagram of brush types [9].
Most of this theoretical work has addressed weakly charged brushes where local Gaussian chain statistics are only weakly perturbed by electrical forces. Real polymers, however, are frequently strongly charged. The natural measure of this is the reduced backbone density (“Manning parameter”) where is the (monovalent) charge spacing and the Bjerrum length Å in water. Strongly charged polymers include single-stranded DNA ( [10]) and the widely studied polystyrensulfonate, PSS (e.g. at 80% sulfonation [4]). When is not small, two qualitatively new effects arise. (i) Strong repulsive forces may stretch chains beyond the linear Gaussian regime into rodlike configurations with end-to-end size of order the chain contour length itself: the polymer size saturates. (ii) Manning condensation [11]. When , a rodlike polymer attracts its own counterions so strongly that a fraction condenses into a region close to the polymer, renormalizing the effective Manning parameter to unity, . The implications of (i) and (ii) have been explored theoretically in certain brush regimes [12, 13, 14].
The aim of this letter is to establish complete phase diagrams for strongly charged brushes. One of our motivations is the urgent need to establish physics underlying DNA microarrays, a technology based on DNA layers of enormous importance in health care, drug development and basic biological research. We will show that the saturation and Manning condensation effects described above, (i) and (ii), lead to brush phases whose scaling forms for brush height and counterion layer thickness have no counterparts among weakly charged brushes [9]. Two brush classes are identified, defined by the magnitude of the intrinsic persistence length, . Polymers in the “strong” class () are strongly perturbed by charges, suffering length saturation for high enough backbone charge density whereas for “weak” systems () Manning condensation intervenes before saturation can onset. Correspondingly, each class has a distinct brush phase diagram. The key point is that typical experimental brush systems are “strong” and their chains locally fully stretched, invalidating results based on flexible Gaussian polymer concepts. Brush height then depends on the salt-dependent persistence length for a semi-flexible polymer. The dependence of on salt concentration remains a highly controversial question [15, 16]. Here we take , a relation with considerable empirical support [10, 17], where is the Debye screening length. For the particularly experimentally important “quasineutral” brushes our theory then predicts , in good agreement with experiment [3, 4]. Interestingly, no such agreement is obtained if one uses the often cited alternative quadratic OSF form [15], . Thus brush experimental data comes down rather firmly on the side of the relation.
2 Single Chains
To appreciate saturation and condensation effects, it is helpful to first review results for a single charged chain of contour length and charge [18]. Throughout, we assume ideal Gaussian chain statistics in the absence of charges. For small charge, the chain size is . When becomes large, internal repulsions exert a stretching force [9] (setting ) where is the extended chain size. Balancing this with the elastic restoring force and using gives the electrostatic “blob” size
| (1) |
For small scales statistics are essentially Gaussian, while on larger scales the polymer is electrostatically stretched into a linear string of blobs of length [18]
| (2) |
However, this result for cannot be correct for all charge densities: from eq. (1) when the blob shrinks to one persistence length and the chain size becomes . This is size saturation; further charging produces no further extension. (In this study, the window between onset of non-Gaussian behavior and complete size saturation is ignored for simplicity.)
This suggests for . However, this reasoning neglects Manning condensation. Since the charge per blob is , the string of blobs has an effective linear charge density coarse-grained over the blob size equal to
| (3) |
Counterion condensation is triggered when , i.e., when . If we now consider a chain charging process (decreasing from ), this leads us to define 2 classes of polymer: (1) The weak class, . In this case , so Manning condensation onsets before saturation. Thus eq. (2) for chain size remains valid until when the polymer reaches its maximum size, . Charging beyond generates just enough condensate to pin the effective charge spacing to . is pinned to and saturation never occurs. (2) The strong class, . This includes most polymer species, e.g. PSS ( Å) [17] and B-DNA ( Å) [10]. Saturation now occurs before condensation can intervene, since . Thus eq. (2) is valid until saturation at . For higher charge densities, .
We remark that the treatment of Manning condensation for weak systems above is oversimplified. One can go beyond this by treating the string of blobs as a cylinder of radius . Adapting Ramanathan’s expression [19] for the potential at a charged cylinder, with , a charging process then yields the free energy for . Taking the derivative gives the stretching force and balancing this with we find , confirming that apart from the log factor chain size is indeed pinned to . Such logarithms, which arise elsewhere (e.g. eq. (1)) are ignored in the following for simplicity.
3 Brushes: Weak Systems
Consider now a brush of chains of the weak class, end-tethered to a surface at density . We begin with no added salt. Our results are shown as a phase diagram in fig. 1(a). The upper portion, , is the weakly charged region previously established by Pincus and Borisov et al. [7, 8, 9]. We now review their results. At low grafting densities lies the Independent Chains (IC) phase where layer height is essentially the single chain result, eq. (2), and the height of the counterion layer ensuring overall neutrality is the Gouy-Chapman length . These counterions exert a weak external stretching force per polymer, less than the internal force . To the left lies the Pincus brush (PB) where instead . The IC/PB boundary is , or . In the Osmotic brush (OB), the high grafting density localizes counterions in the brush [9], unlike PB and IC where . Thus the PB/OB boundary is or [9]. All 3 phases coincide at the triple point . What happens in the strongly charged region below ? The weakly charged brush theory naturally raises a question it cannot answer.
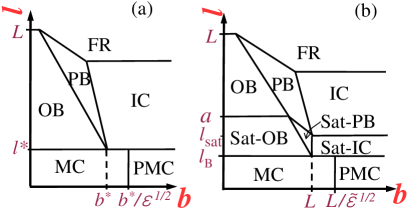
The single chain analysis suggests the answer: the dependence on is removed by Manning condensation. We find this is essentially correct, using similar free energy calculations to those described for single chains: for , brush height is fixed to (to within log factors) independent of or . This is the Manning condensation (MC) phase in fig. 1 (a). It has 2 sub-regions where (for ) and (for ). At the lowest grafting densities the MC phase gives way to the partial Manning condensation (PMC) region; here the counterions are so weakly attracted to the surface () that condensate evaporation onsets [20]. We find onset at , where the small parameter . Deep into the PMC region, enough condensate is lost that length saturation occurs, despite this being a weak system. Finally, the boundary of the uppermost “fully relaxed” (FR) region is defined by .
4 Brushes: Strong Systems
Now we consider strong systems, (see fig. 1 (b)). As expected from the single chain discussion, at high charge densities new saturated phases appear (indicated by prefix “Sat”) where brush height reaches its maximum possible value, . The IC region crosses over to Sat-IC at (see eq. (1)), while since chains in the OB have one charge per blob [9] saturation is at (recall, blob size equals persistence length at saturation) giving the Sat-OB phase. Between these two lies the saturated Pincus brush (Sat-PB). Its boundary with Sat-OB is or ; and with Sat-IC is or . Saturation effects shift the triple point to .
The essential feature of strong systems is that Manning condensation onsets after chains have saturated and are rod-like, when , i. e. . Analogously to the phases for weak systems, below lie the MC and PMC phases (fig. 1, where and is polymer thickness.)
5 Salt Effects
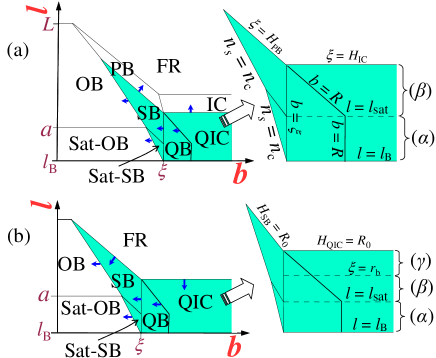
For any real brush screening effects of salt must be considered. For brevity, we discuss strong systems only and the typical case . We find Manning condensation then renormalizes any to with no evaporation effects. Thus fig. 2 shows only the portion of the phase diagram above ; the region below is mapped vertically onto this line. Figs. 2(a) and (b) show the two possible cases and .
Let us focus on the region affected by salt, shown shaded in fig. 2 (compare to the no-salt case, fig. 1). This expands with increasing salt concentration as indicated and is divided into two by the vertical line . To its left lie the salt brush (SB) and saturated salt brush (Sat-SB) phases where interactions are long-ranged and the stretching force is the differential osmotic pressure [9] of ions. The SB, established by weakly charged brush theories [7, 8, 9], saturates () at small , crossing over to the Sat-SB phase unique to strongly charged brushes. Equating the salt concentration to the brush counterion concentration defines the salt/osmotic boundaries. Thus the Sat-SB/Sat-OB boundary is .
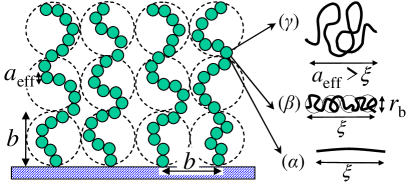
Moving to the right of one enters the quasineutral brush (QB) phases. Since the screening length is less than the chain separation , interactions are now short-ranged so chains behave as self and mutually avoiding polymers with a certain effective hard core monomer size, , defined as the separation between any two chain segments where their electrical interaction energy is order . Thus we adapt the Alexander-de Gennes theory of neutral brushes [6] viewing each chain as comprising blobs of size (see fig. 3). Depending on , there are three possible forms for : these are the three bands in the phase diagram, fig. 2, with corresponding structures shown in fig. 3. (1) In the saturated band, , polymers are locally rod-like as discussed for single chains. Flexibility is recovered on scales above (recall, we take persistence length ). Thus and there are effective monomers per polymer. (2) The intermediate band, . Here the charge density is below saturation and locally the polymer a string of electrostatic blobs of size (see eq. (1)). Thus and . (3) In the overscreened band, screening penetrates individual blobs, , reducing their unscreened electrostatic energy which by definition equals . Thus exceeds . From a Flory type calculation we find and .
Borrowing the neutral brush result [6], the brush height is , giving
| (4) |
This is one of our principal conclusions. The result for band has been derived previously by Borisov et al. [9]. Note the identical scaling for and is coincidental.
Finally, to the right of QB lies the quasineutral independent chains (QIC) region whose boundary is . The bands remain, and chain size is the standard self-avoiding result . This agrees qualitatively with the structure of a single charged chain found in ref. [16] though the predicted exponents differ.
We remark that if we assume the OSF form for persistence length [15], , we find a qualitatively similar phase diagram to fig. 2 but now: (i) between the Sat-SB and QB phases a very narrow saturated “Nematic Brush” region appears where rodlike effective monomers nematically order and (ii) new bands appear in the quasi-neutral phases. A crucial difference is that the predicted salt dependence in the QB regime is now .
6 Experiment
We conclude by comparing theory with two experimental studies of charged brushes. (1) Tran et al. [3] used neutron scattering to measure monomer density profiles of high density brushes ( Å, Å) of PSS on silicon at sulfonation levels 35% to 62%. Using a representative monomer size [21] 2.1 Å, this implies charge spacings Å. (2) Balastre et al. [4] studied less dense PSS brushes on mica ( Å, Å, sulfonation 84%-87%, i.e. Å) with the surface force apparatus.
Now PSS is a strong system ( Å) and both experimental systems are strongly charged, , thus belonging to the line in the strong phase diagram, fig. 2. Hence at low salt () we predict both systems lie in the Sat-OB phase with fully stretched chains. Indeed, the observed low salt brush heights are and in the Tran et al. and Balastre et al. studies, respectively. This is deep into the non-Gaussian regime [12, 13], confirming the chains are close to size saturation.
What happens when salt is added? Our theory predicts the system in effect moves along in fig. 2, passing from the Sat-OB phase () to the band of the QB phase () where chains are locally saturated. The predicted brush height is thus initially independent of salt concentration , then decaying as (eq. (4)). Something very close to these predictions is seen in both experiments: was roughly constant at low salt followed by a rather sharp transition to an approximate power law , with observed in ref. [3] and to in ref. [4]. The transition occurred at (ref. [4]) and (ref. [3]). Since the Tran et al. systems have very small , the QB is realized only at very high salt; we speculate the somewhat lower exponent and higher transition value for this data may originate from non-electrostatic interactions (more important at high salt).
Throughout, we assumed Gaussian statistics, i.e. solvents. How would different solvent conditions affect the strongly charged phases with saturation? (i) Good solvents are expected to produce no qualitative change, since these phases are already locally or globally almost fully expanded. (ii) Very poor solvents and ion-ion correlation effects have been predicted to induce brush collapse [8, 22]. For PSS, for example, water is a poor solvent for the PS backbone. However, for high charge densities solubility is recovered [3]; indeed, both PSS systems above exhibit highly extended brushes at high charge density [3, 4] as discussed.
In conclusion, we find strongly charged brushes exhibit unique phases where chains are globally or locally almost fully extended into rod-like configurations. Systematic experiments [3, 4] on strongly charged PSS brushes find brush height const. at low salt , crossing over to with exponents . It is tempting to interpret this in a weakly charged brush picture [7, 8, 9] as a transition from the osmotic () to the salt brush (). We find this is incorrect; the transition is in fact from a saturated osmotic brush () to a quasineutral brush with local saturation, for which we predict provided the persistence length scales linearly with Debye length, [10, 17]. The observed exponent is clearly inconsistent with the OSF [15] form which would give a stronger decay, .
Acknowledgements.
This work was supported by the National Science Foundation, grant nos. DMR-9816374 and CHE-0091460.References
- [1] H. Dautzenberg et al., Polyelectrolytes: Formation, Characterization and Application (Hanser, New York, 1994); S. Barker et al., Anal. Chem. 72, 4899 (2000).
- [2] D. Lockhart et al., Nat. Biotechnol. 14, 1675 (1996).
- [3] Tran Y., Auroy P. and Lee L.-T., Macromolecules, 32 (1999) 8952.
- [4] Balastre M., Li F., Schorr P., Yang J. C., Mays J. W. and Tirrell M. V., Macromolecules, 35 (2002) 9480.
- [5] Tran Y. and Auroy P., Eur. Phys. J. E., 5 (2001) 65.
- [6] Netz R. and Andelman D., Phys. Rep., 380 (2003) 1.
- [7] Pincus P., Macromolecules, 24 (1991) 2912.
- [8] Borisov O. V., Birshtein T. M. and Zhulina E. B., J. Phys. II, 1 (1991) 521.
- [9] Borisov O. V., Zhulina E. B. and Birshtein T. M., Macromolecules, 27 (1994) 4795.
- [10] Tinland B., Pluen A., Sturm J. and Weill G., Macromolecules, 30 (1997) 5763.
- [11] Manning G. S., J. Chem. Phys., 51 (1969) 924.
- [12] Misra S. and Varanasi S., J. Chem. Phys., 95 (1991) 2183.
- [13] Naji A., Netz R. and Seidel C., Euro. Phys. J. E, 12 (2003) 223.
- [14] Hariharan R., Biver C. and Russel W. B., Macromolecules, 31 (1998) 7514.
- [15] T. Odijk, J. Polym. Sci. 15, 477 (1977); J. Skolnick and M. Fixman, Macromolecules 10, 944 (1977); J.-L. Barrat and J.-F. Joanny, Europhys. Lett. 24, 333 (1993).
- [16] Netz R. R. and Orland H., Euro. Phys. J. B, 8 (1999) 81.
- [17] K. Nishida et al., Polymer 38, 6083 (1997).
- [18] Schiessel H. and Pincus P., Macromolecules, 31 (1998) 7953.
- [19] Ramanathan G. V., J. Chem. Phys., 78 (1983) 3223.
- [20] Deshkovski A., Obukhov S. and Rubinstein M., Phys. Rev. Lett., 86 (2001) 2341.
- [21] Dubois E. and Boue F., Macromolecules, 34 (2001) 3684.
- [22] Csajka F. S. and Seidel C., Macromolecules, 33 (2000) 2728.