The Behavior of Granular Materials under Cyclic Shear
Abstract
The design and development of a parallel plate shear cell for the study of large scale shear flows in granular materials is presented. The parallel plate geometry allows for shear studies without the effects of curvature found in the more common Couette experiments. A system of independently movable slats creates a well with side walls that deform in response to the motions of grains within the pack. This allows for true parallel plate shear with minimal interference from the containing geometry. The motions of the side walls also allow for a direct measurement of the velocity profile across the granular pack. Results are presented for applying this system to the study of transients in granular shear and for shear-induced crystallization. Initial shear profiles are found to vary from packing to packing, ranging from a linear profile across the entire system to an exponential decay with a width of approximately bead diameters. As the system is sheared, the velocity profile becomes much sharper, resembling an exponential decay with a width of roughly bead diameters. Further shearing produces velocity profiles which can no longer be fit to an exponential decay, but are better represented as a Gaussian decay or error function profile. Cyclic shear is found to produce large scale ordering of the granular pack, which has a profound impact on the shear profile. There exist periods of time in which there is slipping between layers as well as periods of time in which the layered particles lock together resulting in very little relative motion.
pacs:
45.70.-n, 45.70.Mg, 05.45.-a, 47.50.+dI Introduction
A static packing of granular materials can support a nonzero shear stress through a highly inhomogeneous network of forces degennes1999 . Upon increasing the shear stress, the granular material yields and starts to flow. Yet the inhomogeneous force network remains, leading to unusual flow properties jaeger1996 ; jaeger1996rmp . The characteristics of the initiation of this flow, and the properties of the flow, have implications for industry ennis1994 ; knowlton1994 . An understanding of these flows and the nature of the transition between static and flowing behavior holds promise for making connections to other non-equilibrium systems liu1998 .
In the regime of rapid dilute flows, in which there is a continuous input of energy into the system, granular dynamics are dominated by short-lived collisions between particles. In many ways, these flows are similar to those in a molecular gas and may be described by a granular kinetic theory jenkins1983 . In contrast, when a granular material is dense and slow moving, then individual grains are in contact with several other grains at once, and these contacts persist for extended periods of time. In this regime, the initiation of shear necessitates dilation of the pack. In order for individual grains to move past each other, they must lower the local packing density. In confined systems, as is often the case in two-dimensional studies, the global packing fraction of particles is fixed, but locally the packing fraction may vary extensively in response to shear veje1999 . In some geometries, the presence of a free surface allows the packing to adjust its density dynamically to the applied shear torok2000 ; bocquet2002 . This dilation of the granular pack has a profound impact on the shear flows.
Numerous systems have been created for studying the flow of various types of granular materials (see reference schwedes2003 for a review of granular flow testers). The details of the flowing state have been studied in a variety of situations such as free surface avalanches, hopper flows, and boundary driven flows midi2003 ; pouliquen2002 . These flows are often associated with large velocity gradients localized to a small region of space, with little shear elsewhere. Boundary driven shear flows have been extensively studied in Couette geometries in both two and three dimensions veje1999 ; howell1997 ; howell1999 ; utter2004 ; mueth2000 ; mueth2003 ; losert2000 ; losert2001 ; khosropour1997 . In these experiments, the shear band is localized near the inner cylinder wall, regardless of which cylinder is rotating, because the stress is larger at the inner cylinder as a result of the curvature of the system losert2001 .
Shear flows have been studied in other geometries such as the modified Couette cell of Van Hecke et al. fenistein2003 ; fenistein2004 , yet curvature effects continue to effect the nature of the shear band unger2004 . In annular shear cells, shear is induced between parallel plates on the top and bottom of the packing, but the presence of gravity and stationary side walls breaks the symmetry between the surfaces, and causes a shear band to form at the top surface savage1984 ; tsai2003 ; tsai2004 . Simulations of planar shear in the presence of a gravitational field have seen similar behavior, with the bottom portion of the pack at rest and a flowing region near the top surface thompson1991 ; zhang1992 .
A theoretically simpler system consists of shear induced between two parallel plates. Any resulting spatial inhomogeneities must arise from self-organization rather than from the asymmetries of the driving. Simulations of such shear have found both fluid-like and solid-like behavior aharonov2002 ; babic1990 , and in Lennard-Jones liquids are found to depend strongly on the boundary conditions thompson1990 . Many theories of granular shear assume homogeneous driving, yet nearly all experimental studies have been unable to achieve this ideal. An experimental system capable of large scale shear flows in a truly parallel plate geometry has been lacking.
In this paper, I describe a novel parallel plate shear cell. The system is designed to contain the granular pack within a rectangular well. Shear is applied by controlling the motion of the front and back walls. The side walls are deformable in order that they do not disturb the motion of the grains. With this parallel plate shear cell, I performed experiments on the initiation and evolution of shear bands as a function of the shearing history of the granular pack. I present results which demonstrate a dependence of the shear profile on the amount and manner in which the pack has been sheared in the past. For amorphous packs, which have not been previously sheared, the initial velocity profile is very wide with large variations from run to run. As the system is sheared further, the velocity profile evolves to a sharply sheared form. Upon reversal of the direction of shear, there is a sudden change in the velocity profile, attributed to the breaking and reforming of the contact-force network in agreement with recent work in two-dimensional Couette studies by Utter and Behringer utter2004 and in three-dimensional Couette flow experiments by Losert and Kwon losert2001 .
I also explored the effects of cyclic shear, finding a dramatic interplay between the spatial localization of shear flows and the structural organization of the grains. After only a few cycles of back and forth shearing of a packing of monodisperse glass spheres, a layered structure begins to form within the granular pack. The velocity profile across these layers shows jumps in the location of the largest velocity gradient. Periods of large slip between layers are interspersed with periods of very little slip, during which the shear is localized at one of the boundaries of the layered region.
II Background
Several experiments on granular shear flow have been performed in a Couette geometry. Typically, when measuring the time-averaged azimuthal velocity in steady-state flows, one finds that the velocity decays very rapidly with radial distance from the inner cylinder veje1999 ; bocquet2002 ; howell1997 ; howell1999 ; utter2004 ; mueth2000 ; mueth2003 ; losert2000 ; losert2001 ; khosropour1997 . Such velocities are often measured by applying particle tracking techniques to the motion of the individual grains at the boundaries of three-dimensional packs or in the bulk of two-dimensional samples. The velocity profile at the top surface of three-dimensional Couette systems was found to decay with distance from the inner cylinder with a form that was between exponential and Gaussian in shape bocquet2002 ; losert2000 . Bulk measurements in three dimensions were made by Mueth et al. using MRI techniques to track the average mass flow mueth2000 . They found little difference between flows within the pack at different heights, and the flows at the bottom surface as visualized through high-speed video. For samples of non-spherical, rough, or polydisperse grains, the azimuthal velocity was found to decay as a Gaussian, , with bead diameter, , and the center, , located near the inner cylinder wall. Packings of smooth monodisperse spheres formed layers, in which case the profile was dominated by slip between these layers leading to a nearly exponential profile, . In each case, the steady-state velocity profile, when normalized to the applied shear rate, (, where is the speed of the inner cylinder) was independent of the magnitude of the shear rate for slow flows.
At higher shear rates, Losert and Kwon found a roughly exponential profile with a width that increased weakly with shear rate losert2001 . In two-dimensional experiments, the global packing fraction is fixed, and is shown to have a large effect on the shear flows veje1999 . Above a critical packing fraction, the velocity profile is again found to be exponential, and approximately independent of the shear rate. It should be noted, however, that molecular dynamics simulations of boundary-driven planar shear have found a critical velocity for the development of nonlinear velocity profiles based on dilation effects xu2004 .
Fenistein et al. modified the Couette geometry to have a split bottom surface fenistein2003 ; fenistein2004 . In this way a shear band is created in the bulk of the pack, away from the side walls of the container. As the depth of the pack is increased, the width of the shear band grows and the position shifts toward the center of the system. The profile resembles a smooth transition between two regions of nearly constant velocity. An error function is found to describe this profile for all conditions, .
Many theoretical models have been proposed to describe these flows. Hydrodynamic models have been introduced with a density dependent viscosity to account for dilation and localization of shear losert2000 ; lubensky2003 ; santos2003 . Debregeas and Josserand have constructed a self-similar model based upon the intermittent motion of various sized clusters of particles debregeas2000 , and Åström et al. have considered local rotating bearings inside shear bands astrom2000 .
In a two dimensional Couette cell it is possible to measure the flow patterns and the contact forces between particles simultaneously. Howell et al. observed inhomogeneous force networks and their fluctuations during shear using photoelastic disks howell1997 ; howell1999 . Utter and Behringer then used this system to explore transients in the force network utter2004 . As the system is sheared, the force network aligns at degrees to resist the shear. When the system is stopped these forces relax somewhat, but upon restarting the shear in the same direction, there is an immediate return to steady-state behavior. However, when the system is stopped and restarted in the opposite direction, the velocity profile is initially much wider. This is associated with breaking of the previously aligned force network and reforming it in a perpendicular orientation to resist the new direction of shear. Similar transients in the velocity profile upon reversing the direction of shear were seen previously in the three-dimensional Couette studies of Losert and Kwon losert2001 .
In addition to these short-time transients, long-time changes in behavior have been seen in granular flows. Tsai and Gollub have shown that boundary induced shear of a packing of monodisperse spheres can lead to spatial ordering of the particles in an annular shear cell (in which a vertical shear is applied between the floor and ceiling) tsai2003 ; tsai2004 . When shearing continuously under identical conditions, some experimental runs found a crystallization transition, at which point the sample became highly ordered. Other runs led to a compacted but still disordered final state. By applying cyclic shear to the packing before beginning their continuously shearing run, they were able to select for the final crystallized state. It is still unclear how cyclic shear affects the ordering and whether it is more efficient at creating order than unidirectional shear. In other geometries, cyclic shear has been shown to compact and crystallize granular packings rapidly pouliquen2003 .
Shear has been seen to induce order in a wide variety of systems. Shear induced alignment has been seen in liquid crystals golan2001 and thin liquid films drummond2002 . Thompson et al. have seen shear-induced ordering in fluid film simulations and an associated transition from the normal Newtonian response thompson1995 . In experiments on colloidal suspensions, Cohen et al. have shown that shear, and the geometry in which it is applied, has a large impact on the spatial ordering of particles cohen2004 . Simulations by Stevens and Robbins have shown that shear can effect the solid-liquid phase boundaries of particles with screened Coulomb interactions, showing instances of shear-induced melting and shear-induced ordering stevens1993 .
Paulin et al. and Haw et al. have seen spatial ordering in dense colloidal suspensions in response to both unidirectional and cyclic shear paulin1997 ; haw1998_1 . They found that the particles order into hexagonal-close-packed layers. Under some instances a random stacking of these layers was produced with the closest-packed direction oriented along the direction of flow. Under shear these layers were able to slide past each other. Other instances resulted in close-packed layers which were stacked in an ABCABC… pattern of a three-dimensional face-centered-cubic crystal. In these cases the closest-packed direction is oriented along the direction of the velocity gradient (perpendicular to the direction of flow), in which case only a small amount of shear could be sustained within the crystal before disrupting the microstructure.
III Experimental Methods
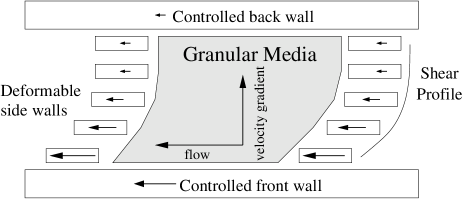
It is possible to contain granular materials within a rectangular-shaped box and apply shear by moving the front and back walls. Unfortunately, under any significant amount of shear, the presence of the side walls disturbs the motion of the grains and affects the shear profile. A better situation is found when the side walls are made to be deformable. In this way the front and back walls apply the shear to the granular pack, while the side walls contain the pack, but do not overly disturb its motion. Deformable side walls also provide a unique opportunity to measure the motions of the grains easily. Recording the motions of the side walls provides an average of the motions of the grains at that distance from the front and back walls. Figure 1 shows a schematic of the motion of the deformable side walls in response to a shear imposed by the front and back walls.
The cell is composed of many independently movable slats. As the grains move, these slats move past one another, adjusting the shape of the confining well. Figure 2 shows one such slat (made of inch thick polished steel), with the granular pack residing in the well. One side of each slat contains two v-grooves, inches deep, running parallel to the bottom surface. Ball bearings placed in these grooves separate neighboring slats by approximately mm, giving a repeat spacing between slats of mm, as shown in figure 3. Additional mm ball bearings reside underneath all of the slats, separating the system from the floor of the setup. This system of ball bearings provides low friction between neighboring slats and between each slat and the floor. Each slat is able to respond to the motion of the grains, without being overly influenced by the motions of the other slats.
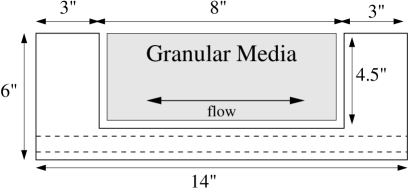
Flat front and back walls are used to apply shear to the granular pack. A single dilute layer of mm glass beads is epoxied to the central region of each of the front and back walls, in order to provide a rough surface from which to induce shear. The well is mm deep and mm long. When using mm beads this means the granular pack is approximately bead diameters deep and bead diameters long. Multiple slats are stacked together to control the width of the well. The data presented here was taken with slats, with a repeat spacing similar to a grain diameter, resulting in a pack that is approximately bead diameters wide.

In order to test the reliability of the parallel plate shear cell, multiple control experiments were conducted. When the system was filled with granular material and both front and back walls were driven in the same direction at the same speed, the entire granular pack and all intermediate slats moved together at this same speed. The friction with the bottom floor was not sufficiently large to impede the motion of the individual slats.
Without any granular material residing in the well, each individual slat was pushed by hand while the other slats were watched for motion. Neighboring slats were not dragged along with the motion of any given slat. This confirms that the friction between slats is small, and that each slat is independently movable and capable of responding to the motions of the granular pack. This test is repeated before and after each run. Data was taken with different sized particles, at different absolute speeds and with different speed ratios between the front and back walls, with either the front or back wall being faster. The system was started at various positions and the slats were started in various configurations with no qualitative difference in results.
The front and back walls can be driven at varying speeds (from approximately mm/s to mm/s) in either direction. If the walls are driven in opposite directions, there will necessarily be a region of the granular pack at rest with respect to the bottom floor. In practice, the static friction of the slats with the floor tends to inhibit the motion of the central slats, resulting in regions of large shear at both walls, and little shear in the center of the pack. For the data presented here, both walls were driven in the same direction so that the entire system moved at least as fast as the slower wall. In this way no slat is at rest with respect to the floor.
Initially the mm glass beads are poured into the well created by the slats and mixed by hand to disrupt any ordering. A single DC motor drives both walls through ACME lead screws. The system is videotaped with a digital video camera. Individual video frames are analyzed with IDL idl to locate the positions of the leading edges of each slat. These positions are tracked as a function of time and analyzed to give the distance that each slat has moved and it’s velocity as a function of time.
IV Results
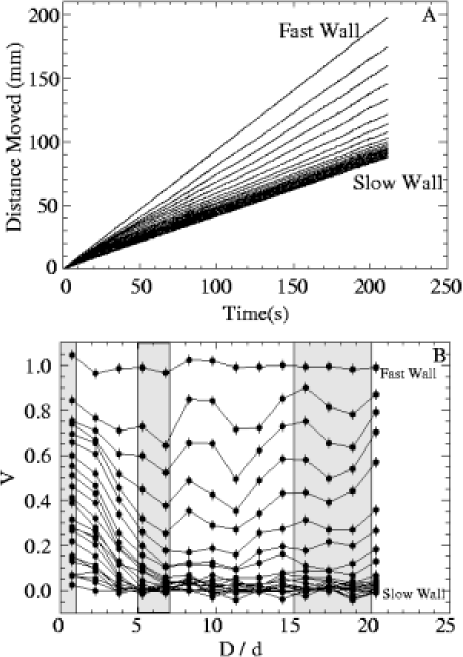
Beginning with an amorphous pack of monodisperse spheres, I track the positions of each of the slats, and thus the velocity profile of the granular pack. Figure 4a shows the distance that each slat has moved as a function of time for one experimental run. The steepest line represents the fast wall, and the shallowest line the slow wall. Intermediate slats move at speeds between that of the slow wall and the fast wall.
Applying a linear fit to each slat position versus time over some time window allows us to measure the velocities of each slat. A small time window allows good time resolution when looking for variations in the velocity, but also results in a large uncertainty in the fitted velocity. Throughout this analysis, the size of the time window is adjusted as appropriate to each situation. In order to compare flow profiles for different experimental conditions, each slat velocity is rescaled to make the slow wall have an average velocity of and the fast wall have an average velocity of . For each slat, the scaled velocity , as a function of time is given by
| (1) |
where and are the average velocities of the slow and fast walls respectively. Time is scaled by the relative velocity of the front and back walls, so as to represent the amount of relative displacement of the fast wall with respect to the slow wall. This distance, , is referred to as the distance sheared.
| (2) |
Figure 4b shows the scaled velocity, , of each slat versus distance sheared, . The absolute velocity is not found to have a qualitative effect on the flow profile. When shear is first initiated across an amorphous packing of glass beads, the velocity profile varies significantly from run to run. The first column of points in figure 4b shows a rather broad profile, which is a typical response. However, This initial velocity profile has been found to range from a linear profile across the entire width of the setup to an exponential profile with a width as small as bead diameters. Figure 5 shows two extreme examples of the scaled velocity, , versus distance from the faster wall, . When the system shows a nonlinear profile, then there always exists more shear near the faster moving wall (regardless of whether this is the front wall or the back wall).

Despite the initial variation in the velocity profile, the profile evolves to a sharper decay at the faster moving wall, as the system is sheared. Figure 4b shows that the velocities of all but the slats closest to the fast wall quickly decay to nearly as slow as the slow wall. Figure 6a shows the velocity profile of this run fitted over the time from to bead diameters of shear (the second shaded region in figure 4b). The profile is sharply sheared near the fast wall, exhibiting an exponential profile with a width of approximately . This trend is qualitatively reproduced for all experimental runs, although the amount of shear required for this evolution can vary from approximately to approximately bead diameters of shear across the system.

As the system continues to shear, the profile does not get any sharper than that shown in figure 6a. However, the velocity profile does begin to lose its exponential character. Figure 6b shows the velocity profile over the time from to bead diameters of shear (see the third shaded region of figure 4b). The solid line shows a fit to an exponential which systematically deviates from the data. The inset of figure 4b shows the residuals of the exponential fit. A better fit is obtained from a Gaussian function or an error-function which is indistinguishable from the tail of a Gaussian at this scale. It should be noted that earlier profiles, which are well fit by an exponential form, can also be fit to the extreme tails of Gaussian or error function forms. The resulting fit parameters put the centers of the Gaussian and error function profiles very far behind the fast wall () with very large widths, and are thus considered unreasonable. As the system continues to shear further, the fitted center of the Gaussian and error-function forms move closer to the faster wall. After to bead diameters of shear (the farthest unidirectional shear possible in this system), the fitted center of the Gaussian and error function are at bead diameters behind the fast wall and bead diameters in front of the fast wall with widths of and respectively. It is unclear how far these parameters would evolve if the system was able to continue to shear in one direction.
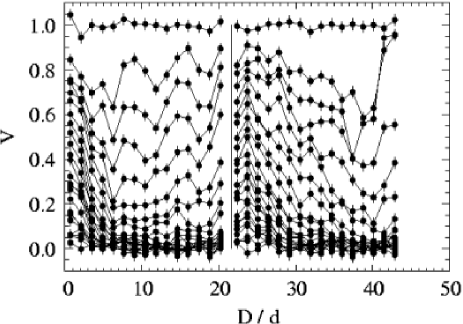
If the system is stopped and restarted in the same direction, there is little change to the velocity profile. Figure 7 shows as a function of for a run which was stopped after bead diameters of shear as denoted by the vertical line. When the system was restarted in the same direction the velocity of each slat remained essentially unchanged. By contrast, when the system is stopped and restarted in the opposite direction, as shown in figure 8, there is a large and sudden change in the velocity profile. Immediately after reversal, the velocity profile becomes much broader, resembling the initial profile of an unsheared system. The system again evolves toward a more sharply sheared profile.

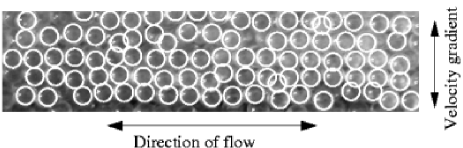
After repeated cycling of the direction of shearing, an ordered structure begins to emerge within the granular pack. Layers form parallel to the direction of flow, but there is little registration between neighboring layers. Figure 9 shows a picture of the top surface of the packing. By altering the amplitude of each shear cycle, the region in which the layers form can be changed. Typically they first appear at a distance from the faster wall where there is approximately one bead diameter of shear per cycle across one bead diameter of the packing (where the shear is approximately one). Small amplitudes lead to the initial formation of layers near the fast wall. Larger amplitudes form the layered structure farther from the faster wall.
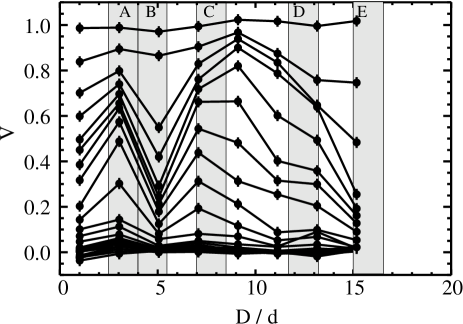
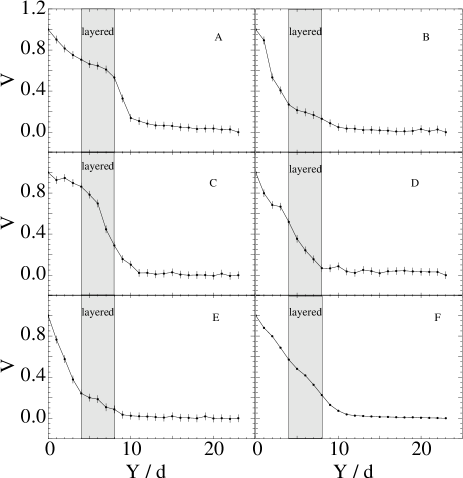
As this layered structure is forming, the velocity profile undergoes dramatic changes in terms of where the shear is localized. Figure 10 shows as a function of for a system after it has already undergone complete forward and reverse cycles of approximately bead diameters of shear in each direction. At different times the largest shear is located at different points within or at the edges of the layered region. After approximately bead diameters of shear (first shaded region), the shear is maximum near the edge of the layered region farthest from the fast wall, which is roughly bead diameters from the fast wall. The velocity profile at this point (shown in figure 11a), shows a small amount of shear between the fast wall and the layered region, very little shear within the layered region, and a lot of shear at the far edge of the layers. As the system shears farther, the area of maximum shear moves to the fast wall as shown in the profile in figure 11b. In parts c and d, the shear is maximum within the layered region, while at later times it moves back to the fast wall (part e.) Figure 11f shows the average velocity profile across the entire forward shearing of the th cycle and shows a fairly linear decay out to a distance of approximately bead diameters from the fast wall and very little shear beyond that. Such a time-averaged profile, as has often been done in other experiments for improved accuracy, is incapable of capturing the true migration of the shear band.
Continuing to shear the system cyclically causes the layered region to crystallize. Figure 12a shows a sample which after cycles became very well ordered from approximately bead diameters from the fast wall to approximately bead diameters from the fast wall, consisting of horizontal hexagonal-close-packed layers with the close-packed direction oriented parallel to the direction of flow. The area between the fast wall and the crystal was somewhat layered, but not completely crystalline, with a very sharp boundary marking the edge of the crystal. Deconstruction of the crystal, by vacuum removal of individual grains, revealed that the structure continued downward through the packing to the bottom surface. Furthermore, it was found that these close-packed layers were ordered in a ABCABC… pattern, forming a three dimensional face-centered-cubic crystal.
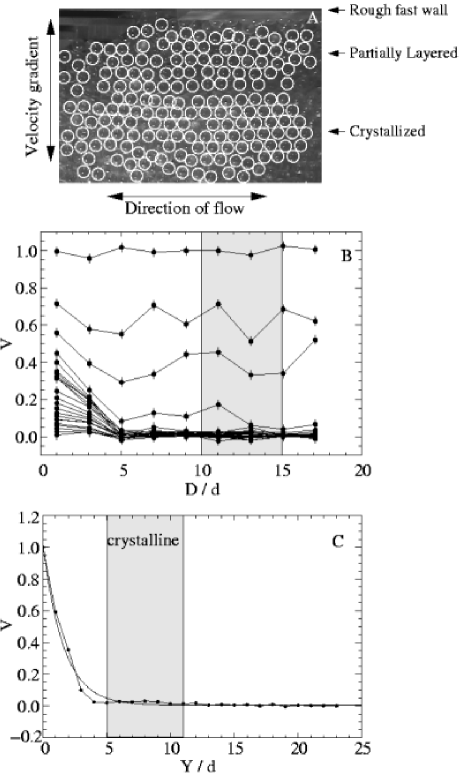
Figure 12b shows as a function of for this partially crystallized packing. The initial profile upon starting this th shear cycle (after switching direction from the end of the th cycle) shows a broad profile, consistent with the same response to switching direction that was seen in amorphous packings. At later times essentially all shear occurs within the partially layered region between the fast wall and the crystalline area. An exponential fit gives a width of , but even this form is not sharp enough to completely capture the data. Virtually no shear is found within the crystal, resulting in a flat profile beyond bead diameters.
V Discussion
The initial velocity profiles upon shearing an amorphous pack vary significantly from packing to packing. There is a tendency for the system to shear more strongly at the faster moving wall, which might be an indication of inertial effects, enhanced friction with the bottom surface for the faster moving slats, or larger vibrations at the faster moving wall. This breaks the symmetry between the fast and slow walls, and provides a preferential position for the formation of a shear band. However, the wide variation in initial profiles suggests that this symmetry may be only weakly broken and that it therefore requires a varying amount of time for the shear band to form at the fast wall. This implies that there is an initial period before which, a shear band has not formed, and that this period can last varying amounts of time depending upon the details of the packing.
The widely varying initial velocity profile evolves to a more sheared profile (as shown in figure 6a) with an exponential width of approximately bead diameters. After further shearing, the profile consistently deviates from exponential. This profile is not affected by suddenly stopping and restarting the shearing process. As has been indicated by Utter and Behringer utter2004 and by Losert and Kwon losert2001 , slow dense granular flows are quasistatic. All information regarding previous shear history is stored in the inter-particle contacts, which are not overly affected by stopping and restarting the flows utter2004 ; losert2001 . These contacts, however, are greatly affected by reversing the direction of the flow. Howell and Behringer visualized the force network in two dimensional flows and found that reversing the direction of flow causes the network to break and reform in a perpendicular orientation utter2004 . As the force network is reforming, particles far from the shear band move significantly more than in steady state, resulting in a much wider velocity profile. I observe this effect in amorphous packings in agreement with Utter and Behringer’s two dimensional experiments and Losert and Kwon’s three-dimensional Couette experiments. I also see a similarly wide velocity profile when switching directions in layered and crystalline packings. This suggests that the formation of an aligned force network is a function of the microscopic contacts between particles, and that the time scale for such formations is not strongly affected by macroscopic ordering of the particles. Furthermore, the force network can be broken and reformed without disrupting the large-scale crystal structure.
Like Tsai and Gollub tsai2004 , I found that shear can induce spatial ordering of granular particles. The time scale for such formation seems to be much faster under cyclic shear than under the unidirectional shear of their experiments, requiring only a few tens of cycles to create order over several particles. However, it is not clear that cyclic shear would be capable of crystallizing the entire pack, as particles near the slow wall experience very little shear within a given cycle. The ordering is most pronounced at the position in the packing where the shear per cycle is approximately one (where there is approximately one bead diameter of shear across a width of one bead diameter for each cycle). By changing the amplitude of the shear cycles I was able to form layered regions at different positions within the packing.
Over the range of shear amplitudes from bead diameter to bead diameters, all ordered regions formed layers and crystalline structures oriented with the close-packed direction parallel to the direction of flow. I never observed the formation of order with the close-packed direction parallel to the velocity gradient, as was seen in the colloidal studies of Paulin et al. and Haw et al. paulin1997 ; haw1998_1 . I did, however, observe cases of both a random stacking of planes in the layered packings and a vertical ABCABC… pattern forming a face-centered-cubic (FCC) structure in the crystalline packings.
As an ordered structure is beginning to form, the velocity profile undergoes repeated changes between periods of time during which there is large shear within the ordered region and periods of time where there is virtually no shear within that region. At later times, a highly-ordered FCC structure emerges, in which there is no shear. The entire crystalline region moves as a solid block throughout the rest of the experimental run. This might be related to the unique way in which FCC packings support stress. Experiments on static granular packings have shown that forces are supported along straight lines in face-centered-cubic packings whereas in other stackings of hexagonally packed layers, such as in a hexagonal-close-packed crystal, the forces branch or split between each close-packed plane mueggenburg2002 . Any out-of-plane force is supported by a network which branches at each horizontal layer of the packing that deviates from a local FCC stacking order spannuth2004 . These branches can create forces which would cause a slipping of horizontal planes at regions of the packing which deviate from the ABCABC… stacking order. In a face-centered-cubic crystal, out-of-plane forces are supported by straight lines of force across the entire packing without branching, and without in-plane forces to encourage slipping. Thus a connection can be made between the force network within a packing and the response of that packing to shear. As a shear-induced ordered structure is formed, local regions of non-FCC stacking order experience slip between the horizontal planes, and reorder, while regions of FCC stackings, are more stable to rearrangments. Over long times, the ordered region develops a large scale three-dimensional face-centered-cubic structure which moves together as a solid block. This may be a mechanism whereby long-range three-dimensional order in a granular pack can be created by shear. Further tests need to be preformed to confirm that FCC packings are more stable to shear than other stacking orders, and that this stability can be related to the force networks within the packings.
It should be noted that my results show velocity profiles similar in character to those found by Aharonov and Sparks in two-dimensional simulations aharonov2002 . However, Aharonov and Sparks found switching between randomly positioned internal shear bands and diffuse deformations in the regime of large applied pressures, and found the more standard narrow shear band at a boundary under smaller confining pressures. I find these two different regimes of shear flow based upon the structural order of the packing. It is unclear if a connection could be made comparing the microstructural reorganization from applied pressures and from shear-induced ordering.
VI Conclusion
In this paper I have presented the design and implementation of a novel parallel plate shear cell for the purpose of studying cyclic granular shear. The parallel plate geometry avoids the curvature effects found in the more common cylindrical Couette experiments. The system of adjustable side walls allows for reasonable distances of shear in one direction, and is especially well suited for cyclic shear studies.
Experiments in this setup were done on the shear flows of packings of monodisperse glass spheres, studying transient behaviors, and shear-induced crystallization. There is a complex interaction between the spatial structure and the shear flow properties of a granular pack. The initial incomplete formation of layers can allow for more shear than in an amorphous pack through slipping between layers. Yet the layers can also lock together, especially as they become more well ordered, preventing slip and resulting in less shear in that region. This nontrivial dependence of shear flows on the amount and type of structure within the granular pack signifies the complex dynamics inherent in such non-equilibrium systems.
Acknowledgements.
My utmost gratitude is given to Heinrich Jaeger and Sidney Nagel for their invaluable guidance and support. I also thank B. Chakraborty, X. Cheng, E. Corwin, M. Möbius, and T. Witten for fruitful discussions. This work was supported by the NFS under CTS-0090490 and MRSEC DMR-0213745, and by DOE under W-7405-ENG-82.References
- (1) P. G. de Gennes, Reviews of Modern Physics 1, 2 (1999).
- (2) H. M. Jaeger, S. R. Nagel, and R. P. Behringer, Physics Today 49, 32 (1996).
- (3) H. M. Jaeger, S. R. Nagel, and R. P. Behringer, Reviews of Modern Physics 68, 4 (1996).
- (4) B. J. Ennis, J. Green and R. Davis, Chemical Engineering Progress 90, 32 (1994).
- (5) T. M. Knowlton, J. W. Carson, G. E. Klinzing, and W. -C. Yang, Chemical Engineering Progress 90, 44 (1994).
- (6) A. J. Liu and S. R. Nagel, Nature 396, 21 (1998).
- (7) J. T. Jenkins and S. B. Savage, J. Fluid Mech. 130, 187 (1983).
- (8) C. T. Veje, D. W. Howell, and R. P. Behringer, Phys. Rev. E 59, 739 (1999).
- (9) J. Török, S. Krishnamurthy, J. Kertész and S. Roux, Phys. Rev. Lett. 84, 3851 (2000).
- (10) L. Bocquet et al., Phys. Rev. E 65, 011307 (2002).
- (11) J. Schwedes, Granular Matter 5, 1 (2003).
- (12) G. D. R. Midi, preprint cond-mat/0312502
- (13) O. Pouliquen and F. Chevoir, C. R. Physique 3, 163 (2002).
- (14) D. Howell and R. P. Behringer, in Powders & Grains 97, edited by R. Behringer and J. Jenkins (Balkema, Rotterdam, 1997), pp. 337-340.
- (15) D. Howell, R. P. Behringer, and C. Veje, Phys. Rev. Lett. 82, 5241 (1999).
- (16) B. Utter and R. P. Behringer, preprint, cond-mat/0402669 (2004). accepted to Eur. Phys. J. E
- (17) D. M. Mueth, G. F. Debregeas, G. S. Karczmar, P. J. Eng, S. R. Nagel, and H. M. Jaeger, Nature 406, 385 (2000).
- (18) D. M. Mueth, Phys. Rev. E 67, 011304, (2003).
- (19) W. Losert, L. Bocquet, T. C. Lubensky, and J. P. Gollub, Phys. Rev. Lett. 85, 1428 (2000).
- (20) W. Losert and G. Kwon, Advances in Complex Systems 4, 4 (2001).
- (21) R. Khosropour, J. Zirinsky, H. K. Pak, and R. P. Behringer, Phys. Rev. E 56, 4467 (1997).
- (22) D. Fenistein and M. van Hecke, Nature 425, 256 (2003).
- (23) D. Fenistein, J. W. van de Meent, and M. van Hecke, Phys. Rev. Lett. 92 094301 (2004).
- (24) T. Unger, J. Török, J. Kertész, and D. E. Wolf, Phys. Rev. Lett. 92 214301 (2004).
- (25) S. B. Savage and M. Sayed, J. Fluid Mech. 142, 391 (1984).
- (26) J. -C. Tsai, G. A. Voth, and J. P. Gollub, Phys. Rev. Lett. 91, 064301 (2003).
- (27) J. -C. Tsai and J. P. Gollub, (2004) preprint, http://www.haverford.edu/physics-astro/Gollub/jctsai/ AnnularShear/index.htm
- (28) P. A. Thompson and G. S. Grest, Phys. Rev. Lett 67, 1751 (1991).
- (29) Y. Zhang and C. Campbell, J. Fluid Mech. 237, 541 (1992).
- (30) E. Aharonov and D. Sparks, Phys. Rev. E 65, 051302 (2002).
- (31) M. Babić, H. H. Shen, and H. T. Shen, J. Fluid Mech. 219, 81 (1990).
- (32) P. A. Thompson, M. O. Robbins, Phys. Rev. A 41, 6830 (1990).
- (33) N. Xu, C. O’Hern and L. Kondic, preprint, cond-mat/0403046
- (34) T. C. Lubensky, J. Phys. Condens. Matter 15, S47 (2003).
- (35) A. Santos, V. Garzó, and J. Dufty, Phys. Rev. E 69, 061303 (2004).
- (36) G. Debregeas and C. Josserand, Euorphys. Lett. 52, 137 (2000)
- (37) Åström, H. J. Herrmann, and J. Timonen, Phys. Rev. Lett. 84, 4 (2000).
- (38) O. Pouliquen, M. Belzons, and M. Nicolas, Phys. Rev. Lett. 91, 014301 (2003).
- (39) Y. Golan, A. Martin-Herranz, Y. Li, C. R. Safinya, and J. Israelachvilli, Phys. Rev. Lett. 86, 1263 (2001).
- (40) C. Drummond, N. Alcantar, and J. Israelachvilli, Phys. Rev. E 66, 011705 (2002).
- (41) P. A. Thompson, M. O. Robbins, and G. S. Grest, Israel J. Chem. 35, 93 (1995).
- (42) I. Cohen, D. a. Weitz, and T. G. Mason, preprint, from http://www.deas.harvard.edu/projects/weitzlab/ publications.html (2004).
- (43) M. J. Stevens and M. O. Robbins, Phys. Rev. E. 48, 3778 (1993).
- (44) S. E. Paulin, B. J. Ackerson, and M. S. Wolfe, Phys. Rev. E 55, 5812 (1997).
- (45) M. D. Haw, W. C. K. Poon, and P. N. Pusey, Phys. Rev. E 57, 6859 (1998).
- (46) IDL, Research Systems Incorporated, www.rsinc.com
- (47) N. W. Mueggenburg, H. M. Jaeger, and S. R. Nagel, Phys. Rev. E. 66, 031304 (2002).
- (48) M. J. Spannuth, N. W. Mueggenburg, H. M. Jaeger, and S. R. Nagel, accepted to Granular Matter, preprint cond-mat/0308580 (2003).