Coexistence of antiferromagnetic order and unconventional superconductivity in heavy fermion compounds CeRh1-xIrxIn5: nuclear quadrupole resonance studies
Abstract
We present a systematic 115In NQR study on the heavy fermion compounds CeRh1-xIrxIn5 (=0.25, 0.35, 0.45, 0.5, 0.55 and 0.75). The results provide strong evidence for the microscopic coexistence of antiferromagnetic (AF) order and superconductivity (SC) in the range of 0.35 0.55. Specifically, for =0.5, is observed at 3 K with a subsequent onset of superconductivity at =0.9 K. reaches a maximum (0.94 K) at =0.45 where is found to be the highest (4.0 K). Detailed analysis of the measured spectra indicate that the same electrons participate in both SC and AF order. The nuclear spin-lattice relaxation rate shows a broad peak at and follows a variation below , the latter property indicating unconventional SC as in CeIrIn5 (=0.4 K). We further find that, in the coexistence region, the dependence of is replaced by a -linear variation below 0.4 K, with the value increasing with decreasing , likely due to low-lying magnetic excitations associated with the coexisting magnetism.
pacs:
PACS: 74.25.Dw, 74.25.Ha, 74.70Tx, 76.60.GvI Introduction
Superconductivity and long-range magnetic order are two outstanding quantum phenomena; however these ground states are not generally displayed by the same electrons simultaneously. This is because an internal magnetic field arising from magnetic order usually destroys superconductivity. In the 1970s, a number of materials were found to host both superconductivity and magnetic order, but the two orders were due to different electrons and occurred in spatially-separated regions Maple&Fisher . This is also true in the recently reported ruthenate-cuprate hybrid compound RuSr2RCu2O8 (R=rare earth) where the RuO and CuO2 planes are responsible for the magnetic order and superconductivity, respectively Barnhart . An exceptional case is the heavy fermion compound UPd2Al3 in which magnetic order and superconductivity coexist homogeneously Geibel ; Tou . In this system, however, it is believed that the multiple bands of uranium (U) electrons make such coexistence possible. Namely, among three U-5f electrons, the two with localized character are responsible for the magnetism and the remaining one is responsible for superconductivity Sato ; Miyake . Such ”duality” may also be at work in other U-based heavy fermion magneto-superconductors Geibel2 ; UGe2 ; URhGe . It is therefore an outstanding question whether magnetic order and superconductivity due to the same electrons can coexist on a microscopic length scale. Although it has been proposed theoretically that magnetism and superconductivity may be viewed as two sub-components of a unified group and that they may coexist under certain conditions Zhang , accumulation of convincing experimental evidence is important. The Ce-based heavy fermion compounds and high superconducting transition-temperature () copper oxides are hosts of single-band magnetism or/and superconductivity, and are therefore good candidate materials for exploring this problem.
Recently, it has been suggested that in the layered heavy fermion compounds Ce(Rh1-xIrx)In5 Pagliuso and Ce(Rh1-xCox)In5 Maple and also CeRhIn5 under pressure Mito ; Kawasaki , antiferromagnetism and superconductivity coexist. CeRh(Ir)In5 crystallizes in a tetragonal structure which consists of CeIn3 layers separated by a Rh(Ir)In2 block. CeRhIn5 is an antiferromagnet with =3.7 K, but becomes superconducting under pressures above 1.6 GPa Hegger . CeIrIn5 is a superconductor at ambient pressure with =0.4 K Petrovic and line nodes in the superconducting energy gap Zheng . It is remarkable that the magnetic fluctuations exhibit quasi two-dimensional character as revealed by NQR Zheng and neutron scattering Bao1 measurements, probably reflecting the layered crystal structure. Upon substituting Rh with Ir, superconductivity was found in Ce(Rh1-xIrx)In5 for 0.3, while magnetic order continued to be observed around 3.8 K in the specific heat for x0.5 (Ref. Pagliuso ) and an internal magnetic field was detected by muon spin rotation measurement Morris .
In this paper, we present results obtained from nuclear quadrupole resonance (NQR) measurements on Ce(Rh1-xIrx)In5 that strongly suggest that antiferromagnetic (AF) order coexists microscopically with unconventional superconductivity (SC). We find that upon replacing Rh with Ir in the antiferromagnet CeRhIn5, the Neel temperature increases slightly with increasing Ir content up to =0.45 then decreases rapidly. Superconductivity sets in above 0.35 and reaches a maximum of 0.94 K at =0.45. The nuclear spin-lattice relaxation rate shows a broad peak at and follows a variation below , the latter feature indicating that the SC is unconventional as in CeIrIn5. In the coexistence region, becomes proportional to at very low temperatures in the superconducting state and the value increases in the order of x=0.55, 0.5 and 0.45, which suggests the existence of low-lying magnetic excitations in addition to the residual density of states (DOS) due to the presence of disorder.
The rest of the paper is organized as follows. The experimental details are described in Section II. In Section III, the NQR spectroscopy that indicates the homogeneous alloying of the samples is presented. The results of the nuclear spin lattice relaxation that evidence the coexistence of antiferromagnetism and superconductivity are also presented in Section III, along with evidence for the unconventional nature of the superconductivity. We conclude in Section IV, following a brief discussion of the phase diagram deduced from our NQR measurements.
II Experimetal
Single crystals of Ce(Rh1-xIrx)In5 used in this study were grown by the In-flux method Hegger . For NQR measurements, the single crystals were crushed into a powder of moderate particle size to allow maximal penetration of the oscillating magnetic field, , used in the NQR measurements. The measurements below 1.4 K were performed by using a 3He/4He dilution refrigerator. NQR experiments were performed using a home-built phase-coherent spectrometer. A standard /2--echo pulse sequence was used. A small was used to avoid possible heating by the RF pulse below 1 K; the /2 pulse length is about 20 micro-seconds. A CuBe piston-cylinder device ZhengSSC , filled with Si-based organic liquid as a pressure-transmitting medium, was used to generate high pressure. The NQR coil was put inside a Teflon cell. To calibrate the pressure at low temperatures, the reduction in of Sn metal under pressure was monitored by resistivity measurements smith . of the samples was determined from the ac susceptibility measured by using the NQR coil at a frequency of 32 MHz, and from the data (see below). was measured by the saturation-recovery method. The value of was unambiguously extracted from a good fitting of the nuclear magnetization to the expected theoretical curve Maclaughlin ; Roos (discussed in detail below).
III Results and discussion
III.1 Evidence for homogeneous alloying from NQR spectra
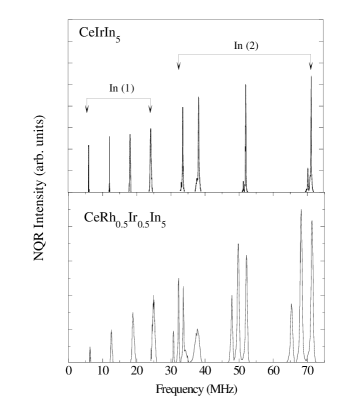
There are two inequivalent crystallographic sites of In in Ce(Rh1-xIrx)In5: the In(1) site in the CeIn3 plane and the In(2) site in the Rh(Ir)In2 block. The NQR spectra for the In(1) site consist of four equally-spaced transition lines separated by , while the In(2) spectra are composed of four un-equally separated lines between 30 and 72 MHz. The spectra of CeIrIn5 (Ref. Zheng ) is reproduced in Fig. 1(a). Here is defined as the parameter in the following Hamiltonian,
| (1) |
where
| (2) |
and
| (3) |
A representative spectra for CeRh0.5Ir0.5In5 is shown in Figure 1(b) . Two effects due to alloying are readily seen in this spectra. First, the transition lines for In(1) are broadened. Second, each transition for In(2) is split into three lines. Although naively this behavior might suggest phase segregation, we argue below by inspecting the Ir-concentration dependence of the spectra, that there is no phase separation in the alloyed sample; rather the sample is globally homogeneous.
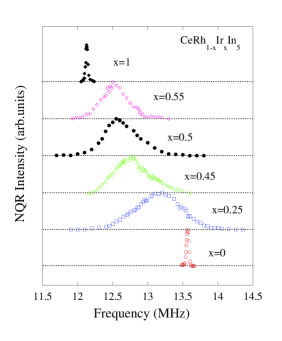
Figure 2 shows the NQR line shape at T=4.2 K of the 2 transition at the In(1) site for various Ir contents. The decreases monotonically from 6.78 MHz (=0) Curro to 6.065 MHz (=1) Zheng , suggesting a smooth evolution of the lattice upon alloying, in agreement with x-ray diffraction measurements Pagliuso . It should be emphasized that no trace of pure CeRhIn5 or CeIrIn5 is found in the alloyed samples because no peaks corresponding to =0 or =1 were observed.
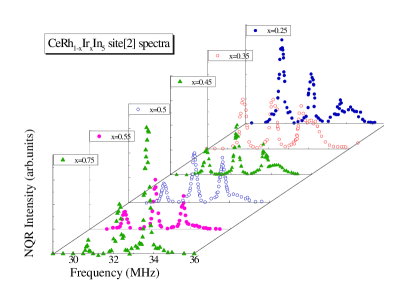
Figure 3 shows the spectra corresponding to the lowest transition () line of the In(2) site for various Ir concentration ranging from =0.25 to 0.75. It is interesting that the positions of the three peaks do not change with Ir concentration (Fig. 4(a)), but the relative intensity distribution among these lines does (Fig. 4(b)). Also, the left peak is at the same position of the transition for CeRhIn5, while the right peak is at the same position as the corresponding transition for pure CeIrIn5. The central peak is characterized by =17.37 MHz and =0.473.
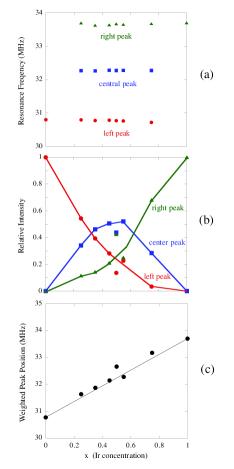
Figure 4(c) depicts a quantity that is the relative intensity shown in Fig. 4(b) multiplied by the corresponding peak position shown in Fig. 4(a). Most simply, this corresponds to the ”weighted peak position” or ”averaged resonance frequency” for the transition. Note that this quantity increases smoothly with increasing Ir concentration.
The results shown in Fig. 4 can be interpreted as follows. In(2) has two nearest neighbor (Rh, Ir) sites. There are Ir atoms and Rh atoms for a given alloy concentration x. If the NQR frequency is sensitive to the local environment, there will be three resonance lines depending on the nearest neighbor configuration of a given In(2), namely, (Rh, Rh), (Rh, Ir) or (Ir,Ir). The intensity of each peak will be proportional to the probability that In(2) has a corresponding nearest neighbor pair, namely, (Rh, Rh), (Rh, Ir) or (Ir,Ir). Figure 4 strongly suggests that this is the case, with the central transition corresponding to the case with (Rh,Ir) nearest neighbors.
In such a scenario, one might then wonder why In(1) only sees an averaged environment. This is probably because the wave function mixing between In(1) and the atom is weaker than in the case of In(2), because In(1) is farther away from . In addition, In(1) has eight nearest neighbor atoms. The effect of having different nearest-neighbor pair is thus further averaged out. As a result, each In(1) transition is observed as a broadened line. This is in contrast to the case of In(2) whose -orbital directly mixes with those of . Since is dominated by the on-site electronic configuration Harima , the stronger coupling between In(2) and atoms gives rise to three distinct resonance lines in the alloyed samples rather than a broad ’single’ transition as in the case of In(1).
Although the In(2) transition is sensitive to the local atomic configuration, it should be emphasized that globally the electronic states are quite homogeneous, as evidenced by the results of spin-lattice relaxation measurements described in the next subsection.
III.2 Nuclear spin lattice relaxation and the magnetic ordering
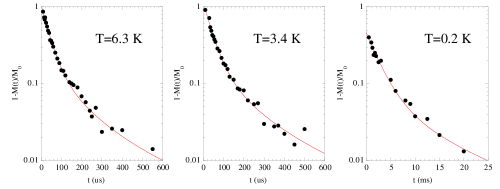
The measurements were performed at the peak of the 2 transition ( for the In(1) site and at the central peak of the three lowest frequency transition () lines for the In(2) site. Figure 5 shows the decay curve of the nuclear magnetization for =0.45 at three typical temperatures above and below and . At T=0.2K we used a small tipping-angle pulse so that the magnetization is less saturated at small delay time. The decay curve can be fitted by a single component of to the theoretical curve Maclaughlin ,
| (4) |
The same quality of data were obtained for all alloys and also for the In(2) site, whose nuclear magnetization is fitted to the theoretical curve Roos with a single component of .
| (5) | |||||
The successful fitting of the nuclear magnetization to the theoretical curve with a single component is a good indicator of the homogeneous nature of the electronic state. Figure 6 shows the temperature dependence of measured at the three peaks of In(2) for =0.35. It can be seen that all sites show a quite similar dependence. Namely, there is a peak around =4 K, although the peak height is reduced as compared to =0 Mito3 . The absolute value is also very similar. In the figure, the origin for the left and right peaks were shifted for clarity. These results indicate that the three peaks probe the same electronic state despite the fact that they arise from different nearest-neighbor configurations.
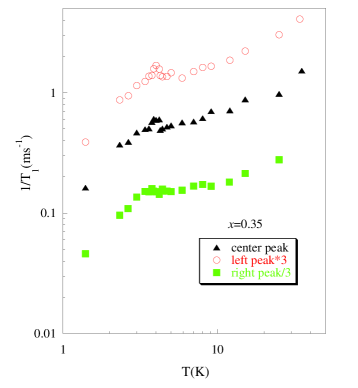
Figure 7 shows the evolution of the dependence of at the central In(2) transition for various Ir concentrations. It is evident that the peak temperature and the peak height change with the Ir concentration. We associate this peak with the Neel ordering temperature, , at which increases due to critical slowing down. determined in this manner correspond well with that inferred from the specific heat Pagliuso and sr measurements Morris . Interestingly, first increases gradually with increasing Ir content up to =0.45 then decreases rapidly. For =0.5, is reduced to 3 K. For =0.55, no feature is seen in the -dependence of (for clarity of Fig. 7, data are not shown ), thus it becomes difficult to identify .
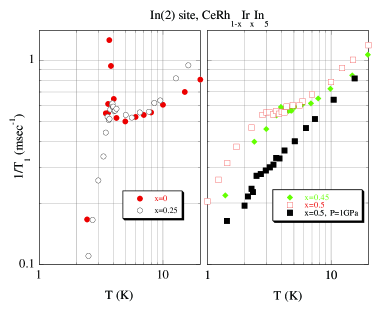
inferred from the peak in is sensitive to externally-applied hydrostatic pressure, as in pure CeRhIn5. In the right panel of Fig. 7 is shown the result under a pressure of 1.02 GPa for the =0.5 sample. The broad peak seen at ambient pressure is suppressed, and instead a distinct decrease of is found at 2.5 K, which resembles the case of pure CeRhIn5 in which the application of pressure reduces the height of the peak at Mito3 ; Kawasaki2 ; Mito2 ; Kohori and eventually suppresses the peak under =1.7 GPa Mito2 . Thus, as in pure CeRhIn5, can serve as a probe to determine .
Figure 8 shows typical data sets of measured at the In(1) site. The anomaly at is also visible at the In(1) site, although it is less clear presumably because the peak at at this site is already rather weak, even in the undoped compound.
The non-monotonic change of as a function of may be attributed to the increase of exchange coupling between 4f spins which is overcome by the increase of coupling between 4f spins and conduction electrons above , as inferred from Doniach’s treatment of the Kondo necklace Doniach . This result also resembles the behavior of CeRhIn5 Mito ; Kawasaki as a function of pressure and indicates that the substitution of Ir for Rh acts as chemical pressure in CeRhIn5.
Due to the broadening of the spectra upon alloying, it is difficult to estimate precisely the internal magnetic field in the ordered state. The Hamiltonion in the presence of magnetic field is given by
| (6) |
where is given by eq. (1) and
| (7) |
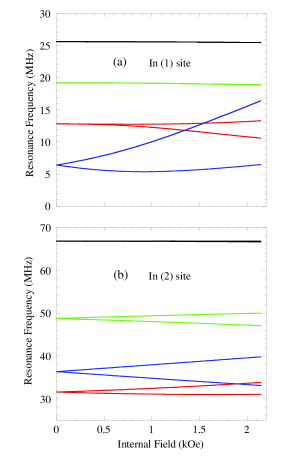
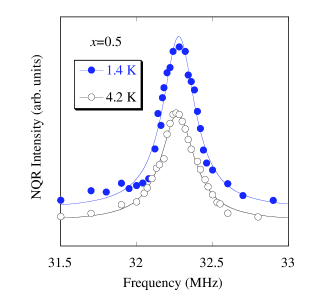
In the present case, is along the crystal c-axis. Assuming an internal magnetic field in the ab-plane, which is the case for CeRhIn5, the evolution of the resonance frequency for each transition is calculated for the In(1) site (Fig. 9(a)) and for the In(2) site (Fig. 9(b)). Here, the field is assumed to be along x-direction. Note that even the transition for the In(2) site, which has a FWHM of 0.26 MHz and is the sharpest among all transitions in the alloyed samples, does not show an appreciable change between =4.2 K (above ) and =1.4 K (below ), see Fig. 10. This suggests that the internal magnetic field at the In(2) site is less than 200 Oe for =0.5, as inferred from the expected splitting deduced from Fig. 9. Such a small internal field, which is samller by a factor of 10 than that in CeRhIn5 Curro , could be due to a moderate reduction of the ordered moment Christianson with a concomitant reduction of the hyperfine coupling Curro2 .
III.3 Superconducting state
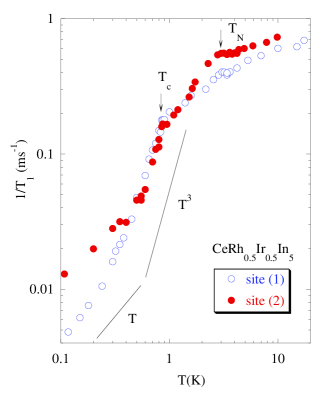
Next, we discuss the low temperature behavior of Ce(Rh1-xIrx)In5 well below . Figure 11 shows for both the In(1) and In(2) sites at low temperatures for the =0.5 sample. Below =0.9 K, decreases sharply with no coherence peak, following a variation down to =0.45 K. The observation of the behavior is strong evidence for the existence of line nodes in the superconducting gap function Zheng . For an s-wave gap, would show a coherence peak just below followed by an exponential decrease upon further decreasing . Because is measured at the same transition for the entire measured temperature range, our results suggest that antiferromagnetic order and superconductivity are due to the same electronic state derived from the Ce-4f1 electron. If the two ordered states occurred in spatially-separated regions, the nuclear-magnetization decay curve would have been composed of two components (two ’s) below , contradicting the single-component decay curve we observe. It is noteworthy that just above , tends to be proportional to , which suggests that there remains a finite density of states (DOS) at the Fermi level () in the magnetically ordered state, since is dominantly proportional to the square of the low-energy DOS at such low- (see below, eq. (9)). This suggests that the gap opening due to the antiferromagnetic order is incomplete, in contrast to the behavior observed in pure CeRhIn5 where the gap is more fully developed, leading to a stronger decrease of (see Fig. 8). This remnant of some part of the Fermi surface may be important for superconductivity to set in even in the magnetically ordered state.
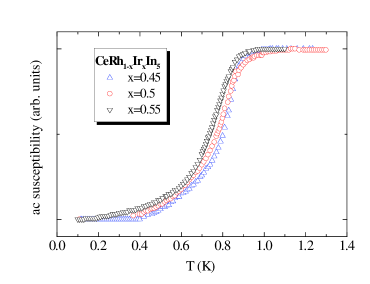
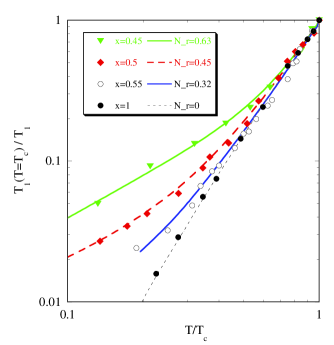
Finally, let us compare the superconducting behavior for =0.45, 0.5 and 0.55. Figure 12 shows the ac-susceptibility (ac-) measured using our NQR coil. Although it is hard to determine the onset temperature of the superconductivity from ac-, it can be seen that the mid-point of the transition increases in the order of =0.55, 0.5 and 0.45. determined from the point at which displays a distinct drop is 0.8 K, 0.9 K and 0.94 K for =0.55, 0.5 and 0.45, respectively. Figure 13 shows normalized by its value at plotted against the reduced temperature for =0.55, 0.5 and 0.45. Just below , shows identical behavior for all samples, but at lower temperatures strong variation is observed. In particular, below 0.4 K, becomes again proportional to , and the normalized value of increases in the order =0.55, 0.5 and 0.45.
The most straightforward explanation for -linear at low- would be the presence of disorder that produces a finite DOS remaining at . By assuming a gap function with line nodes,
| (8) |
and with a finite residual DOS, (Ref.Miyake2 ), we tried to fit the data in the superconducting state to
| (9) |
where with being the DOS in the normal state and being the Fermi function. The resulting fitting parameters are =0.32, 0.45 and 0.63 for =0.55, 0.5 and 0.45, respectively, with =2.5 for all samples. In such a case, however, one would expect to be the same for =0.55 and 0.45, because the amount of disorder is expected to be similar. The much larger inferred for =0.45 than =0.55 suggests an additional mechanism. We propose that this additional comes from low-lying magnetic excitations associated with the coexisting magnetic ordering that is more well developed at lower values of . Similar was seen in CeRhIn5 under a pressure of 1.6 GPa where magnetism also coexists with superconductivity. In this case the observed behavior was interpreted as due to a gapless -wave superconducting state Fuseya , or due to additional nodes in the d-wave order parameter Bang .
On the other hand, the larger for the In(2) site than for In(1) site may be due to a larger disorder contribution for this site. This is because the source of disorder in the present case is in the Rh(Ir)In2 block. The In(2) site is naturally more sensitive to such disorder than the In(1) site which is farther removed from this block. A similar case was seen in high- copper oxide superconductors. In Tl2Ba2Ca2Cu3O10 (=117 K) Zheng1 , disorder due to inter-substitution of Ca/Tl occurs in the Ca layer. As a consequence, the Cu(1) site sandwiched by two Ca layers sees a larger than the Cu(2) site which is adjacent to only one of the Ca layers.
III.4 phase diagram
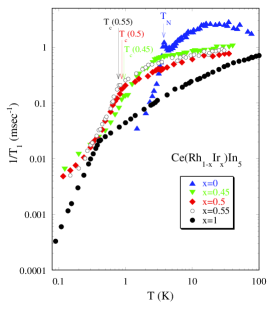
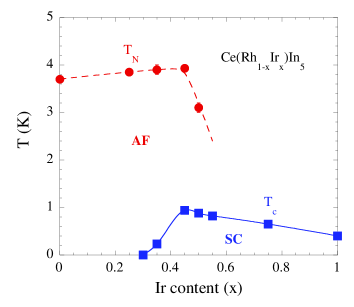
The phase diagram shown in Fig. 14 summarizes our results. Upon doping with Ir, the system undergoes a quantum phase transition from an antiferromagnet (=0) to a superconductor (=1), with an intervening region where antiferromagnetic and superconducting orders coexist. Our results show that this behavior, reported previously based on thermodynamic data Pagliuso , is confirmed microscopically. reaches a maximum at =0.45 (=0.94 K), while is found to be the highest (=4.0 K). The enhancement of in the antiferromagnetically ordered state is most interesting, suggesting the importance of magnetism in producing the superconductivity. Recently, antiferromagnetism and superconductivity was found to coexist also in CeRhIn5 under external pressures Mito ; Kawasaki , but the coexistent region is rather narrow there. More importantly, in the present case superconductivity develops well inside the ordered state and increases when approaching the maximum of , whereas reaches a maximum after disappears in hydrostatically-pressurized CeRhIn5. The observed phase diagram may be understood in the framework of SO(5) theory in which the 5-component super-spin can be rotated by a chemical potential from the subspace of antiferromagnetic order to the subspace of d-wave superconductivity and vice versa Zhang . However, a microscopic description of how the same 4f1 electron can display both magnetic order and superconductivity is still lacking.
IV Conclusion
In conclusion, we have carried out an extensive 115In NQR study on CeRh1-xIrxIn5. We find that the substitution of Ir for Rh in the antiferromagnet CeRhIn5 acts as chemical pressure. With increasing Ir content (), increases slightly up to =0.45, then decreases rapidly. The coexistence of superconductivity with antiferromagnetism for 0.35 0.5 is observed in the temperature dependence of which displays a broad peak at and drops as below . At =0.5, is reduced to 3 K while reaches 0.9 K. Our results suggest that the coexisting antiferromagnetic order and superconductivity are due to the same electronic state derived from the Ce-4f1 electron. It is most interesting that the superconducting transition temperature is increased as the system penetrates deeper inside the antiferromagnetically ordered state. for =0.45 and 0.5 is more than double that of CeIrIn5. In the coexistence region, shows a -linear dependence at low- below 0.4 K. We have argued that this may arise from some magnetic excitations associated with the coexisting magnetism, in addition to the presence of crystal disorder that produces a residual density of states at the fermi level.
V Acknowledgement
We thank H. Harima for a helpful discussion on the issue, and G. G. Lonzarich, N. Nagaosa and S.-C. Zhang for helpful comments. We also would like to thank W. Bao and N.J. Curro for useful discussion, and S. Kawasaki, K. Tanabe and S. Yamaoka for assistance in some of the measurements. Partial support by Japan MEXT grant No. 14540338, 16340104 (G.-q.Z) and No. 10CE2004 (Y.K) is thanked. Work at Los Alamos was performed under the auspices of the US DOE.
* present address: Department of Physics, Okayama University, Okayama 700-8530, Japan. E-mail address: zheng@psun.phys.okayama-u.ac.jp
References
- (1) M. B. Maple and O. Fisher (Eds), Superconductivity and Magnetism, (Springer-Verlag, Berlin, 1982).
- (2) C. Bernhard et al., Phys. Rev. B 61, R14960 (2000).
- (3) C. Geibel et al., Z. Phys. B 84, 1 (1991).
- (4) H. Tou et al, J. Phys. Soc. Jpn. 64, 725 (1995).
- (5) N. K. Sato, N. Aso, K. Miyake, R. Shiina, P. Thalmeier, G. Varelogiannis, C. Geibel, F. Steglich, P. Fulde and T. Komatsubara, Nature 410, 340 (2001).
- (6) S. Yotsuhashi, H. Kusunose and K. Miyake, J. Phys. Soc. Jpn. 70, 186 (2001).
- (7) C. Geibel et al., Z. Phys. B 83, 305 (1991).
- (8) S. S. Saxena, P. Agarwal, K. Ahilan, F. M. Grosche, R. K. W. Haselwimmer, M. J. Steiner, E. Pugh, I. R. Walker, S. R. Julian, P. Monthoux, G. G. Lonzarich, A. Huxley, I. Sheikin, D. Braithwaite, and J. Flouquet, Nature 406, 587 (2000).
- (9) D. Aoki, A. Huxley, E. Ressouche, D. Braithwaite, J. Flouquet, J. P. Brison, E. Lhotel, and C. Paulsen, Nature 413, 613 (2001).
- (10) S.- C. Zhang, Science 275, 1089 (1997).
- (11) P.G. Pagliuso et al., Phys. Rev. B64, 100503 (2001).
- (12) V. S. Zapf, E. J. Freeman, E. D. Bauer, J. Petricka, C. Sirvent, N. A. Frederick, R. P. Dickey, and M. B. Maple, Phys. Rev. B 65, 014506 (2002).
- (13) T. Mito, S. Kawasaki, Y. Kawasaki, G.-q. Zheng, Y. Kitaoka, D Aoki, Y Haga, and Y. Onuki, Phys. Rev. Lett. 90, 077004 (2003).
- (14) S. Kawasaki, T. Mito, Y. Kawasaki, G.-q. Zheng, Y. Kitaoka, D Aoki, Y Haga, and Y. Onuki, Phys. Rev. Lett. 91, 137001 (2003).
- (15) H. Hegger, C. Petrovic, E. G. Moshopoulou, M. F. Hundley, J. L. Sarrao, Z. Fisk, and J. D. Thompson, Phys. Rev. Lett. 84, 4986 (2000).
- (16) C. Petrovic et al., Europhys. Lett. 53, 354 (2001).
- (17) G.-q. Zheng, K. Tanabe, T. Mito, S. Kawasaki, Y. Kitaoka, D. Aoki, Y. Haga, and Y. Onuki, Phys. Rev. Lett. 86, 4664 (2001).
- (18) W. Bao et al., Phys. Rev. B 65 100505 (2002).
- (19) G.D. Morris et al Physica B 326, 390 (2003)
- (20) G.-q. Zheng, E. Yanase, Y. Kitaoka, K. Asayama, Y. Kodama, R. Tanaka and S. Endo, Solid State Commun. 79, 51 (1991).
- (21) T. F. Smith, C. W. Chu and M. B. Maple, Cryogenics. 9, 53 (1969).
- (22) D.E. Maclaughlin al, Phys. Rev. B 4, 60 (1971).
- (23) J. Chepin and J.H. Ross, J. Phys. Cond. Matt. 3, 8103 (1991).
- (24) N. Curro et al., Phys. Rev. B 62, 6100 (2000).
- (25) K. Betsuyaku and H. Harima, J. Mag. Mag. Matt. 272-276, 187 (2004).
- (26) T. Mito, S. Kawasaki, G.-q. Zheng, Y. Kawasaki, K. Ishida, Y. Kitaoka, D. Aoki, Y. Haga, and Y. Onuki, Phys. Rev. B 63, 220507 (2001).
- (27) S. Kawasaki, T. Mito, G.-q. Zheng, C. Thessieu, Y. Kawasaki, K. Ishida, Y. Kitaoka, D. Aoki, S. Araki, Y. Haga, R. Settai and Y. Onuki, Phys. Rev. B 65, 020504 (2002).
- (28) T. Mito et al, unpublished.
- (29) Y. Kohori et al, Eur. Phys. J. B18, 601 (2000).
- (30) S. Doniach, in Valence Instabilities and Related Narrow Band Phenomena, edited by R. D. Parks (Plenum, New York, 1977), p. 169.
- (31) Preliminary neutron results suggest that the ordered moment for =0.5 is reduced by a factor of 4 from that for the =0 sample (A. D. Christianson, private communication).
- (32) In fact, on going from CeRhIn5 to CeCoIn5, the hyperfine coupling decreases by a factor of 3. See Curro et al, Cond-mat/0205354.
- (33) S. Schmitt-Rink, K. Miyake and C.M. Varma, Phys. Rev. Lett. 57, 2575 (1986); K. Miyake, unpublished data (1991).
- (34) Y. Fuseya, H. Kohno and K. Miyake, J. Phys. Soc. Jpn. 72, 2914 (2003).
- (35) Y. Bang, M. J. Graf, A. V. Balatsky and J. D. Thompson, Phys. Rev. B 69, 014505 (2004).
- (36) G.-q. Zheng, Y. Kitaoka, K. Asayama, K. Hamada, H. Yamauchi and S. Tanaka, Physica C 260, 197 (1996).