Phase stability analysis in Fe-Pt and Co-Pt alloy systems: An augmented space study
Abstract
We have studied the problem of phase stability in Fe-Pt and Co-Pt alloy systems. We have used the orbital peeling technique in the conjunction of augmented space recursion based on the tight binding linear orbital method as the method for the calculation of pair interaction energies. In particular, we have generalized our earlier technique to take into account of magnetic effects for the cases where the magnetic transition is higher than the order disorder chemical transition temperature as in the case of Co3Pt. Our theoretical results obtained within this framework successfully reproduce the experimentally observed trends.
1 Introduction
The first-principles study of phase stability in alloy systems has been an active field of research for past several years. Research over years has established this field as one of the important stream of research in ab-initio electronic structure calculations. Theories have been formulated starting from the description of completely disordered phase [1] as well as that from ordered super-structures [2].
Alloy systems are in general complicated and modeling of all the relevant effects active in a particular alloy system is a challenge by itself. The aim is to have a microscopic understanding and predictive capability. One needs to take into account systematically the effects like the on-site and off-site disorder, charge-transfer effect, the effect of local lattice distortions, the short range ordering effect as is relevant for a given alloy system. For alloys with magnetic component, a further ingredient, namely magnetism is added to the problem. One might naively think that one needs to be concerned with magnetism only if one is interested in magnetic properties of materials. This is however not the case. Rather the formation of stable ordered structures can depend on properly taking into account magnetism, which can strongly effect the phase stability. The most illustrative example is that of the strong ferromagnet Ni-rich Fe-Ni alloys, where the ordering is entirely driven by magnetism and absence of spin-polarization in calculation leads to wrong ground state with phase-segregated rather than phase-ordered configuration [3]. There are also many other magnetic alloy systems which are not so strong ferromagnets as in the case of Ni-rich Fe-Ni with completely full majority spin d-states but posses similar attribute.
In our present study, we considered the problem of phase stability in Fe-Pt and Co-Pt alloys. There are many studies on magnetic, optical and magneto-optical characterization in these alloys [4]. Nevertheless, a systematic first-principles study on chemical ordering tendency is lacking. The phase diagrams of Fe-Pt [5] and Co-Pt [6] alloy systems show that the magnetic transition temperature is below the chemical order-disorder transition temperature in most part of the phase diagram except in the region of high concentration of Co (above 60) in Co-Pt alloys. In this region one would therefore expect a strong influence of magnetism on the chemical order. In our approach, the magnetism part is dealt within Stoner theory with rigidly exchange-split, spin-polarized band. Within this approach the paramagnetic phase has “no exchange-splitting” and the magnetization in the paramagnetic phase is lost via Stoner particle-hole excitations. However, the other point of view of describing the paramagnetic phase could be that of the local-moment formation where the average over the local moment’s orientations produce zero overall magnetization but nevertheless there exists a local-moment disorder [7]. Whether such description is necessary or not depends on the time-scale associated with the rate of change of orientation of the local moments as compared to the time scale of electronic motion. Staunton et.et al[7] have shown that consideration of such local moment formation can be important in describing properly the atomic short-range order data in FeV system. We are yet to explore the effect of such local moment formations for the paramagnetic Fe-Pt and Co-Pt alloys. However our results obtained within Stoner approach already show reasonable agreement with experimental result, suggesting the necessity of inclusion of such effect in a second level. Our calculational scheme is that of augmented space recursion implemented within the framework of first-principles electronic structure calculation of TB-LMTO. Our scheme has been already proved to be efficient to handle the issues of off-diagonal disorder, large charge transfer effect, local lattice distortion which are important for alloys with large size mismatch between components and components with very different valences as is the case in Fe-Pt and Co-Pt. Due to the presence of the high-mass element Pt, relativistic effect also turn out to be crucial, which has been dealt within the scalar relativistic theory. We perform a thorough analysis of the phase stability in terms of pair interaction, effective pair potential surfaces, instability temperatures and atomic short range order maps.
2 Formalism
We start from a completely disordered alloy. Each site has an occupation variable associated with it. For a homogeneous perfect disorder , where is the concentration of one of the components of the alloy. In this homogeneously disordered system we now introduce fluctuations in the occupation variable at each site : . Expanding the total energy in this configuration about the energy of the perfectly disordered state we get :
| (1) |
The coefficients , are the effective renormalized cluster interactions. is the energy of the averaged disordered medium. If we embed atoms of the type A or B at in the disordered background and the total energies are and , then by the above equation :
This one body interaction results from the interchange of a atom with an atom at site in the alloy. Similarly, is the effective renormalized pair interaction which is the difference in the one body interactions at , when site () is occupied either by an A or a B atom.
For magnetic pair interaction energy we take the averaged non magnetic disordered medium and embed two same atoms with two different spins up and down and calculate pair interaction energy as explained above. The same we repeat for other components with two different spins up and down. Then we embed the different atoms with same as well as two different spins up and down. This procedure gives us the magnetic pair interaction energies which are given as:
Similarly,
And,
Therefore the effective magnetic pair interaction energy is given as:
Thus we can arrive at the relation of effective pair interaction energy including magnetism as:
| (2) |
We will retain terms up to pair interactions in the configuration energy expansion. Higher order interactions may be included for a more accurate and complete description. For the phase stability study it is the pair interaction which plays the dominant role. The total energy of a solid may be separated into two terms : a one-electron band contribution and the electrostatic contribution . The renormalized cluster interactions should, in principle, include both and contributions. Since the renormalized cluster interactions involve the difference of cluster energies, it is usually assumed that the electrostatic terms cancel out and only the band structure contribution is important. Such an assumption though is not rigorously true, has been shown to hold good in a number of alloy systems [8]. Considering only band structure contribution, the effective pair interactions may be written as :
| (3) |
where, represents the configurationally averaged Green function corresponding to the disordered Hamiltonian whose R and R′ sites are occupied by I-th and J-th type of atom, and
The behavior of this function is quite complicated and hence the integration by standard routines (e.g. Simpson’s rule or Chebyshev polynomials) is difficult, involving many iterations before convergence is achieved. Furthermore the integrand is multi-valued, being simply the phase of . The way out for this was suggested by Burke [9] which relies on the repeated application of the partition theorem on the Hamiltonian HIJ. The final result is given simply in terms of the zeroes and poles of the Green function in the region
| (4) |
where and are the zeros and poles of the peeled Green’s function of disordered Hamiltonian with occupancy at sites R and R′ by I and J of which first (k-1) rows and columns has been deleted. and are the number of poles and zeroes in the energy region below .
The calculation of the effective pair interaction with out magnetism as well as with magnetism taken in to account in our formalism reduces to the determination of the peeled configuration averaged green functions G. We employed the augmented space recursion coupled with the linearized tight-binding muffin tin orbital method (TB-LMTO) introduced by Andersen and Jepsen [10] for a first principles determination of these configuration averaged quantities. We took the most localized, sparse tight binding first order Hamiltonian derived systematically from the LMTO theory within the atomic sphere approximation (ASA) and generalized to random alloys. The augmented space recursion method with effective Hamiltonian used for recursion in augmented space for the calculation of the peeled Green functions has been described in earlier paper [11]. We refer the readers to this paper and references therein for the details.
For non-isochoric alloys, the difference in atomic radii of the constituents lead to change in the electronic density of states. One thus expects that the mismatch of size produces, in addition to a relaxation energy contribution, a change in the band structure. Within our Augmented Space Recursion (ASR), off-diagonal disorder in the structure matrix because of local lattice distortions due to size mismatch of the constituents, can be handled on the same footing as diagonal disorder in the potential parameters [12, 13].
The augmented space recursion with the TB-LMTO Hamiltonian coupled with orbital peeling allows us to compute configuration averaged pair interaction energies directly, without resorting to any direct averaging over a finite number of configurations. In an earlier communication [14] we have discussed how one uses the local symmetries of the augmented space to reduce the Hamiltonian and carry out the recursion on a reducible subspace of much lower rank. If we fix the occupation of two sites, the local symmetry of the augmented space is lowered (this is very similar to the lowering of spherical symmetry to cylindrical symmetry when a preferred direction is introduced in an isotropic system). We may then carry out the recursion in a suitably reduced subspace.
For the calculation of instability temperature using these pair interaction energies, we have used Khachaturian’s concentration wave approach in which the the stability of a solid solution with respect to a small concentration wave of given wave vector is guaranteed as long as . Instability of the disordered state sets in when :
| (5) |
is the instability temperature corresponding to a given concentration wave disturbance. is the Fourier transform of pair interaction energies and x is the concentration of one of the constituent atoms. The details are given in our previous paper [11] and references therein. This approach amounts to treating the entropy part within the Bragg-Williams mean field theory.
Experimentally the instability of the disordered phase to ordering may be seen in electron, x-ray or neutron scattering measurements. These are directly related to the Warren-Cowley short range order parameter which in turn is related to effective pair energies through [15]
| (6) |
Where, .
3 Computational details
We have performed the total energy density functional calculations for the ab-initio electronic structure description of alloys. The Kohn-Sham equations were solved in the local density approximation (LDA) for non magnetic calculations and local spin density approximation (LSDA) for magnetic calculations with von Barth-Hedin (vBH) [16] exchange correlations. The calculations have been performed in the basis of tight binding linear muffin-tin orbitals in the atomic sphere approximation (TB-LMTO-ASA) [10] [17]-[19] including combined corrections. The calculations are semi-relativistic through inclusion of mass-velocity and Darwin correction terms. The k-space integration was carried out with 323232 mesh resulting 969 k points for cubic primitive structures in the irreducible part of the corresponding Brillouin zone. The convergence of the total energies with respect to k-points have been checked. To have theoretical estimates of the equilibrium lattice parameters, we have carried out the minimization of the self-consistent TB-LMTO-ASA total energies varying lattice parameters for Fe-Pt and Co-Pt alloys at different concentrations. In Table 1, we have quoted thus obtained equilibrium lattice parameters that were used to calculate the self consistent potential parameters which were then used to calculate the pair interaction energies. For 25 concentration of Pt we have also calculated the equilibrium lattice parameter with magnetic contribution which has better agreement with corresponding experimentally predicted value. In all cases we have obtained lower equilibrium lattice parameters as compared to experimental ones. This is characteristic of the local density approximation which overestimates bonding.
| concentration | Calculated lattice | Experimental lattice |
|---|---|---|
| of Pt | parameter in a.u. | parameter in a.u. |
| Fe1-xPtx | ||
| 0.25 | 6.72 | 7.05 |
| 0.50 | 7.05 | 7.25 |
| 0.75 | 7.18 | 7.31 |
| Co1-xPtx | ||
| 0.25 | 6.71[6.78] | 6.92 |
| 0.50 | 7.08 | 7.20 |
| 0.75 | 7.18 | 7.24 |
The calculation of Madelung potential is a challenging job for disordered alloys due to the absence of lattice periodicity. For the treatment of the Madelung potential, we followed the procedure suggested by Kudrnovský et al[20] and use an extension of the procedure proposed by Andersen et al[10]. We have chosen the atomic sphere radii of the components in such a way that they preserve the total volume on the average and the individual atomic spheres are almost charge neutral. This ensures that total charge is conserved, but each atomic sphere carries no excess charge. In doing so, one needs to be careful about the sphere overlap which should be under certain limit so as to not violate the atomic sphere approximation.
The effective pair interaction energies are calculated at the Fermi level so one needs to be very careful about the convergence of our procedure. In fact, errors can arise in the augmented space recursion because one can carry out only finite number of recursion steps and then terminate the continued fraction using available terminators. Also one chooses a large but finite part of the augmented space nearest neighbour map and ignores the part of the augmented space very far from the starting state.
For finding out the Fermi energy accurately, we have used the energy dependent formulation of augmented space recursion in which the disordered Hamiltonian with diagonal as well as off-diagonal disorder is recast into an energy dependent Hamiltonian having only diagonal disorder. This allows one to sample more shells in the augmented space. Though this formulation reduces the computational burden, the recursion becomes energy dependent and it is not suitable to carry out one recursion per energy point. This is tackled by choosing a few seed points across the energy spectrum uniformly and then carry out recursion on those points and spline fit the coefficients of recursion through out the whole spectrum. This enabled us to carry out large number of recursion steps since the configuration space grows significantly less faster for diagonal as compared to off diagonal disorder. Convergence of physical quantities with recursion steps have been discussed in detail earlier by Ghosh [21].
We have checked the convergence of pair interaction energies with respect to recursion steps. The convergence of Fermi energy has also been checked with respect to recursion steps and seed energy points. We have found that the pair interaction energies and Fermi energy converge beyond seven recursion steps. We also found that we need at least thirty five seed energy points to get the convergence of Fermi energy. Our calculations reported in the following have been guided by these convergence properties.
4 Results and discussions
4.1 Pair interaction energies
| Concentration | V1 | V2 | V3 | V4 |
|---|---|---|---|---|
| of Pt (x) | ||||
| Fe1-xPtx | ||||
| 0.25 | 5.98[4.73] | -0.12[-0.15] | 0.39[0.15] | -0.15[-0.33] |
| 0.50 | 5.80 | -0.15 | 0.28 | -0.48 |
| 0.75 | 4.14 | -0.03 | 0.20 | -0.13 |
| Co1-xPtx | ||||
| 0.25 | 9.97[8.00] | -0.11[-0.13] | 0.24[0.17] | -0.30[-0.21] |
| Capitan et al[22] | [4.06] | [-1.83] | [0.39] | [-0.22] |
| 0.50 | 8.04 | -0.01 | 0.15 | -0.12 |
| 0.75 | 7.07 | 0.08 | 0.10 | -0.18 |
| Sanchez et al[23] | 1.11 | -2.27 | 0.33 | -0.93 |

The pair interaction energies calculated for 25, 50 and 75 concentration of Pt in Fe-Pt and Co-Pt alloy systems using above explained formalism are shown in the Table 2. In all cases we have obtained positive first nearest neighbour pair interaction energies which indicate the ordering tendency in these alloys as par with the experimentally predicted ordering tendencies.
From the Figure 1 we see the increase in first nearest neighbour pair interaction energies when one goes from Fe-Pt to Co-Pt. Figure 1 also shows the strong concentration dependence of pair interaction.
For 25 concentration of Pt in Co-Pt alloys, we have included the effect of magnetism since the Curie temperature lies above the order disorder transition temperature in the experimental phase diagram [6]. The first nearest neighbour pair interaction energy calculated with the inclusion of magnetic contribution comes out to be lower than the corresponding value obtained without magnetic contribution.
In the experimental phase diagram of Fe-Pt alloy system [5], the magnetic transition temperature (Curie temperature) for Fe3Pt lies much below the order disorder chemical transition temperature. So it is not necessary to include the magnetic effect to study the chemical ordering problem. However to compare it with the Co3Pt case we have carried out the calculation for Fe3Pt alloy too. Our calculation shows the same trend as Co3Pt, namely the dominant V1 interaction decreases on including magnetic effect.
In Figure 2, we show the density of states with and without magnetic contribution for 25 concentration of Pt in Co-Pt system. In magnetic case we see that the majority spin band almost full. The contribution to the pair interaction energy in this case mainly comes from the partially filled band. There is little decrease in the Fermi energy in magnetic case as compared to non magnetic case. This shifting of Fermi energy slightly reduces the pair interaction energy. The low value of first neighbour pair interaction energy in magnetic case is primarily due to the negative value of magnetic pair interaction energy between two Co atoms.
In Figure 3, taking the example of 25 concentration of Pt in Co-Pt with magnetic contribution, we show the variation of pair interaction energy as a function of nearest neighbour shells. The pair interaction energy decreases rapidly while going from first nearest neighbour to second nearest neighbour shell. For comparison we have also plotted the pair interaction energies extracted by Capitan et al[22] from their experimentally measured short range order using inverse cluster variation method. Our calculated first and second nearest neighbour pair interaction energies are higher than that of Capitan et al[22]. But there is agreement in the third and fourth nearest neighbour pair interaction energies. Though there are differences in the first and second nearest neighbour pair interaction energies between Capitan et al’s [22] and ours, the trend of pair interaction energy as a function of nearest neighbour shells is similar as is seen from the Figure 3.


The pair interaction energies extracted by Sanchez et al[23] from their experiment on short range order using inverse cluster variation method for 75 concentration of Pt in Co-Pt are tabulated in Table 2. Their first neighbour pair energy is lower in magnitude than that of second neighbour pair interaction energy. Our calculated pair interaction energies instead follow usual trend of having higher magnitude of first neighbour pair energy than that of second neighbour pair energy. Though there is substantial difference in the trend of pair interaction energies, the instability temperatures computed using both sets of pair interaction energies turn out to be almost same as shown in the section 4.4.

4.2 Effective pair potential surfaces
| Concentration | Experimental | V | V | V | V |
|---|---|---|---|---|---|
| of Pt (x) | ordering | ||||
| Fe1-xPtx | |||||
| 0.25 | L12 | 78.60 | -29.56 | -20.44 | -1.08 |
| 0.50 | L10 | 69.66 | -32.10 | -19.34 | -4.86 |
| 0.75 | L12 | 52.74 | -19.90 | -14.5 | -1.38 |
| Co1-xPtx | |||||
| 0.25 | L12 | 121.14[96.78] | -46.06[-36.66] | -36.98[-30.06] | -2.94[-1.74] |
| Capitan et al[22] | L12 | [44.46] | [-32.98] | [-15.90] | [8.34] |
| 0.50 | L10 | 98.58 | -34.86 | -30.5 | -1.38 |
| 0.75 | L12 | 85.56 | -30.76 | -26.60 | -2.64 |
| Sanchez et al[23] | L12 | -3.54 | -31.86 | -2.62 | 2.46 |
The effective pair potentials calculated using pair interaction energies (T = 0) for Fe-Pt and Co-Pt alloys at 25, 50 and 75 concentration of Pt are shown in the Table 3. These effective pair potentials were obtained by the Fourier transform of above explained first four nearest neighbour pair interaction energies. The values of for different ordering stars are compared in the Table 3. From the Table the minima are seen at the position . These minima clearly show the L12 chemical ordering for 25 and 75 and L10 chemical ordering for 50 concentration of Pt in these alloy systems. The value for increases when one goes from 25 to 50 and then decreases while going from 50 to 75 concentration of Pt in Fe-Pt alloys. In Co-Pt alloys The value for systematically decreases while going from 25 to 50 and then to 75 concentration of Pt.
In 25 concentration of Pt in Co-Pt alloy, the magnetic transition temperature is higher than the order disorder transition temperature. Therefore we have included the effect of magnetism in the chemical order in this particular alloy. The comparison of V minima shown in the Figure 4 with magnetic contribution indeed matches with the minima obtained using the pair interaction energies extracted from the experimentally measured short range order parameters using inverse cluster variation method by Capitan et al[22]. This experimental measurement was done in ferromagnetic state. If we compare with the non-magnetic V surfaces we see that there is decrease in the chemical ordering which indicates that the magnetism actually reduces the chemical ordering in this alloy allowing to order in lower temperature. As a comparison the “artificial” magnetic V surface of Fe3Pt alloy system shows that taking into account the effect of Vn farther than first nearest neighbour, magnetism increases slightly the tendency to chemical order over that of the non magnetic case.
The V minima obtained for CoPt3 using our theoretically calculated pair interaction energies and that of extracted pair interaction energies from the experimentally measured short range order parameters using inverse cluster variation method by Sanchez et al[23] match well which is shown in Figure 5. The differences seen in the patterns of V is due to the differences in individual pair interaction energies in real space. Though there is difference in surface patterns, the value of minima in both cases are very similar.


4.3 Instability temperatures
Using the pair interaction energies obtained by us, we have calculated the instability temperatures in Fe-Pt and Co-Pt alloys within Khachaturyan’s concentration wave approach as explained in Section 2. The results are shown in Figure 6. In Fe-Pt system the calculated order disorder transition temperatures are lower than that of corresponding experimental order disorder transition temperatures. We however clearly see the correct trend of calculated instability temperature with experimentally predicted transition temperature.
Our calculation with the inclusion of effect of magnetism for 25 concentration of Pt in Co-Pt alloys shows the instability temperature closer to experimental order disorder transition temperature than that of the calculated instability temperature with out magnetic effect. This is also in good agreement with the value obtained using the pair interaction energies extracted from the experimentally measured short range order parameters using inverse cluster variation method by Capitan et al[22]. For 50 concentration of Pt our calculated instability temperature matches with the calculation by Staunton’s group [24] using KKR-CPA based method. The calculated values of instability temperature are much higher than the experimentally predicted order disorder transition temperatures. The values of instability temperatures obtained by us and Staunton’s group [24] and that of Sanchez’s group [23] (using extracted pair interaction energies upto fourth nearest neighbour from the experimentally measured short range order parameters using inverse cluster variation method) for 75 concentration of Pt are almost similar and slightly lower than the experimental predictions of order disorder transition temperatures.

The experimental phase diagram of Co-Pt shows that the order disorder transition temperature for 75 concentration of Pt higher than 25 concentration of Pt. But the experimental phase diagrams of Fe-Pt and Ni-Pt show the order disorder transition temperature for 25 concentration of Pt higher than 75 concentration of Pt. Our calculation for Fe-Pt and previous calculation for Ni-Pt [11] show the similar trend of instability temperature as that of experimental trend of order disorder transition temperature. In Co-Pt our calculated instability temperature at 25 concentration of Pt is higher than that of 75 concentration of Pt. But the experimental order disorder transition temperature is otherwayround as pointed out above. This calls the need for further investigation in terms of important effects that might have been overlooked. One important effect among these could have been the neglect of possible local moment formations in the paramagnetic CoPt and CoPt3 alloy systems which might be relatively more important than that in Fe-Pt systems. The next important effect to be taken into account in general for all alloy systems studied is the effect of electrostatic contribution in the effective pair interaction energies and the effect of multisite interactions in addition to the pair interaction.
Our comparison of calculated transition temperatures for Fe-Pt and Co-Pt shows that the transition temperatures for corresponding concentrations of Pt in these alloys increase as we go from Fe-Pt to Co-Pt (and then to Ni-Pt [11]).
4.4 Short range order
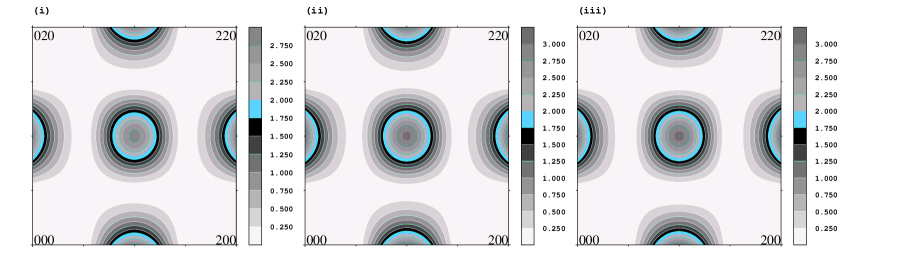
The SRO parameters for different ordering stars calculated using pair interaction energies (T = 0) for Fe-Pt and Co-Pt alloys at 25, 50 and 75 concentration of Pt are shown in the Table 4. These SRO values were calculated at 10 K above the instability temperatures using above explained first four nearest neighbour pair interaction energies to see the effect of SRO in the disordered phase. These SRO values show the peak positions at . These peak positions correspond to the diffused scattering peaks which clearly show the L12 short range ordering for 25 and 75 and L10 short range ordering for 50 concentration of Pt in the disordered phase of these alloy systems. In Figure 7 we show the concentration dependence of SRO peaks . For 50 concentration of Pt in Fe-Pt and Co-Pt the magnitude of SRO peak is maximum. Next higher peak magnitude is for 25 concentration of Pt in these alloys and the least is for 75 concentration of Pt. The trend matches with the trend of experimental order disorder transition temperature.
| Concentration | Experimental | ||||
|---|---|---|---|---|---|
| of Pt (x) | ordering | ||||
| Fe1-xPtx | |||||
| 0.25 | L12 | 0.009 | 2.987 | 0.106 | 0.035 |
| 0.50 | L10 | 0.010 | 3.965 | 0.077 | 0.036 |
| 0.75 | L12 | 0.014 | 2.720 | 0.173 | 0.053 |
| Co1-xPtx | |||||
| 0.25 | L12 | 0.006[0.004] | 2.834[3.045] | 0.106[0.144] | 0.023[0.028] |
| Capitan et al[22] | L12 | [0.013] | [3.063] | [0.057] | [0.024] |
| 0.50 | L10 | 0.007 | 3.943 | 0.217 | 0.030 |
| 0.75 | L12 | 0.009 | 2.851 | 0.222 | 0.035 |
| Sanchez et al[23] | L12 | 0.035 | 3.014 | 0.034 | 0.025 |
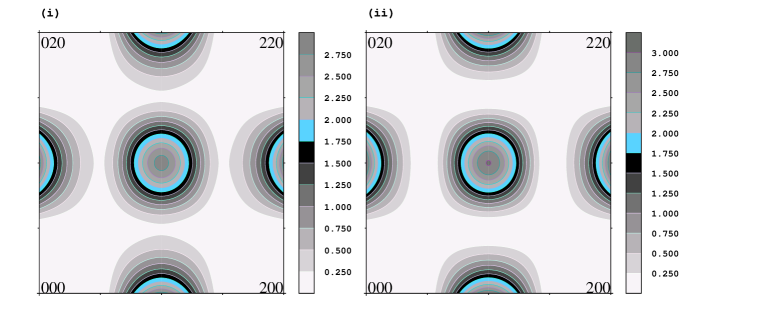
The SRO patterns for Co3Pt with magnetic contribution match with the patterns obtained by the Fourier transform of Capitan et al’s [22] experimental real space SRO parameters which is shown in the Figure 8. If we compare with the non-magnetic SRO patterns we see there is enhancement in the SRO peak which indicates that the magnetism actually enhances the short range ordering in the disordered phase of this alloy.
The SRO patterns obtained for CoPt3 using our theoretically calculated pair interaction energies and that the patterns obtained by the Fourier transform of Sanchez et al’s [23] real space SRO parameters agree reasonably well, although the effective pair potential surfaces have been shown to differ quite a bit as discussed in section 4.3. This in turn points to nonuniqueness of the scheme to extract the pair interaction energies from experimentally measured SRO data.

5 Conclusion
We have applied our theory for chemical order in metallic alloys for Fe-Pt and Co-Pt systems. Our investigation indicates the chemical ordering tendency in these alloys. There is short range ordering tendency in the disordered phase of these alloys. Taking the example of Co3Pt we have demonstrated how the magnetism plays a role in chemical order within the Stoner approach. We have compared our calculations of atomic short range order in Co3Pt and CoPt3 with diffuse x-ray and neutron scattering experiments and obtained fair agreements. In this study of Fe-Pt and Co-Pt alloys we have demonstrated that our augmented space recursion method coupled with orbital peeling in the basis of linear muffin tin orbital is capable for accurate prediction of chemical order. This method allows one to take proper account of charge transfer effect, off-diagonal disorder effect and local lattice distortion which are important for alloys with large size mismatch between the components which may not be fully taken into account in the mean field based theories like single site coherent potential approximation.
References
References
- [1] Gonis A., Zhang X. G., Freeman A. J., Turchi P., Stocks G. M. and Nicholson D. M., 1987 Phys. Rev.B36 4630 (1987)
- [2] Connolly J. W. D. and Williams A. R., 1983 Phys. Rev.B27 5169.
- [3] Ducastelle F., Order and Phase Stability in Alloys (Elsevier Science, New York, 1991).
- [4] Uba S. et al 1998 Phys. Rev.B57 1534; Geerts W. 1994 et al Phys. Rev.B50 12581; Weller D., Harp G.R., Farrow R.F.C., Cebollada A. and Sticht J. 1994 Phys. Rev. Lett.72 2097
- [5] Stahl B., Ellrich J., Theissmann R., Ghafari M., Bhattacharya S., Hahn H., Gajbhiye N. S., Kramer D., Viswanath R. N., Weissm ller J. and Gleiter H. 2003 Phys. Rev. B 67, 014422
- [6] Sanchez J. M., Moran-Lopez J. L., Leroux C. and Cadeville M.C. 1988 J. Phys. C: Solid State Phys. 21 L1091
- [7] Staunton J. B., Ling M. F. and Johnson D. D. 1997 J. Phys.: Condens. Matter 9 1281
- [8] Heine V., (1988) Solid State Physics 35 (Academic Press, N. Y. )
- [9] Burke N. R., 1976 Surf. Sci. 58 349
- [10] Andersen O. K. and Jepsen O., 1984 Phys. Rev. Lett.53 2571
- [11] Paudyal D., Saha-Dasgupta T. and Mookerjee A., 2003 J. Phys.: Condens. Matter15 1029
- [12] Saha T. , Dasgupta I. and Mookerjee A. , 1995 Phys. Rev.B51 3413
- [13] Saha T., Dasgupta I. and Mookerjee A., 1996 J. Phys. Condens. Matter. 8 2915
- [14] Saha K.K., Saha-Dasgupta T., Mookerjee A. and Dasgupta I., 2004 J. Phys.: Condens. Matter 16 1409
- [15] Ling M. F. , Staunton J. B. and Johnson D. D. 1994 J. Phys.: Condens. Matter 6 5981
- [16] von Barth U. and Hedin L., 1972 J. Phys. C: Solid State Phys.5 1629
- [17] Andersen O.K., Jepsen O. and Šob M., Electronic Band Structure and Its Applications ed. M. Yussouff. Lecture Notes in Physics 283, Springer 1987 , 1992.
- [18] Andersen O.K., Jepsen O. and Krier G., Lectures on Methods of Electronic Structure Calculations eds.: V. Kumar, O. K. Andersen, A. Mookerjee. Singapore, World Scientific , 1994.
- [19] Das G.P., Electronic Structure of Alloys, Surfaces and Clusters, Advances in Condensed Matter Science, Vol. 4, eds.: A. Mookerjee and D. D. Sharma, Taylor-Francis, 2003
- [20] Kudrnovský J. and Drchal V., 1990 Phys. Rev.B41 7515
- [21] Ghosh S.D., 2000 Ph.D. Thesis, Jadavpur University
- [22] Capitan M., Lefebvre S., Calvayrac Y., Bessi re M., and C n d se P., 1999 J. Appl. Crystallogr. 32, 1039
- [23] Kentzinger E., Parasote V., Pierron-Bohnes V., Lami J. F., Cadeville M. C., Sanchez J. M., Caudron R., and Beuneu B. 2000 Phys. Rev. B 61, 14975
- [24] Razee S. S. A., Staunton J. B., Ginatempo B., Bruno E., and Pinski F. J. 2001 Phys. Rev. B64, 014411