Vulnerability and Protection of Critical Infrastructures
Abstract
Critical infrastructure networks are a key ingredient of modern society. We discuss a general method to spot the critical components of a critical infrastructure network, i.e. the nodes and the links fundamental to the perfect functioning of the network. Such nodes, and not the most connected ones, are the targets to protect from terrorist attacks. The method, used as an improvement analysis, can also help to better shape a planned expansion of the network.
pacs:
89.75.Hc, 89.75.Fb, 89.20.Hh, 89.40.-aCorresponding author: Vito Latora, latora@ct.infn.it
The attacks of September 11 2001 have raised
in all its urgency the problem of protecting
critical infrastructures from terrorist attacks.
The US President’s Commission on Critical Infrastructures Protection
pccip
has defined five different categories of critical infrastructures:
1) information-communication,
2) banking and finance,
3) energy (e.g. electric, oil, gas),
4) physical distribution (including transportation),
5) vital human services (including water supply).
In this paper we propose a general method to find the
critical components of a critical infrastructure
network bologna .
By critical components we mean the nodes and the edges
crucial to the best functioning of the network, and
therefore the strategic points of the network to improve or to
protect from terrorist attacks.
Recently, attacks on artificially generated random and scale-free topologies
and on real-world networks have been studied intensively. In the
literature appeared so far the attacks were simulated as the deliberate
removal either of nodes barabasi3att ; holme ; clmr1 ; albert ; clm3 or
of links girvan ; holme ; motter of the network.
The rationale of our method is different from the previous
ones: instead of sorting and removing the nodes in descending
order of degree barabasi3att ; holme ; clmr1 ; albert
or betweenness holme ; albert ; clm3 , and the edges in descending order
of betweennes girvan ; holme or range motter ,
we measure the importance of an element of the network
by the drop in the network’s performance caused by the
deactivation of that element. In practice we check for the
redundancy of an element by calculating the performance
of the perturbed network and comparing it with the
original one.
The element can be a single node or edge,
or a group of nodes and edges if we want to simulate multiple attacks.
In this way we define the vulnerability of
the network under a given class of attacks and we produce a list of
the points of the network that should be the first concern of any
policy of protection from terrorist attacks.
Analogously, we measure the importance of an improvement by
the increase in the network’s performance caused by such improvement.
The paper is organized as follows: we first
present the general framework to define
critical damages, critical improvements, structural vulnerability
and improvability of a critical infrastructure.
We then show how the method works in practice on some examples
of communication and transportation critical infrastructures.
We assume that a generic critical infrastructure is characterized by a single variable , the performance of ext . The definition and quantitative analysis of the critical components of , we propose in this paper, uses, as reference observable, variations in the performance . We consider separately the study of damages and of improvements.
Attacks analysis. Let us indicate by a set of possible damages on the infrastructure , and with a map that gives the infrastructure resulting from after the damage . We measure the importance of the damage by the relative drop in performance , with , caused by . In particular, the critical damage is the damage of that minimizes . The vulnerability of under the class of damages can be defined as:
| (1) |
where is the worst performance of under the class of damages . The vulnerability is defined in the range [0,1].
Improvements analysis. We now turn our attention into how to improve an existing infrastructure twoimprovements . Various improvements can be added to , so given a set of improvements we define, for any improvement , the map that gives the resulting infrastructure obtained after the improvement . We measure the importance of as the relative increase in the performance , with , caused by . In particular we define the critical improvement as the best possible improvement in , i.e. the improvement of that maximizes . Then, the improvability of under the class of improvements can be defined as:
| (2) |
where is the best performance of under the class of improvements .
As a practical application of the method we consider communication-information (as the Internet rosato ) and transportation infrastructure networks. We represent the infrastructure network as a valued wasserman undirected directed graph with nodes (for instance the routers in the Internet, or the stations in a railway transportation system) and links (the cables connecting two routers, or the lines connecting couples of stations). is described by the adjacency matrix . If there is a link between node and node , the entry is a positive number measuring the link latency, otherwise . For instance, in the Internet (in the railway system) the larger is, the longer it takes for a unitary packet of information (a train) to go along the link from to . We have now different ways to measure the performance of . In this paper we identify the performance of with the efficiency of the network i.e. we assume: , where is the smallest sum of the links latency throughout all the possible paths in the graph from a node to a node (in the particular case of unvalued graphs reduces to the minimum number of links traversed to get from to ). The efficiency is a quantity recently introduced in refs.lm24 to measure how efficiently the nodes of the network communicate if they exchange information in parallel. A second possibility is to assume the performance to be equal to the inverse of the characteristic path length watts ; lm24 . An alternative possibility to avoid the shortest path assumption on which both and rely, is to identify with the mean flow-rate of information over flow .
Ca*net3
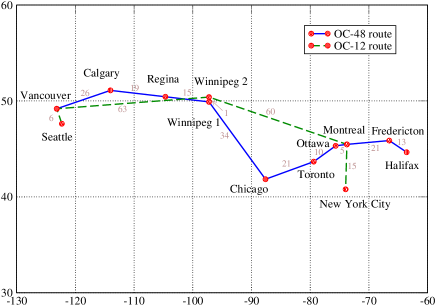
We show how the method works in practice by considering
the Ca*net3 IS-IS routing network canet3
represented in fig.1, a simple example of an Internet
backbone, consisting of two main routes, OC-12 and OC-48,
routers and links.
As the backbone has diverse routes of different
bandwidths, the preferred path between any two routers is the
path which presents the least amount of latency under normal
router load conditions.
We consider three different classes (sets) of damages :
the damage of a single cable connection,
of a single Internet router, and of a couple of routers.
is the network we obtain
from after the deactivation of the damaged component
(respectively the damaged link, node or couple of nodes).
The damage of single links allows to investigate the finer
effects on the network, since the damage of a node
implies the damage of a number of links equal to the node’s
degree.
The entity of the damage is given by the relative drop in
the efficiency caused by .
As class of improvements we consider the effect of adding
a new link (the addition of groups of links will be considered in
nextpaper ). is the network we obtain from
after the addition of the new link.
The results shown in table 1 indicate that the connection
Winnipeg2-Winnipeg1 is by far the most important one since it is
crucial for the correct interplay of the OC-12 and OC-48 routes.
| Damaged link | ||
| 1 | Winnipeg2 - Winnipeg1 | 0.358 |
| 2 | Ottawa - Montreal | 0.146 |
| 3 | Montreal - Fredericton | 0.123 |
| 4 | Seattle - Vancouver | 0.098 |
| Damaged node | ||
| 1 | Winnipeg1 | 0.466 |
| 2 | Winnipeg2 | 0.408 |
| 3 | Montreal | 0.317 |
| 4 | Ottawa | 0.220 |
| Damaged couple of nodes | ||
| 1 | Winnipeg1 + Montreal | 0.792 |
| 2 | Winnipeg1 + Ottawa | 0.723 |
| 3 | Winnipeg2 + Montreal | 0.702 |
| 4 | Winnipeg2 + Ottawa | 0.700 |
| 5 | Winnipeg2 + Toronto | 0.633 |
| Added Link | ||
| 1 | Toronto - NYC | 0.01237 |
| 2 | Ottawa - NYC | 0.00770 |
| 3 | Winnipeg1 - Toronto | 0.00587 |
| 4 | Fredericton - NYC | 0.00546 |
| 5 | Winnipeg2 - Toronto | 0.00514 |
| 6 | Seattle - Calgary | 0.00508 |
The routers Winnipeg1 and Winnipeg2 are respectively the first and the second in the list of the most important nodes. Conversely when two nodes are removed at once, the couple Winninipeg1 + Montreal produces a larger effect than the couple Winnipeg1 + Winnipeg2 which is only the tenth in the list (not in table) with . Concerning the improvement analysis, the best links to add are long cables bridging two different parts of the network, as for instance Toronto-NYC or Winnipeg1-Toronto.
Infonet As a second example we study the Internet backbone of Infonetinfonet , as of September 2001. The network of Infonet has nodes and cable connections and carries about the of the traffic over US and Europe. It consists of two main parts, the US and the European backbone respectively with and nodes, connected by three overseas cables. In table 2 we consider the same classes of damages and improvements as in the previous example.
| Damaged link | |||
| 1 | NYC-New Jersey | 0.379 | 2205 |
| 2 | New Jersey-Chicago | 0.229 | 1185 |
| 3 | NYC-Washington | 0.197 | 1185 |
| 4 | Washington-Atlanta | 0.183 | 1120 |
| 5 | New Jersey-San Jose | 0.179 | 984 |
| 6 | New Jersey-Dallas | 0.122 | 609 |
| Damaged node | |||
| 1 | New Jersey | 0.573 | 9 |
| 2 | NYC | 0.530 | 9 |
| 3 | Chicago | 0.280 | 15 |
| 4 | Amsterdam | 0.241 | 9 |
| 5 | Atlanta | 0.227 | 14 |
| 6 | Washington | 0.203 | 2 |
| Damaged couple of nodes | |||
| 1 | NYC + New Jersey | 0.723 | 17 |
| 2 | New Jersey + Amsterdam | 0.710 | 18 |
| 3 | New Jersey + Atlanta | 0.707 | 23 |
| 4 | New Jersey + Frankfurt | 0.689 | 20 |
| 5 | NYC + Chicago | 0.685 | 24 |
| 6 | New Jersey + Washington | 0.673 | 11 |
| Added Link | |||
| 1 | New Jersey-Atlanta | 0.0522 | |
| 2 | Chicago-Atlanta | 0.0481 | |
| 3 | NYC-Atlanta | 0.0437 | |
| 4 | San Jose-Atlanta | 0.0395 | |
| 5 | Dallas-Atlanta | 0.0341 | |
| 6 | Chicago-Amsterdam | 0.0339 | |
| 7 | NJersey-Amsterdam | 0.0329 | |
| 8 | NYC-Chicago | 0.0326 | |
| 9 | Atlanta-Amsterdam | 0.0318 | |
| 10 | Chicago-Frankfurt | 0.0316 | |
| 11 | Atlanta-Frankfurt | 0.0296 |
The vulnerability of Infonet under single link damages is , with NYC-New Jersey being the critical link damage. Such a link plays in the network a role similar to red bonds in percolation percolation . In fact the removal of such a link will result in a break up of the network into two disconnected parts of about the same size, with a decrease of the in the performance of the network. Notice that the second highest link damage produces only a drop of in the performance. Other important links are those connecting New-Jersey with Chicago, with San Jose and with Dallas, and some links in the east cost as NYC-Washington and Washington-Atlanta. The links in table, ordered according to , have also a decreasing betweenness , another measure of link centrality wasserman defined as the number of times the link is in the shortest paths connecting couples of nodes girvan . Nevertheless, the correlation between and is not perfect: for instance the link NYC-Amsterdam, with the second highest betweenness, ranks only 14th according to . The vulnerability under damages of single nodes (couples of nodes) is (). New Jersey and NYC are by far the two most important nodes: the damage of either one would disconnect the US from the European backbone, reducing by more than the performance of the network. The damage of both nodes at once reduces by more than the network performance. The damage analysis of other networks maps shows that the link NYC-New Jersey and the nodes NYC and New Jersey play an important role also in other Internet backbone maps. Such result might explain the significant drop in performance, marked by increased packet loss and difficult in reaching some Web Sites (in particular in the connection from US to Europe), experienced by the Internet in the aftermath of the 11 September terrorist attacks. In fact the stress the US Internet infrastructure was subjected to was the greatest encountered over its 32-year history and was probably related to the damages of Internet routers and cables in the south of NYC media .
| Damaged link | ||
| 1 | Park Street(RG)- Boylstone(G) | 0.275 |
| 2 | Boylstone(G) - Arlington(G) | 0.270 |
| 3 | Arlington(G) - Copley(G) | 0.270 |
| 4 | Copley(G) - Hynes(G) | 0.256 |
| 5 | Hynes(G) - Kenmore(G) | 0.255 |
| 6 | Kenmore(G) - Blandfor(G) | 0.185 |
| Damaged node | ||
| 1 | Kenmore(G) | 0.343 |
| 2 | Copley(G) | 0.333 |
| 3 | Park Street(RG) | 0.331 |
| 4 | Boylstone(G) | 0.285 |
| 5 | Arlington(G) | 0.281 |
| 6 | Hynes(G) | 0.266 |
| Damaged couple of nodes | ||
| 1 | Down. Cross.(RO) + Kenmore(G) | 0.508 |
| 2 | Park Street(RG) + Kenmore(G) | 0.495 |
| 3 | Down. Cross.(RO) + Copley(G) | 0.465 |
| 4 | Boylstone(G) + Kenmore(G) | 0.444 |
| Added Link | ||
| 1 | Mount Hood()- Dean () | 0.0390 |
| 2 | Mount Hood()- Tappan() | 0.0370 |
| 3 | Washington()- Tappan() | 0.0369 |
| 4 | Washington()- Dean () | 0.0368 |
| 5 | Sutherland()- Englewood() | 0.0360 |
| 6 | Mount Hood()- Englewood() | 0.0357 |
| 7 | Sutherland()- Dean () | 0.0355 |
The comparison of our measure with the node
degree wasserman i.e. with the number of links
incident with the node,
(see tab.2) shows that the damage of the most connected
nodes, the hubs barabasi3att , is not always the worst damage.
In fact, the damage of Chicago, the node with the highest ,
produces only a drop of in the performance
of the network, while the damage of Chicago and Atlanta,
the couple with the highest number of links (29) gives
(the 187th damage in the list).
This has deep consequences on the best strategy to
adopt in a protection policy.
In fact, a node with a large degree is immediately recognized
as a major channel of communication,
being very visible since in direct contact to many
other nodes wasserman . On the other hand, Infonet is a
typical example in which the crucial components, i.e. the nodes to protect
from the attacks, are not the hubs, but
less visible and apparently minor nodes.
Our results imply either an intense policy of protection of the
critical links/nodes from attacks, or a strategic expansion of the
network with the addition of new links bologna .
We now investigate the best strategies to increase the
performance of the network by the addition of a new link.
The improvability of under such a class of
improvements is . In the highest positions
we find two different classes of links:
links connecting two IP presences in the US,
and links connecting US and Europe as
Chicago-Amsterdam, NJersey-Amsterdam, Atlanta-Amsterdam,
Chicago-Frankfurt and Atlanta-Frankfurt.
A new link between Us and Europen, namely the link Washington-Geneva,
was in fact planned in the expansion of Infonet 2001.
Our method predicts that the inclusion of such a link
increases by the network performance.
MBTA As a final example we cosider a transportation system, the Boston subway, consisting of four lines, stations and tunnels mbta . Here the links latency has been taken to be proportional to the time it takes to go from a station to the next one. The results of the analysis are in table 3. The vulnerability is equal to 0.275,0.343,0.508, respectively for damages of single links, single nodes or couples of nodes. The critical link is Park Street - Boylstone. is equal to 0.0390 with best links to be added those connecting stations on the green line B with stations on the green line C.
Summing up, in this paper we have proposed a new general method to spot the critical components of a critical infrastructure system. With this method we are able to identify the points of a network that are crucial to the functioning of the infrastructure network, i.e. those nodes and connections whose protection from terrorist attacks must be assumed as the first concern of any national policy. The method, used as an improvement analysis, can also help to better shape an expansion of the network. Other classes of critical infrastructure systems are currently under study and will be presented in a future work nextpaper .
References
- (1) http://www.info-sec.com/pccip/pccip2/index.html
- (2) S. Bologna, C. Balducelli, G. Dipoppa and G. Vicoli, Lecture Notes in Comp. Sci. 2788, 342 (2003).
- (3) R. Albert, H. Jeong, and A.-L. Barabási, Nature 406, 378 (2000); Nature 409, 542 (2001).
- (4) P. Holme, B. J. Kim, C. N. Yoon and S. K. Han, Phys. Rev. E 65, 056109 (2002).
- (5) Crucitti, P., V. Latora, M. Marchiori, and A. Rapisarda. Physica A 320, 622 (2003).
- (6) R. Albert, I. Albert and G.L. Nakarado, Phys. Rev. E 69, 025103(R) (2004).
- (7) P. Crucitti, V. Latora and M. Marchiori, Phys. Rev. E 69, 045104(R) (2004).
- (8) M. Girvan, and M. E. J. Newman. Proc. Natl. Acad. Sci. USA 99, 8271 (2002).
- (9) A. E. Motter, T. Nishikawa, Y. Lai, Phys. Rev. E 66, 065103 (2002).
- (10) The method can be extended to the case in which the performance is a combination of two or more variables.
- (11) There are two main improvement strategies: we can better shape the expansion of a given infrastructure in order to increase its performance, or in order to decrease its vulnerability. The most general strategy is an appropriate combination of the above two strategies, to get a good mixture of performance and low vulnerability. In this paper we adopt the first of the two strategies.
- (12) V. Rosato, F. Tiriticco, Europhys. Lett. 66, 471 (2004).
- (13) S. Wasserman and K. Faust, Social Networks Analysis (Cambridge University Press, Cambridge, 1994).
- (14) The formalism presented in this paper can be easily extended also to directed graphs.
- (15) V. Latora and M. Marchiori, Phys. Rev. Lett. 87, 198701 (2001); Eur. Phys. J. B32, 249-263 (2003).
- (16) D.J. Watts and S.H. Strogatz, Nature 393, 440 (1998).
- (17) L.R. Ford and D.R. Fulkerson, Flows in networks (Princeton University Press, Princeton, 1962).
- (18) http://205.189.33.72/optical/pdf/canet3routing.pdf
- (19) P. Crucitti, V. Latora and M. Marchiori, in preparation.
- (20) http://www.infonet.com
- (21) H.E. Stanley, J. Phys. A 10, 1211 (1977).
- (22) http://navigators.com/isp.html
- (23) http://www.cnn.com/2001/TECH/industry/09/12/telecom.operational.idg/
- (24) http://www.mbta.com/