Neutron scattering evidence on the nature of the boson peak
Abstract
A close inspection of neutron spectra of glass formers in the frequency region above the boson peak does not show the constant eigenvalue density expected for a random dynamical matrix, but a slow decrease towards higher eigenvalues. In 1,4-polybutadiene and selenium, the slope becomes steeper with increasing temperature in the undercooled liquid, suggesting an influence of the vibrational entropy. One can describe the behaviour quantitatively in terms of a balance between level repulsion (from the randomness of the dynamical matrix) and vibrational entropy. On the basis of this evidence, the boson peak must be a crossover from such a balance at higher frequencies to a mixture of sound waves and additional excitations at low frequency.
pacs:
63.50.+x, 64.70.PfThere is as yet no generally accepted explanation of the boson peak in the neutron or Raman spectrum of glasses gurevich ; schirmacher ; elliott ; nakayama ; gotze ; sokolov ; parisi ; ruocco . This is a broad peak at an energy transfer of a few meV, where simple crystals have only sound waves. Glasses seem to have a sizeable amount of excess vibrations at this boson peak. At present, it is not clear which driving force brings these vibrations down into the low-frequency region.
In this paper, we present for the first time experimental evidence for a subtle but important driving force neglected so far, the vibrational entropy.
The glass freezes at a relatively high temperature (the glass temperature ). At this temperature, the thermal energy is an order of magnitude higher than the vibrational energy quantum at the boson peak. Therefore any theoretical consideration of the origin of the boson peak should take the vibrational entropy into account, because it tends to bring the eigenmodes down to low frequencies. A lower frequency allows to distribute the thermal energy between more energy levels and thus increases the entropy barron ; hui .
In order to see this influence in experimental data, one plots the eigenvalue density against the eigenvalue on a logarithmic scale. Since the neutron measurement supplies the frequency as energy transfer , we define the eigenvalue and measure it in . The eigenvalue density , where is the conventional vibrational density of states. The boson peak is a broad peak in . Therefore it is more like a shoulder in .
All measurements presented were done on the time-of-flight spectrometer IN6 at the High Flux Reactor of the Institut Laue-Langevin in Grenoble, France. The wavelength of the incoming neutrons was . Some data have already been published, but not in the scaling presented here. The samples had a scattering probability of about 10 % to provide a reasonable balance between signal strength and multiple scattering contamination.
The data were evaluated in a new scheme for the determination of the vibrational density of states from coherent and incoherent inelastic neutron scattering data, developed by two of us at the Institut Laue-Langevin at Grenoble fabiani .
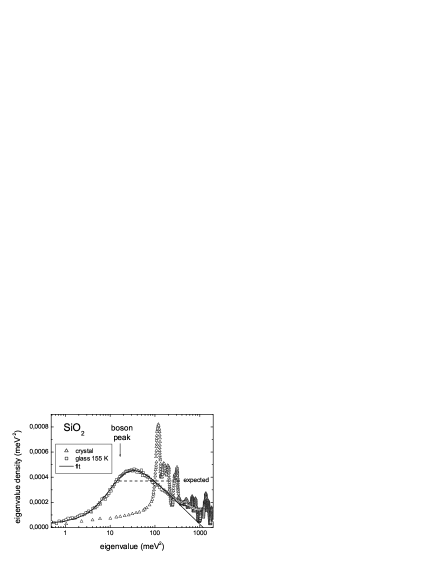
Fig. 1 shows the classical case of silica, the glass spectrum of a measurement at 155 K bu1 and the crystal spectrum from a lattice dynamical calculation strauch . In the region around 10 , the crystal shows pronounced van-Hove singularities. The disorder should broaden these low-lying van-Hove singularities into a quasi-constant eigenvalue density on the basis of Wigner’s famous solution wig of the random-matrix problem. Instead, we observe a slow decrease towards higher eigenvalues, linear on this logarithmic scale over nearly a decade. Our results are in qualitative agreement with recent nuclear inelastic scattering data chumakov , which find a stronger than -dependence in above the boson peak.
Let us see whether we can justify such a linear decrease on the basis of the concept of vibrational entropy. The tendency to form a constant eigenvalue density from the randomness of the dynamical matrix can be described in terms of an energetic level repulsion term schirmacher ; wig . We assume this level repulsion term to be proportional to the eigenvalue density, with a proportionality factor . The free energy of an eigenmode at the eigenvalue is then
| (1) |
The second term is the vibrational entropy barron ; hui in the classical limit .
From eq. (1) we obtain the eigenvalue density
| (2) |
which is the linear relation to we are looking for.
The slope should be proportional to the temperature, at least as long as the eigenvalue density is able to adapt itself to a new thermodynamic equilibrium. This can be used to check the validity of the scheme in the undercooled liquid.
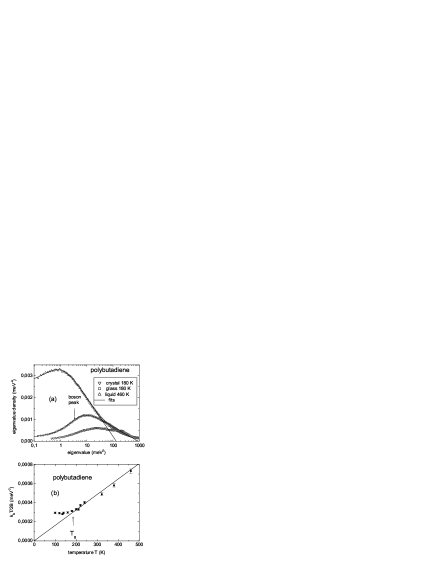
Fig. 2 (a) demonstrates the strong temperature change of the eigenvalue density in the heavily studied example of 1,4-polybutadiene zorn . The temperature dependence of the fitted slope in Fig. 2 (b) follows the expectation of eq. (2) over a wide temperature range, from high temperatures in the liquid down until the sample freezes at the glass temperature.
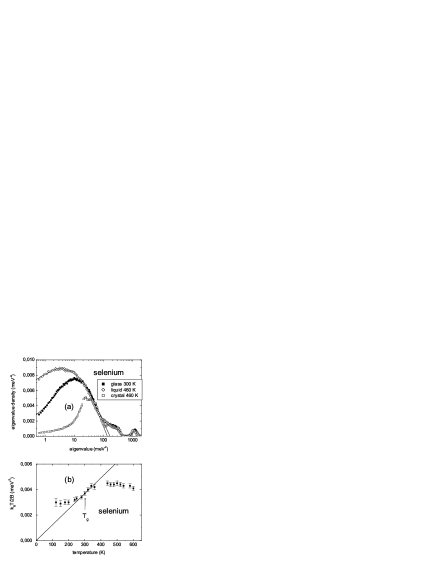
Polybutadiene is a clearcut example for the validity of eq. (2) over a wide temperature range, with a level repulsion constant which does not depend on temperature. This is not always the case. One finds a slight temperature dependence of in the third example, selenium, as shown in Fig. 3. These are already published data andrew , complemented by new experiments with a thinner sample. In this case, the proportionality of the fitted slope to temperature is limited to a small temperature range around , extending to slightly lower values as . But within that range, the selenium data again support the physical picture of a balance between vibrational entropy and level repulsion at frequencies above the boson peak.
If this picture is true, the boson peak must be a crossover phenomenon between such a balance at higher frequency and a quite different physical reality at low frequency. We know from many experiments that we have well-defined sound waves at frequencies below the boson peak. The question is: What is the physical mechanism which causes such a crossover? Is it the anharmonicity which reduces the number of levels of a given eigenmode potential as one approaches the eigenvalue zero? Or is it the interaction between resonant modes and sound waves?
Our experimental evidence does not provide a direct answer to this central question. But it suggests to look for a reasonable interpolation scheme between low and high frequency. At low frequency, one has again a reliable theoretical picture, namely an elastic medium with well-defined sound waves coexisting with a small number of additional modes. There, the neutron spectra should be well described by the soft-potential expression
| (3) |
This expression for the low-frequency spectrum is derived from the soft-potential model parshin , an extension of the tunneling model of the low temperature anomalies of glasses. The first term contains the Debye frequency and describes the sound waves. In addition to the sound waves, the model postulates a continuous distribution of additional modes around the eigenvalue zero. The positive eigenvalues provide vibrational resonant modes coexisting with the sound waves, the second term of eq. (3). The negative eigenvalues, in principle unstable modes, are supposed to be stabilized by the anharmonic fourth order term of the mode potential. They lead to double-well potentials, giving rise to tunneling states at low temperatures and to classical relaxation at higher temperatures. The third term of eq. (3) is the soft-potential expectation for this classical relaxation spectrum. and are given in terms of the parameters of the soft-potential model ramos
| (4) |
and
| (5) |
Here is the density of additional modes around the eigenvalue zero, is the average atomic mass, is the mass density and is the crossover energy between vibrational and tunneling states at low temperatures.
The soft-potential model has been checked against the low-temperature glass anomalies in the specific heat, the thermal conductivity and in the mechanical loss parshin ; ramos . The model predictions were found to be essentially correct, with an important exception: as soon as the barrier height of the double-well potentials begins to be a sizeable fraction of the thermal energy at the glass transition, the measured classical relaxation gets much weaker than the soft-potential prediction kasper ; ramos . As we will see, the same effect appears in the neutron spectra at elevated temperature.
In order to check the neutron data, one needs a suitable interpolation scheme between eq. (3) below the boson peak and eq. (2) above. As it turns out, it is convenient to use
| (6) |
where is given by eq. (2).
Eq. (6) is an elegant way of interpolating from one eigenvalue density to the other, without introducing an additional crossover parameter. One can characterize the whole spectrum with five reasonable parameters, each of which has a well-defined physical meaning either in the low-frequency or in the high-frequency range.
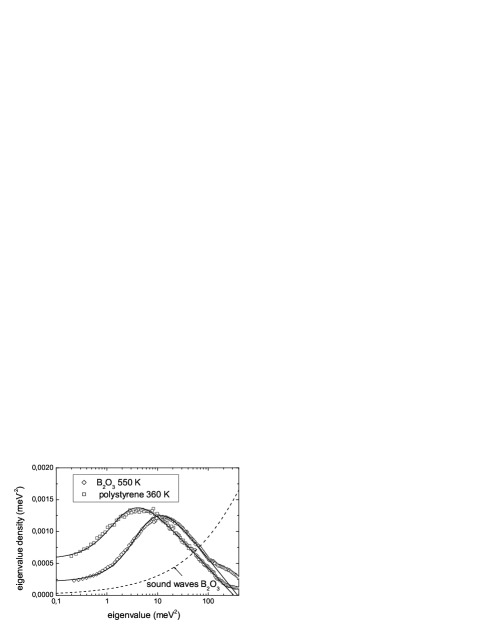
The above-mentioned failure of the soft-potential model is most clearly seen in the neighborhood of the glass temperature. Fig. 4 shows the neutron eigenvalue spectrum of at its glass temperature of 550 K engberg , together with the sound wave expectation on the basis of Brillouin scattering measurements at the same temperature grims . There is a sizeable relaxational signal at the low-frequency end, which allows to fit with an accuracy of 25 %. The vibrational contribution is fitted with the same accuracy. If one compares the ratio with the soft-potential expectation of eqs. (4) and (5), it is a factor of five too low (the comparison requires the crossover energy between vibrational and tunneling states, which was taken from ref. ramos ). The same is true for polystyrene at its glass temperature 360 K pecha in Fig. 4 and for the case of 1,4-polybutadiene at its glass temperature of 180 K in Fig. 2 (a).
While these results cannot be understood in terms of the soft-potential model, they support independently our conclusion on the importance of the vibrational entropy. describes the low-frequency additional vibrations at low energy transfer . These are eigenmodes which still have a positive eigenvalue. Therefore they profit in full from the vibrational entropy, having an entropy contribution to the free energy of . This is different for , which stems from eigenmodes with a negative eigenvalue. These modes correspond to relaxational jumps between neighbouring energy minima, with an entropy contribution to the free energy of the order . Thus one expects a Boltzmann factor ratio of the order of between positive and negative eigenvalues close to zero, if both freeze under otherwise identical conditions at the glass temperature. Since the thermal energy at the glass transition is an order of magnitude larger than the energy transfer at the boson peak, this is the observed factor of five.
To summarize, we find threefold experimental evidence for the influence of vibrational entropy on the neutron spectra of glass formers. The first is a decrease of the eigenvalue density above the boson peak, linear in a plot against the logarithm of the eigenvalue (this has already been seen in nuclear inelastic scattering chumakov , though fitted differently). The second is the temperature dependence of the corresponding slope above the glass temperature, proportional to temperature in 1,4-polybutadiene and selenium. The third is the weakness of the relaxational part of the spectrum close to the glass transition, which is a factor five weaker than the soft-potential expectation of an equal footing of positive and negative eigenvalues close to the eigenvalue zero.
These findings do not resolve the boson peak problem, but they set the stage for a proper theoretical treatment. They show the existence of a theoretically well-defined region at frequencies above the boson peak, where crystals have their first van-Hove singularity. At the glass transition, this region is dominated by the balance between level repulsion and vibrational entropy; sound waves are heavily overdamped there sette . On the other hand, the sound wave picture is the correct starting point in a glass below the boson peak frequency, where the glass is an elastic medium with a small number of additional excitations. The boson peak must be the crossover between these two regions.
References
- (1) V. L. Gurevich, D. A. Parshin and H. R. Schober, Phys. Rev. B 67, 094203 (2003)
- (2) W. Schirmacher, G. Diezemann and C. Ganter, Phys. Rev. Lett. 81, 136 (1998)
- (3) S. N. Taraskin, Y. L. Loh, G. Natarajan and S. R. Elliott, Phys. Rev. Lett. 86, 1255 (2001)
- (4) T. Nakayama, Rep. Prog. Phys. 65, 1195 (2002)
- (5) W. Götze and M. R. Mayr, Phys. Rev. E 61, 587 (2000)
- (6) A. P. Sokolov, R. Calemczuk, B. Salce, A. Kisliuk, D. Quitmann and E. Duval, Phys. Rev. Lett. 78, 2405 (1997)
- (7) T. S. Grigera, V. Martin-Mayor, G. Parisi and P. Verrocchio, J. Phys.: Cond. Matter 14, 2167 (2002)
- (8) T. Scopigno, E. Pontecorvo, R. Di Leonardo, M. Krisch, G. Monaco, G. Ruocco, B. Ruzicka and F Sette, J. Phys.: Condens. Matter 15, S1269 (2003)
- (9) T. H. K. Barron, in it Lattice Dynamics, ed. by R. F. Wallis (Pergamon, New York 1965)
- (10) J. C. K. Hui and P. B. Allen, J. Phys. C 8, 2933 (1975)
- (11) E. Fabiani, A. Fontana and U. Buchenau (unpublished)
- (12) U. Buchenau, M. Prager, N. Nücker, A. J. Dianoux, N. Ahmad and W. A. Phillips, Phys. Rev. B 34, 5665 (1986)
- (13) H. Schober, D. Strauch, K. Nützel and B. Dorner, J. Phys.: Condens. Matter 5, 6155 (1993)
- (14) E. P. Wigner, Ann. of Math. 67, 325 (1958)
- (15) A. I. Chumakov, I. Sergueev, U. van Bürck, W. Schirmacher, T. Asthalter, R. Rüffer, O. Leupold and W. Petry, Phys. Rev. Lett. 92, 245508 (2004)
- (16) R. Zorn, A. Arbe, J. Colmenero, B. Frick, D. Richter and U. Buchenau, Phys. Rev. E 52, 781 (1995)
- (17) W. A. Phillips, U. Buchenau, N. Nücker, A. J. Dianoux and W. Petry, Phys. Rev. Lett. 63, 2381 (1989)
- (18) D. A. Parshin, Phys. Solid State 36, 991 (1994)
- (19) M. A. Ramos and U. Buchenau, Phys. Rev. B 55, 5749 (1997)
- (20) R. Keil, G. Kasper and S. Hunklinger, J. Non-Cryst. Sol. 164-166, 1183 (1993)
- (21) D. Engberg, A. Wischnewski, U. Buchenau, L. Börjesson, A. J. Dianoux, A. P. Sokolov and L. M. Torell, Phys. Rev. B 58, 9087 (1998)
- (22) M. Grimsditch, L. M. Torell, in Dynamics of Disordered Materials, Springer Proceedings in Physics 37, ed. D. Richter, A.J. Dianoux, W. Petry and J. Texeira, Springer Verlag Berlin 1989, p.196
- (23) U. Buchenau, C. Pecharroman, R. Zorn and B. Frick, Phys. Rev. Lett. 77, 659 (1995)
- (24) F. Sette, M. Krisch, C. Masciovecchio, G. Ruocco and G. Monaco, Science 280, 1550 (1998)