Strong- and weak-coupling mechanisms for pseudogap in electron-doped cuprates
Abstract
Using the two-particle self-consistent approach and cluster perturbation theory for the two-dimensional --- Hubbard model, we discuss weak- and strong-coupling mechanisms for the pseudogap observed in recent angle resolved photoemission spectroscopy on electron-doped cuprates. In the case of the strong-coupling mechanism, which is more relevant near half-filling, the pseudogap can be mainly driven by short range correlations near the Mott insulator. In the vicinity of optimal doping, where weak-coupling physics is more relevant, large antiferromagnetic correlation lengths, seen in neutron measurements, are the origin of the pseudogap. The model is not applicable in the latter case.
keywords:
Pseudogap , the Hubbard model , electron-doped cuprates , antiferromagnetic fluctuationsPACS:
74.72.-h , 71.10.Fd , 71.27.+aand
Angle resolved photoemission spectroscopy [1] (ARPES) provides deep insight into the nature of high-temperature superconductors. In particular, it has revealed the failure of Fermi liquid theory to describe single-particle excitations in these systems. Contrary to the quasiparticle concept of Fermi liquid theory, certain segments of the would-be Fermi surface are almost gapped. This is the so-called pseudogap phenomenon. In particular, recent ARPES measurements [2] on Nd2-xCexCuO4 have shown that, in contrast to the hole-doped cuprates, lightly electron-doped (e-d) ones have a large spectral weight near (). With further doping towards optimal doping, spectral weight also appears around the zone diagonals, leaving hot spots (regions with large scattering) in between () and () where the non-interacting Fermi surface intersects the antiferromagnetic (AFM) zone boundary. Theoretical explanation of these experimental data is still an open question.
In the present paper we discuss two approaches for the pseudogap in e-d cuprates: a strong and a weak-coupling one. In the case of the strong-coupling mechanism [3], which is more relevant near half-filling, the pseudogap is mainly driven by short-range correlations near the Mott insulator. In the vicinity of optimal doping, where a weak-coupling mechanism is more appropriate, large AFM correlation lengths are the origin of the pseudogap [4].
We use two different methods, the two-particle self-consistent (TPSC) approach [5, 6] and cluster perturbation theory [7] (CPT), for the single-band Hubbard model on a square lattice with a repulsive local interaction and nearest , next-nearest and third-nearest neighbour hoppings. The former method is based on a self-consistent determination of the irreducible vertices that enter dynamical susceptibilities (spin-spin and density-density). This is done by enforcing the Pauli principle, conservation laws for spin and charge fluctuations, and important sum rules. These results are then used to obtain an improved approximation for the single-particle self-energy. TPSC has been extensively checked against Quantum Monte Carlo simulations [5, 6, 8]. The CPT approach is based on exact diagonalization of finite clusters that are coupled through strong-coupling perturbation theory. The CPT results were calculated on clusters. Since TPSC is valid in the weak to intermediate coupling regime, while CPT is more reliable for intermediate to strong coupling, we can study all values of to gain insight into two mechanisms for the pseudogap in e-d cuprates.
Weak-coupling pseudogap: In the vicinity of optimal doping, the absence of zero energy excitations around () is a general result of strong-coupling calculations [3, 9] for --- and --- models. This is consistent even with weak-coupling calculations [10, 11] for the Hubbard model when the coupling is increased towards the value of the bandwidth. On the other hand, several papers [3, 4, 10, 12, 13] have shown that the spectral weight near (), as seen in experiment [2], shows up at optimal doping when the Hubbard coupling is somewhat smaller than the bandwidth. Therefore, one concludes that strong-coupling physics is not relevant for the pseudogap in e-d cuprates near optimal doping, and that a weak to intermediate coupling mechanism is appropriate. In other words, the - model does not describe the physics of e-d cuprates near optimal doping. Further evidence for this is the disappearance at of the lower Hubbard band that is present at in ARPES data [2] on Nd2-xCexCuO4. One can derive the - model from the Hubbard model only when both upper and lower Hubbard bands are well defined.
At weak coupling, large AFM correlation lengths, seen in neutron measurements [14], are the driving force for the pseudogap [4]. The physical mechanism is that electrons on a planar lattice suffer scattering by AFM fluctuations which have large phase space in two dimensions [5, 15]. Thus, those quasiparticles in regions of the Fermi surface that can be connected by the AFM vector (so called hot spots) do not survive scattering by these strong AFM fluctuations. This theory [4] explains in detail the ARPES results mentioned above, as well as the temperature dependent correlation length measured by neutron scattering [14]. Ref. [4] also makes a few predictions for ongoing experiments: (a) The ARPES pseudogap found at low temperatures should be seen even in the paramagnetic phase up to the temperature when the AFM correlation length becomes smaller than the single-particle thermal de Broglie wavelength . The corresponding pseudogap temperature is close to that found in optical experiments [16]. (b) For and for somewhat larger than , the characteristic spin fluctuation energy in neutron scattering experiments is smaller than the thermal energy (renormalized classical regime) and the spin fluctuations are overdamped near .
In the spirit of Ref. [4] we also compare the renormalized Fermi velocities at optimal doping along the - direction and along the zone diagonal with the corresponding ARPES data [17] on Nd1.85Ce0.15CuO4. Using the experimental renormalization factors and bare Fermi velocities [17], the experimental renormalized Fermi velocities are m/s and m/s along the zone diagonal and along the - direction, respectively. The corresponding renormalized Fermi velocities obtained by TPSC are m/s and m/s, respectively. The agreement is very good, particularly along the diagonal direction. The bare Fermi velocities are renormalized in TPSC by roughly a factor of two.

In Fig. 1 we present the single-particle spectral weight obtained by TPSC for filling and temperature for the same values of and band parameters as in Ref. [4]. Here, is multiplied by the Fermi-Dirac distribution function . One can see that is peaked at zero energy near () and (), and is shifted away from the Fermi energy (pseudogaped) towards higher binding energies at hot spots where the Fermi surface intersects the AFM Brillouin zone boundary. The calculated Fermi surface plot that corresponds to this case (Fig. 2(d)) shows, at hot spots, the zero energy suppression of spectral weight by AFM fluctuations. Thus, we predict that the pseudogap induced by AFM fluctuations should be experimentally seen up to electron doping, and should disappear for larger dopings [4]. Note however that doping in our calculations may be equivalent to doping in reduced samples if we take the point of view of Ref. [14] that the role of reduction can be modeled as a shift with respect to nominal Ce concentration. Then our data for the Fermi surface plot and spectral function at should be compared with the ARPES ones for reduced samples near Ce doping. The semi-quantitative agreement of Ref. [4] is preserved since Fermi surface plots and energy distribution curves for (see Figs. 1,2 of Ref. [4]) and (shown here) look similar. However, in better agreement with experiment, the theoretical pseudogap feature for doping is slightly more pronounced and extends over a broader region in space than that for doping. For comparison of our correlation lengths with neutron measurements data on doped as grown samples we should use as was done in Ref. [4]. Note however that Fig.3 of Ref. [16] may lead us to argue that doping corresponds to nominal Ce concentration only in reduced samples. The role of reduction and Ce alloying on doping remains to be clarified.
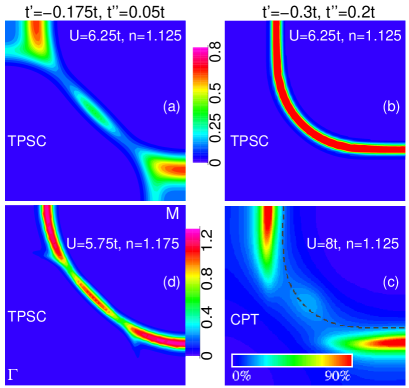
As shown in the Fermi surface plot obtained by TPSC [Fig. 2(a)], for , strong AFM fluctuations at doping cause the suppression of spectral weight not only at hot spots, but also along a large segment of the Fermi surface near . This is consistent with strong-coupling calculations [3]. The AFM correlation length is about 40 lattice spacings for this plot, which is larger than , and the spin susceptibility at is much larger than the noninteracting one. By contrast, for large values of and , one can see in Fig. 2(b) the Fermi liquid like (uniform) distribution of spectral weight in space that results from the strong suppression of AFM fluctuations by frustration. Here the AFM correlation length is about two lattice spacings, and the spin susceptibility at an incommensurate wave vector is just a few times larger than the noninteracting one. This again shows that large AFM correlation lengths are the driving force for the pseudogap in the weak-coupling case.
Strong-coupling pseudogap: An additional type of physics becomes relevant in the strong-coupling regime, which we argued is more appropriate when electron doping is decreased towards half-filling. In this limit, short range correlations are sufficient to create a pseudogap even in the absence of long AFM correlation lengths [3]. As shown in the Fermi surface plot obtained by CPT [Fig. 2(c)], for large values of and (enough to frustrate antiferromagnetism in TPSC) the pseudogap does occur at doping around the nodal direction as a result of strong coupling, whereas it is absent at weak coupling for the same values of and [see Fig. 2(b)]. We cannot rule out the existence of long AFM correlation lengths at strong coupling with CPT because the finite cluster size precludes such correlations.
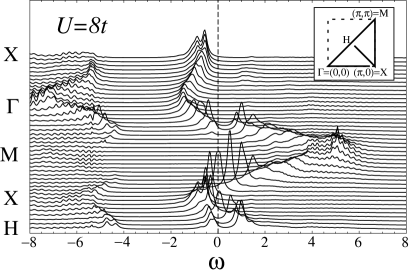
The physical mechanism for the pseudogap here is that those quasiparticles in regions of the Fermi surface that are connected to other such regions by wave vectors that have a broad spread of radius around suffer strong scattering by short range correlations [3]. Thus, the pseudogap driven by the Mott physics with short range correlations occurs around zero energy and only in these regions of the Fermi surface (hot spots). In contrast, the Mott gap occurs for all wave vectors and is not tied to zero energy. This is illustrated on Fig. 3, which shows energy dispersion curves obtained by CPT at for wave vectors along the high symmetry directions shown in the inset. The range of frequencies away from zero energy where for all wave vectors is the Mott gap. At finite electron doping it always opens up at negative energies when the Hubbard coupling is sufficiently large, and the chemical potential lies in the upper Hubbard band. The range of frequencies around zero energy where spectral weight is suppressed only for some wave vectors along -M and X-H directions is the pseudogap. This suppression of spectral weight at zero energy is also seen in the Fermi surface plot for the same parameters [Fig. 2(c)]. Note that the longer range AFM correlations, which are observed in experiment [14], would probably only reinforce the strong-coupling mechanism that already exists in the presence of short-range correlations. One may speculate that at strong coupling the condition becomes (with the lattice spacing), which is easier to satisfy. This would connect the weak and strong coupling regimes in a continuous manner.
We acknowledge useful discussions with M. Greven. The present work was supported by NSERC (Canada), FQRNT (Québec), CIAR, RQCHP, and the Tier I Canada Research Chair Program (A.-M.S.T.).
References
- [1] A. Damascelli et al., Rev. Mod. Phys. 75, 473 (2003).
- [2] N.P. Armitage et al., Phys. Rev. Lett. 87, 147003 (2001), ibid. 88, 257001 (2002).
- [3] D. Sénéchal and A.-M.S. Tremblay, Phys. Rev. Lett. 92, 126401 (2004).
- [4] B. Kyung et al., cond-mat/0312499.
- [5] Y.M. Vilk and A.M.S. Tremblay, J. Phys. I 7, 1309 (1997).
- [6] For a discussion on the method, see S. Allen et al., in Theoretical Methods for Strongly Correlated Electrons, D. Sénéchal, et al. (eds.) (Springer, New York, 2003).
- [7] D. Sénéchal et al., Phys. Rev. Lett. 84, 522 (2000); D. Sénéchal et al. Phys. Rev. B 66, 075129 (2002).
- [8] S. Moukouri et al., Phys. Rev. B 61, 7887 (2000).
- [9] T. Tohyama et al., Phys. Rev. B 64, 212505 (2001); T. Tohyama, cond-mat/0406041.
- [10] B. Kyung et al., Phys. Rev. B 68, 174502 (2003).
- [11] H. Kusunose et al., Phys. Rev. Lett. 91, 186407 (2003).
- [12] C. Kusko et al., Phys. Rev. B 66, 140513 (2002).
- [13] R.S. Markiewicz, cond-mat/0312594.
- [14] P. K. Mang et al., cond-mat/0307093.
- [15] Y. M. Vilk, Phys. Rev. B 55, 3870 (1997).
- [16] Y. Onose et al., Phys. Rev. Lett. 87, 217001 (2001).
- [17] N.P. Armitage et al., Phys. Rev. B 68, 064517 (2003).