Shear-melting of a hexagonal columnar crystal by proliferation of dislocations
Abstract
A hexagonal columnar crystal undergoes a shear-melting transition above a critical shear rate or stress. We combine the analysis of the shear-thinning regime below the melting with that of synchrotron X-ray scattering data under shear and propose the melting to be due to a proliferation of dislocations, whose density is determined by both techniques to vary as a power law of the shear rate with a exponent, as expected for a creep model of crystalline solids. Moreover, our data suggest the existence under shear of a line hexatic phase, between the columnar crystal and the liquid phase.
pacs:
83.60.Rs, 61.30.St, 61.10.Eq, 61.72.HhUnderstanding the behavior of complex fluids under flow is essential for their processing and technical use Larson . The relevance of non-linear rheology for a wide range of applications has motivated many fundamental studies, both theoretical and experimental. However, the rheology of structured fluids is not well understood yet, despite robust experimental facts such as shear-banding associated with marked modifications of the structure or texture. This very general behavior is observed in a large variety of materials including amorphous, crystalline or liquid crystalline systems. Among liquid crystals, two-dimensional (D) solids, or hexagonal columnar crystals, have been the subject of very few studies, but these materials should deserve a particular attention because of both applicative and fundamental grounds. Their close analogy, in terms of elasticity and phase diagrams, to D magnetic flux line lattices (FLL) in type II high- superconductors is appealing. On the other hand, as columnar liquid crystals are extensively used for the synthesis of mesoporous materials Mesoporous , understanding and in turn controlling their structure under flow may lead to some technological advancements.
We use synchrotron small-angle X-ray scattering (SAXS) and rheology to investigate the behavior under shear of a soft hexagonal columnar crystal, which consists of oil tubes arranged on a triangular lattice in water. Rheological experiments show a shear-induced transition between two states of markedly different viscosities. The low viscosity high shear rate structure is a D liquid of tubes, thus indicating that, above a critical shear rate or shear stress, a shear can induce the melting of the long-range D order of the tubes Melting . We exploit the analogy with FLL to derive a scenario for the melting of the soft hexagonal columnar crystal and propose the melting to be due to a proliferation of dislocations. We combine the analysis of the shear-thinning regime below the melting transition and that of the SAXS patterns under shear to extract the shear rate dependence of the density of dislocations, . Both techniques show that increases with the shear rate as a power law with the same exponent , as expected for a creep model of crystalline solids. The two independent determinations are fully consistent and hint at a dislocation-mediated melting of the hexagonal columnar crystal under shear, in noticeable analogy with theoretical predictions for FLL Corbino . Our data moreover suggest the occurrence of an intermediate hexatic phase under shear.
.
.
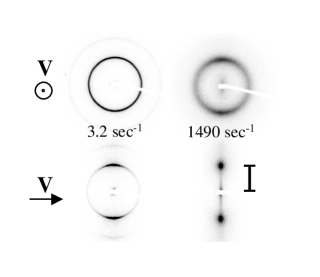
The experimental system is a lyotropic hexagonal phase consisting of infinitely long oil tubes immersed in water. The samples are composed of a quaternary mixture of sodium dodecylsulfate (SDS), pentanol, cyclohexane and brine with a NaCl concentration of . We use a composition in weight percent of SDS, brine, cyclohexane and pentanol which yields, at rest, a structure consisting of oil tubes of radius , coated with a surfactant monolayer and arranged on a triangular array with a lattice parameter Swelling . Rheology experiments are performed in a Couette geometry with a stress-controlled Paar Physica UDS 200 rheometer. The flow curve, stress vs shear rate , of a soft hexagonal columnar crystal, has been described in detail in Refs.Melting ; HexagoTcc . At low shear rates () the system behaves as a power law shear-thinning material while at high shear rates, the stress varies affinely with the shear rate. These two regimes correspond to two stable branches of stationary states, for which data obtained by imposing either or exactly superpose. The transition from the lower branch to the higher branch occurs through a stable hysteretic loop in a stress-controlled experiment. To characterize the structure of the material under flow, SAXS experiments under controlled shear rate in Couette geometry are performed on the ID-2 beamline at the ESRF, Grenoble, France ESRF . The structure of the sample in the two stable branches has been previously characterized Melting . Examples of the D patterns obtained in both tangential and radial configurations are given in Fig. 1. At low shear, the hexagonal phase exhibits a polycrystalline texture with the tubes progressively aligned along the velocity direction as increases, although a state with the tubes perfectly aligned along the flow is never reached. The angular width of the arcs (Fig. 1, bottom) is used as a measure of the alignment and indicates a sample mosaic spread, , which decreases monotonically from to when the shear rate increases from to . By contrast, at high shear rate, the long-range two-dimensional order of the tubes melts, leading to a D liquid of tubes strongly aligned along the flow (). Melting transitions under shear have been frequently observed for three dimensional colloidal crystals shearmeltingexp and are generally believed to be due to the existence of a periodic potential in the direction of flow shearmeltingtheo . Similar arguments can certainly not be invoked for a D solid, for which a crystalline array of tubes perfectly aligned along the velocity should flow at low viscosity. A novel approach is thus needed.
To better understand the physical mechanism for the shear-melting, the behavior of the material under moderate shear is analyzed within the framework of work hardening of crystalline solids. The parallel between the behavior under shear of liquid crystal phases and that of metals has been proved successful in the case of lamellar systems Kleman . In the formal theory of work hardening, the stress required to move a dislocation through a region having a density of dislocation can be derived from general dimensional arguments HardeningTheo . With the assumption that the applied stress, , is relaxed by the dislocations, should depend solely on three parameters, the density of dislocation, , the Burger vector of the dislocations, and the shear modulus of the material, . The pure number must therefore be a function of the pure number . On the other hand, the force which exerts on a unit length of a dislocation, the Peach and Koehler (PK) force, is . This force is balanced by a resisting force arising from the line tension, which is proportional to . In a stationary state, . Thus, varies linearly with and a relation between the stress and the density of dislocation follows:
| (1) |
where is a numerical factor. Equation (1) is well obeyed by crystalline solids, with the prefactor of the order of for metals HardeningExp . For hexagonal columnar phases, there are three generic types of dislocation deGennes : a screw dislocation, a (longitudinal) edge dislocation with tangent parallel to the columns dislocation and a (transverse) edge dislocation with perpendicular to the columns. The transverse edge dislocation is the most costly in energy because its creation requires the formation of two end-caps and is thus presumably very rare in soft columnar crystals. By contrast, longitudinal edge and screw dislocations do not require the creation of end-caps and are certainly more easily created; these dislocations are expected to form loops with both longitudinal edge and screw components, as also assumed in Ref.Nelson for FLL. For these two types of dislocation Nelson , the line tension is proportional to . Thus, Eq. (1) should hold and an increase of the density of dislocation with the applied stress is predicted. Moreover, whenever dislocation motion is the dominant plastic deformation mechanism, one observes a constant shear rate regime usually described by Orowan’s geometrical relation, creep , where , the average velocity of the dislocations, is proportional to the applied stress : , with a mobility. The shear rate dependence of both the stress and the density of dislocations can thus be extracted from the combination of Orowan’s relation and Eq. (1). One obtains: and . We are able to measure independently the shear rate dependences of both and . As we shall see below, we find and with , in remarkable agreement with the simple dimensional theory described above.
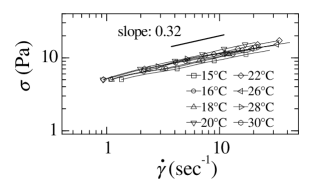
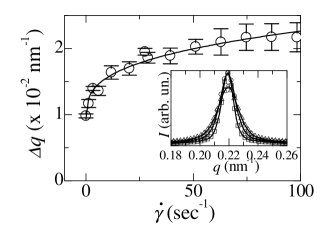
Rheology measurements give directly the shear-thinning behavior of the sample. As can be seen in Fig. 2, in a large range of temperature, from to , and over more than one order of magnitude for , we find with , which implies . The shear rate variation of the density of dislocation can be confirmed by independent measurements. Thanks to the Synchrotron high resolution, quantitative information on can indeed be obtained from the width of the diffraction peaks. The peaks are not resolution limited and the full width at half height (FWHH) of the first order diffraction peak, , increases with , while its position remains unchanged. Figure 3 shows that the FWHH ranges from at rest up to for . We note that this curve is fully reversible and in particular the zero shear value of is systematically recovered when the shear is stopped. We find that the variation of can be very well fit by the sum of a constant and a power law of the shear rate: , where the constant is related to the size of the crystallites at rest. We obtain and , with and . Finite size effects can account for the shear rate dependence broadening of the diffraction peaks. The standard Laue-Scherrer relation relates indeed the width of the Bragg peaks to , a translational correlation length: . In the case of a crystalline solid, can be identified as the average distance between dislocations notepolycrystal and thus . From the power law variation of , one predicts the density of dislocation to scale as . Remarkably, the same power law variation of the density of dislocation with the shear rate with an exponent is deduced from the SAXS data and from the rheological results, thus providing convincing support to our scenario for plastic deformation.
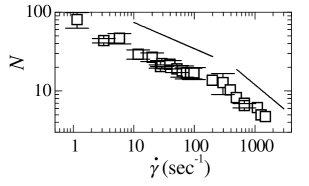
The variation of , the translational correlation length (normalized by the lattice parameter ), with the shear rate, below and above the melting transition, are reported in Fig. 4. A continuous decrease of with , from to , is measured. Our results clearly show two regimes characterized on a log-log plot by a change of slope at the shear rate . The slope is equal to below and crosses over a more abrupt variation, where a slope of is measured. Although the cross-over at the melting transition is smooth, it is associated with a dramatic drop of viscosity and signs unambiguously the melting transition. At , temperature at which the SAXS experiments are performed, both the rheology and the SAXS experiments show that the shear melting occurs for . It is associated with a critical normalized correlation length (Fig. 4), which is interestingly of the same order of magnitude as the correlation length measured at the melting of a D colloidal crystal 2Dcolloids . Additionally, for , which are presumably the most frequent dislocations, the numerical prefactor in Eq. (1) is equal to , where (inset Fig. 1) is the critical stress at the melting transition and is the shear modulus previously measured modulus . One thus obtains , in excellent agreement with the value experimentally found for metals HardeningExp .
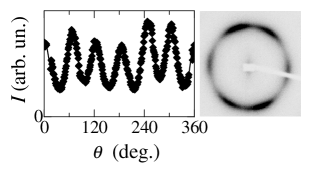
Both the shear thinning regime and the SAXS scattering data can be quantitatively and consistently interpreted as resulting from an increase of the density of dislocations with the shear rate. We therefore propose the shear melting be due to a proliferation of dislocations. Our out-of-equilibrium results are in remarkable analogy with the shear melting of FLL Corbino , theoretically addressed when the shear is perpendicular to the flux lines. In our case, however, the shear is oblique to the tubes; the non trivial coupling between the gradual alignment of the tubes and the increase of the density of dislocation with the shear remains an open issue. Our experimental results compare also naturally with those for the well documented melting of D solids 2Dmelting . However, because scattering experiments do not provide direct imaging, no information about the spatial distribution of the dislocations can be accessed, but only their average density can be extracted from the data. As opposed to D solids, where direct imaging is possible 2Dcolloids ; 2Dobservations , it is therefore delicate for hexagonal columnar crystals to unambiguously characterize the melting transition, and determine whether it is a one-stage first order transition or a two-stage transition with an intermediate line hexatic phase. Our data tend nevertheless to support the latter scenario. Indeed, fig. 5 shows the D pattern, obtained in tangential configuration for , that is above the melting transition. The pronounced six-fold angular modulation observed on this pattern is a signature of a line hexatic phase. Line hexatic phases have been predicted Nelson ; hexatictheory and only very recently observed by scattering techniques linehexatic ; FLL . Interestingly, our experimental results also suggest the existence under shear of an intermediate line hexatic phase, between the columnar crystal and the liquid phase.
To conclude, we have shown that a mechanism of proliferation of dislocations can qualitatively account for the melting of a hexagonal columnar crystal under shear, which presumably occurs through a two-step process with an intermediate line hexatic phase. Our experimental results compare well with the shear-melting of FLL and provide an original illustration of the deep analogy between magnetic flux line lattices and columnar liquid crystals. Recent developments in the simulations of dislocation motions should render possible a numerical test of our main findings and should provide decisive information about the spatial organization of the dislocations in a steady-state regime.
The ESRF is acknowledged for financial support and provision of synchrotron beam time and V. Urban for technical assistance during the SAXS experiments. We thank M. Kléman, M. Carmen-Miguel, D. Lu and P. Olmsted for discussions, G. Porte for a critical reading of the manuscript and one of the referee for pointing out Ref. Corbino to us.
References
- (1) R. G. Larson, The Structure and Rheology of Complex Fluids (Oxford University Press, New-York, 1999).
- (2) D. Zhao et al., Science 279, 548 (1998) and refs. therein.
- (3) L. Ramos, F. Molino and G. Porte, Langmuir 16, 5846 (2000).
- (4) P. Benetatos and M. C. Marchetti, Phys. Rev. B 65, 134517 (2002).
- (5) L. Ramos and P. Fabre, Langmuir 13, 682 (1997).
- (6) L. Ramos, Phys. Rev. E 64, 061502 (2001).
- (7) The scattered intensity induced by a X-ray beam of wavelength was recorded at from the sample using a D gas-filled multiwire detector. Instrumental resolution is . More technical information on the experimental set-up can be found on the ESRF web site .
- (8) B. J. Ackerson and N. A. Clark, Phys. Rev. Lett. 46, 123 (1981); U. Olsson and K. Mortensen, J. Phys. II 5, 789 (1995).
- (9) M. J. Stevens and M. O. Robbins, Phys. Rev. E 48, 3778 (1993).
- (10) C. Meyer, S. Asnacios and M. Kléman, Eur. Phys. J. E 6, 245 (2001).
- (11) F. R. N. Nabarro, Z. S. Basinski and D. B. Holt, Adv. Phys. 13, 193 (1964).
- (12) S. J. Basinski and Z. S. Basinski, in Dislocations in Solids, edited by F. R. N. Nabarro (North-Holland, New-York, 1979), Vol. 4.
- (13) P.-G. de Gennes and J. Prost, The Physics of Liquid Crystals (Clarendon, Oxford, 1993).
- (14) M. C. Marchetti and D. R. Nelson, Phys. Rev. B 41, 1910 (1990).
- (15) J.-P. Poirier, Creep of Crystals (Cambridge University Press, Cambridge, 1985).
- (16) this is in principle true for a monodomain; the extension to polydomain has to be taken with caution.
- (17) C. A. Murray and D. H. van Winkle, Phys. Rev. Lett. 58, 1200 (1987).
- (18) L. Ramos and F. Molino, Europhys. Lett. 51, 320 (2000).
- (19) J. M. Kosterlitz and D. J. Thouless, J. Phys. C 6, 1181 (1973); B. I. Halperin and D. R. Nelson, Phys. Rev. Lett. 41,121 (1978); A. P. Young, Phys. Rev. B 19, 1855 (1979); D. S. Fisher, Phys. Rev. B 22, 1190 (1980).
- (20) R. Seshadri and R. M. Westervelt, Phys. Rev. Lett. 66, 2774 (1991); R. E. Kusner et al., Phys. Rev. Lett. 73, 3113 (1994); A. H. Marcus and S. A. Rice, Phys. Rev. Lett. 77, 2577 (1996); K. Zahn, R. Lenke and G. Maret, Phys. Rev. Lett. 82, 2721 (1999).
- (21) J. Toner, Phys. Rev. A 27, 1157 (1983).
- (22) H. H. Strey et al., Phys. Rev. Lett. 84, 3105 (2000).
- (23) P. L. Gammel et al., Phys. Rev. Lett. 80, 833 (1998).