Present address: ]Los Alamos National Laboratory, Los Alamos, NM 87545, USA
Present address: ]Department of Physics and Astronomy, University of British Columbia, Vancouver, B.C., Canada, V6T 1Z1
Present address: ]Department of Physics and Astronomy, University of California, Los Angeles, Los Angeles, CA 90095, USA
Missing Quasiparticles and the Chemical Potential Puzzle in the Doping Evolution of the Cuprate Superconductors
Abstract
The evolution of Ca2-xNaxCuO2Cl2 from Mott insulator to superconductor was studied using angle-resolved photoemission spectroscopy. By measuring both the excitations near the Fermi energy as well as non-bonding states, we tracked the doping dependence of the electronic structure and the chemical potential with unprecedented precision. Our work reveals failures in the conventional quasiparticle theory, including the broad lineshapes of the insulator and the apparently paradoxical shift of the chemical potential within the Mott gap. To resolve this, we develop a model where the quasiparticle is vanishingly small at half filling and grows upon doping, allowing us to unify properties such as the dispersion and Fermi wavevector with the behavior of the chemical potential.
pacs:
74.20.Rp, 74.25.Jb, 74.72.-h, 79.60.-iA central intellectual issue in the field of high-temperature superconductivity is how an antiferromagnetic insulator evolves into a superconductor. In principle, the ideal tool to address this problem is angle-resolved photoemission spectroscopy (ARPES), which can directly extract the single-particle excitations. Despite the interest in this doping induced crossover, there continues to be a lack of experimental consensus, perhaps the most prominent example being the controversy over the chemical potential, . Over the past fifteen years, there have been conflicting claims of either being pinned in mid-gap or shifting to the valence / conduction band upon carrier doping Damascelli03 ; Allen90 ; Shen91 ; Ino97 ; Steeneken03 ; Ronning03NaCCOC . The inability of photoemission spectroscopy to provide a logically consistent understanding of this fundamental thermodynamic quantity has been a dramatic shortcoming in the field.
In this paper, we present a new procedure to quantify with unprecedented precision by ARPES, while allowing simultaneous high resolution measurements on the low energy states. These measurements allow us to make major conceptual advances in addressing the doping evolution. We find that the long standing confusion over stems from the manner in which quasiparticle-like (QP) excitations in the doped samples emerge from the unusually broad features in the undoped insulator. Our work reveals inconsistencies in the conventional framework that considers the main peak in the insulator spectrum to represent the QP pole. On the one hand, we find that changes in a manner consistent with an approximate rigid band shift; on the other hand, this shift appears to occur within the apparent Mott gap of the parent insulator. We show that this ostensible paradox can be naturally explained if one uses a model based on Franck-Condon-like broadening (FCB) where the quasiparticle residue, , is vanishingly small near half filling. This also reconciles existing puzzles regarding the insulator and the lightly doped compounds, and naturally ties the behavior of to low energy features such as the Fermi wavevector, , and the quasiparticle velocity .
Ca2-xNaxCuO2Cl2 is an ideal system to address the doping evolution of the cuprates. The stoichiometric parent compound, Ca2CuO2Cl2, is chemically stable and, along with its close variants, has served as the prototype for the undoped Mott insulator Damascelli03 ; Wells95 . Moreover, the system possesses a simple structure, with only a single CuO2 layer devoid of known superlattice modulations, structural distortions, or surface states, unlike the Bi-based cuprates, La2-xSrxCuO4, or YBa2Cu3O7-δ. The x = 0.10 and 0.12 samples had Tc’s of 13 and 22 K, respectively (T K), while the x = 0.05 composition was non-superconducting, and were grown using a high pressure flux method KohsakaGrowth02 . ARPES measurements were performed at Beamline 5-4 of the Stanford Synchrotron Radiation Laboratory with typical energy and angular resolutions of 13 meV and 0.3∘, respectively, using photon energies of 21.2 and 25.5 eV. Measurements were performed at 15 K, except for x = 0, which was measured at T 180 K.
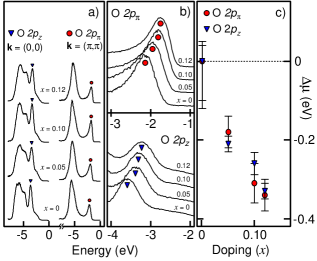
Previous quantitative studies of have relied on core level spectroscopy. However, the precision of this method is limited and its interpretation can be very complicated. Since measuring is of paramount importance, we introduce a new approach which we believe to be more accurate and direct, and can be performed in parallel with ARPES on the near-EF states. Our method utilizes delocalized, non-bonding O states in the valence band, in particular, O at (0,0) and O at shown in Figure 1a. These were identified in earlier works and have no overlap with the Cu orbital or Zhang-Rice singlet Pothuizen97 ; Hayn99 . Because these well-defined peaks are relatively close to EF and measured at a single wavevector, we can treat these states as delocalized bands. The overall shape of the valence band remains unchanged with doping, suggesting a rigid band shift on a gross scale ( eV). In Figures 1b and 1c, we show the shift of the O and O peaks on an expanded scale with statistics collected from samples for each concentration. All data are referenced to the x = 0 composition, and we describe the methodology for determining later in the text. The shift from these marker states yields eV, eV, and eV, all relative to , with a typical uncertainty of eV. At finite x, eV / hole, comparable to band structure ( 1.3 eV / hole) Mattheiss90 .
These measurements reveal a fundamental failure of the traditional framework where the main peak of the insulator represents a quasiparticle pole, which we call the “coherent quasiparticle scenario” (CQS). Here, all energies above the peak maximum should fall within the Mott gap. As shown in Figure 1, shifts by an amount compatible with predictions from band structure calculations. However, this shift appears to occur within the apparent Mott gap of the parent insulator - a logical inconsistency as there are no available states within the gap to shift into, as illustrated at the left of Figure 2a. While impurity-like states may form within the gap, in this picture should not drop so rapidly with doping. In the remainder of this paper, we combine the measurements of with high resolution studies of the near-EF states. Our results suggest a model which borrows heavily from the concept of FCB, shown at the right of Figure 2a.
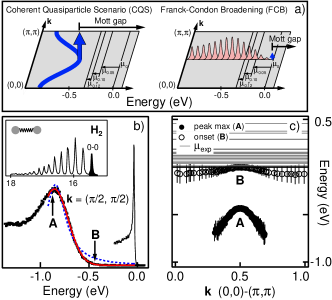
To understand the failings of the CQS, the obvious starting point is the parent antiferromagnetic insulator. Early studies of Ca2CuO2Cl2 and Sr2CuO2Cl2 yielded broad peaks which exhibited a dispersion consistent with calculations for the extended model Wells95 ; Tohyama00 ; Damascelli03 . These peaks were effectively interpreted as quasiparticle poles, in the context of the CQS. However, one crucial point that remained unresolved was the extreme width of these excitations. We address this as a critical weakness of the CQS, and use this as a starting point for constructing a new model. Understanding this lineshape is crucial, since many celebrated features such as the -wave gap, the superconducting peak, dispersion anomalies, and the pseudogap Damascelli03 , necessarily emerge from this starting point. Data taken at the top of the lower Hubbard band, , is shown in Figure 2b. In the CQS, one would expect the peak width, , to be extremely narrow at the top of the band due to phase space constraints, analogous to excitations at the Fermi energy in a metal. Instead, is comparable to the entire bandwidth meV, completely inconsistent with such a picture. Moreover, the width cannot be due to disorder, as the undoped system is stoichiometric, and adding chemical dopants results in sharper structures, as will be shown. For comparison, we also present spectra from Sr2RuO4 (thin black) exhibiting a nearly resolution-limited peak. Given that well-defined QP excitations can be observed by ARPES, we must confront the origin of the broad peaks in Ca2CuO2Cl2. Moreover, in the CQS, the peak in Figure 2b should be well described by a spectral function , which should be approximately Lorentzian with a width dominated by an impurity scattering term, Damascelli03 . A fit of to the experimental data is shown and agrees poorly; to achieve even this, was assumed to be unphysically large ( 300 meV), given that the material is stoichiometric and free of chemical dopants.
In light of this failure of the CQS, we believe that an analogy to one of the simplest quantum systems, the H2 molecule, may be enlightening. The H H photoemission spectrum, shown in the upper inset of Figure 2b, exhibits FCB. Only the ‘0-0’ peak (filled black) represents the H final state with no excited vibrations and comprises only 10% of the intensity, while transitions to excited states with = 1, 2, 3, and 4 vibrational quanta possess higher intensities than 0-0. In the solid state, 0-0 alone would represent the QP or the coherent part of the spectral function, , whereas the excited states comprise the incoherent part, . This behavior is redolent of polarons, and such models have been suggested in systems where strong couplings are present Dessau98 ; Perebeinos00 ; Perfetti02 . The low energy tail is suppressed exponentially, inconsistent with power law falloffs from spectral functions, but well-described by a Gaussian FCB envelope.
Another unresolved issue is a large energy scale separating the peak from the experimental positions of inside the Mott gap. For an insulator, is not well defined, and is pinned by surface defects and impurities and will vary between samples. However, the limits of this distribution are well defined, with a lower bound set by the QP pole at the top of the valence band. For this study, we identify two features : the peak maximum (A), and the onset of intensity (B), where B is determined from the first statistically significant signal above background (). In Figure 2c, we show the dispersion of A and B along (0,0)-(). While A qualitatively tracks the dispersion of the model, B disperses only weakly and has a large separation of meV from A. We present the distribution of from a large number of samples in Figure 2c and B clearly sets a lower bound for the distribution of . This behavior suggests FCB where the true QP (B) is hidden within the tail of spectral intensity, and A is simply incoherent weight associated with shake-off excitations. For x = 0, we reference A and the valence band features such that B is aligned to 0, and this is consistent with the lowest measured value for . This demarcates the upper bound for both the QP at half filling and , not the actual position of for x = 0, and provides us with the value for which we have used throughout the paper. This model is also consistent with the temperature dependence of the lineshape, where a similar multiple initial/final state model was proposed Kim02 . At this stage, we cannot distinguish which interactions are causing this broadening. Although numerical simulations of the model predict that remains finite () Dagotto94 , some analytical calculations have predicted that interactions with the antiferromagnetic background cause Shraiman88 ; Sheng96 . Another possibility is the coupling to the lattice, and our data bears some resemblance to that of lattice polaronic systems (1D Peierls, manganites) Perfetti02 ; Dessau98 ; Perebeinos00 . We note that a recent calculation incorporating lattice effects in the model has closely reproduced the ARPES spectra, including a vanishing QP peak (B) and a broad hump (A) which recovers the original dispersion Mishchenko04 .
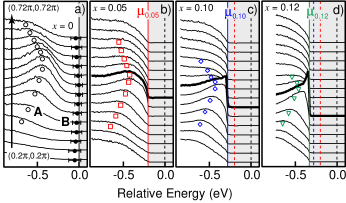
In Figure 3, we show the doping evolution of the near-EF energy distribution curves (EDCs), from () to (). All data are plotted on a fixed energy scale relative to using the values determined in Figure 1c. With doping, feature A evolves smoothly into a broad, high energy hump with a backfolded dispersion that qualitatively reflects the parent insulator (symbols), while shifts from B into the lower Hubbard band. It is now clear that does not fall immediately to A upon hole doping as expected in the CQS. Spectral weight develops at , and a well-defined peak becomes visible for the x = 0.10 and 0.12 compositions, comprising a coherent, low-energy band. The dispersion of the hump is summarized in Figure 4a, and was determined by tracking local maxima in the EDCs; where the hump becomes less distinct, we also use the second derivative of the EDCs. We note that in our model, A no longer represents any precise physical quantity. We also track the dispersion of the lowest energy excitations (-0.05 eV EF) from a momentum distribution curve (MDC) analysis (lines). The collective behavior of the data reveals that A is roughly fixed at high energies (-450 meV) with doping, justifying our FCB model which, in some sense, decouples A from . The dispersion of the low-energy states reveals a remarkable universal behavior across doping levels where both the velocities of the QP dispersion () and Fermi wavevectors () virtually collapse onto a single straight line with a band velocity (1.8 eVÅ) corresponding closely to the recently discovered “universal nodal velocity” Zhou03 . This result also ties the chemical potential to the QP dispersion to naturally explain how evolves with doping, by simply sliding down the true QP band and calculating , as shown in Figure 4a. We note that a number of different theoretical proposals have predicted the emergence of sharp QP-like excitations from broad features, including dynamical mean-field theories Georges96 or “gossamer” superconductivity Bernevig03 .
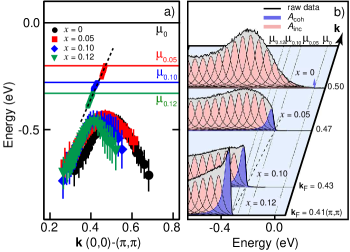
A schematic cartoon overlaid on experimental data is shown in Figure 4b, illustrating the doping dependence of and the proposed transfer between coherent (blue) and incoherent (pink) spectral weight. This also explains the lack of any well-defined peak at for x = 0.05, expected in Fermi liquid models, which can be naturally explained by the vast incoherent weight overwhelming any small coherent peak. This also clarifies whether in-gap states or a rigid band shift was the correct description of the doping evolution, and it is now evident that neither are adequate in the FCB context. A similar emergence of QP excitations at low dopings was also observed in La2-xSrxCuO4 Yoshida03 , although one distinction between Ca2-xNaxCuO2Cl2 and La2-xSrxCuO4 is the relative separation between A and EF Damascelli03 .
In conclusion, we have developed a phenomenological model based on high precision measurements of and detailed studies of the near-EF states, providing us with the first globally consistent understanding of the doping evolution of the cuprates. This picture can be summarized as follows : i) At half filling, is vanishingly small in a manner reminiscent of Franck-Condon broadening. The true QP is found in the tail of spectral intensity, approximately 450 meV above the peak position. ii) The previous misidentification of the peak maximum as the QP pole was at the root of the long standing confusion over . iii) With doping, spectral weight is transferred to the low-energy QP-like peak. iv) The shift of the chemical potential and is dictated by the band velocity of this faint QP band. We believe that the above picture provides a foundation for the origin of the quasiparticles upon doping and should be used as a guide to develop microscopic theories for high-Tc superconductivity.
We would like to thank A. Fujimori and C. Kim for enlightening discussions. SSRL is operated by the DOE Office of Basic Energy Science under contract DE-AC03-765F00515. K.M.S. acknowledges SGF and NSERC for their support. The ARPES measurements at Stanford were also supported by NSF DMR-0304981 and ONR N00014-98-1-0195.
References
- (1)
- (2) A. Damascelli, Z. Hussain, Z.-X. Shen, Rev. Mod. Phys. 75, 473 (2003).
- (3) J. W. Allen et al., Phys. Rev. Lett. 64, 595 (1990).
- (4) Z.-X. Shen et al., Phys. Rev. B 44, 12098 (1991).
- (5) A. Ino et al., Phys. Rev. Lett. 79, 2101 (1997).
- (6) P. G. Steeneken et al., Phys. Rev. Lett. 90, 247005 (2003).
- (7) F. Ronning et al., Phys. Rev. B 67, 165101 (2003).
- (8) Y. Kohsaka et al., J. Am. Chem. Soc. 124, 12275 (2002).
- (9) B. O. Wells et al., Phys. Rev. Lett. 74, 964 (1995).
- (10) J. J. M. Pothuizen et al., Phys. Rev. Lett. 78, 717 (1997).
- (11) R. Hayn et al., Phys. Rev. B 60, 645 (1999).
- (12) L. F. Mattheiss, Phys. Rev. B 42, 354 (1990).
- (13) T. Tohyama, S. Maekawa, Supercond. Sci. Technol. 13, R17 (2000)
- (14) D. W. Turner, Molecular Photoelectron Spectroscopy (Wiley, New York, 1970).
- (15) L. Perfetti et al., Phys. Rev. B 66, 075107 (2002).
- (16) D. S. Dessau et al., Phys. Rev. Lett. 81, 192 (1998).
- (17) V. Perebeinos, P. B. Allen, Phys. Rev. Lett. 85, 5178 (2000).
- (18) C. Kim et al., Phys. Rev. B 65, 174516 (2002).
- (19) E. Dagotto, Rev. Mod. Phys. 66, 763 (1994).
- (20) B. I. Shraiman, E. D. Siggia, Phys. Rev. Lett. 61, 467 (1988).
- (21) D. N. Sheng, Y. C. Chen, Z. Y. Weng, Phys. Rev. Lett. 77, 5102 (1996).
- (22) A. S. Mishchenko, N. Nagaosa, cond-mat/0403751(2004).
- (23) X. J. Zhou et al., Nature 423, 398 (2003).
- (24) A. Georges et al., Rev. Mod. Phys. 68, 13 (1996).
- (25) B. A. Bernevig, R. B. Laughlin, D. I. Santiago, Phys. Rev. Lett. 91, 147003 (2003).
- (26) T. Yoshida et al., Phys. Rev. Lett. 91, 027001 (2003).