ISOCAM observations in the Lockman Hole - I††thanks: Based on observations with ISO and Isaac Newton Telescope (INT). ISO is an European Space Agency (ESA) project with instruments funded by ESA Member States (especially the P.I. countries: France, Germany, the Netherlands and the United Kingdom) with the participation of the Institute of Space and Astronautical Science (ISAS) and the National Aeronautics and Space Administration (NASA). INT is operated on the island of La Palma by the Isaac Newton Group in the Spanish Observatorio del Roque de los Muchachos of the Instituto de Astrofisica de Canarias.
We present the image and catalogue of the 14.3 m shallow survey of 0.55 square degrees in the region of the Lockman Hole (10h52m03s57o21′46′′, J2000) with the Infrared Space Observatory (ISO). The data have been analyzed with the recent algorithm by Lari et al. (2001) conceived to exploit ISO data in an optimal way, especially in the case of shallow surveys with low redundancy. Photometry has been accurately evaluated through extensive simulations and also the absolute calibration has been checked using a set of 21 stars detected at 14.3 m, optical, and near-IR bands. On the basis of simulations, we evaluate that the survey is 80%, 50%, and 20% complete at 0.8, 0.6, and 0.45 mJy, respectively. Below the 20% completeness limit, fluxes are generally overestimated since the sources are preferentially detected if their positions correspond to positive oscillations of the noise. Moreover, from a comparison with the deep survey, we estimate that only sources brighter than 0.45 mJy are highly reliable. Only 5% of these sources do not have optical counterparts down to r’=25. Since none of the Spitzer imaging bands cover the 14.3 m wavelength range, this data set will remain unique until the advent of the James Webb Space Telescope.
Key Words.:
infrared:galaxies - surveys - catalogs1 Introduction
It is now widely accepted that a global vision of the universe can be achieved only by complementing the ground-based optical observations with satellite observations in wavelength domains unreachable from the ground. While violent phenomena like quasars and other active galactic nuclei dominate the short wavelength extra-galactic emission (X-ray and gamma), a large part of the star formation is obscured by dust which reprocesses the UV-optical emission into infrared radiation. So, the star formation activity in dusty regions can be only observed indirectly through the emission of the dust in the infrared or the synchrotron emission of electrons accelerated by supernovae explosions in the radio. The Infrared Astronomical Satellite (IRAS) in the local universe (Soifer, Houck, & Neugebauer 1987) and subsequently the Cosmic Background Explorer (COBE) with the discovery of the cosmic infrared background (Puget et al. 1996, Fixsen et al. 1998, Hauser et al. 1998) have dramatically shown that a large part of the bolometric luminosity of the galaxies is emitted in the infrared. In particular, the emission of the cosmic infrared background which peaks at 140 m represents more than half of the overall cosmic background (Gispert, Lagache & Puget 2000) while approximately one-third of the bolometric luminosity of local galaxies () is processed by dust into the infrared (Soifer & Neugebauer 1991). This implies that the universe at is even more active in the infrared than the local one shown by IRAS.
For these reasons, part of the guaranteed time of the mid-IR camera ISOCAM (Cesarsky et al. 1996) was devoted to survey sky regions known to have very low neutral Hydrogen (HI) absorption to explore the deep universe without any interference from our own galaxy. The primary goal of these ISOCAM guaranteed time extra-galactic surveys (IGTES, PI: Cesarsky) was to establish source counts in the mid-IR over two orders of magnitude in flux (Elbaz et al. 1999). The largest field surveyed during this program, already observed by the Röntgen Satellite (ROSAT, Hasinger et al. 1993), is known as Lockman Hole since Lockman et al. (1986) pointed out the existence of this exceptionally low HI absorption region. In the ISO data base, these surveys have been complemented on the deep side by the surveys on the Hubble Deep Field North (Serjeant et al. 1997), the Hubble Deep Field South (Oliver et al. 2002), the Canada-France Redshift Survey (Flores et al. 1999), and by the lensed survey of Metcalfe et al. (2003), and on the shallow side by the European Large Area Infrared Survey (ELAIS, Oliver et al. 2000).
If we consider the typical spectral energy distribution (SED) of a star-forming galaxy (see e.g. Laurent et al. 2000), the presence of PAH features makes it easily detectable by means of the LW3 band (centered at 14.3 m) of ISOCAM up to a redshift of 1.5. In this redshift range the ISOCAM data are, in terms of star formation, deeper than the deepest radio surveys (see discussion in Elbaz et al. 2002). Several studies of optical spectra of local and high-z galaxies (Poggianti & Wu 2000, Poggianti, Bressan & Franceschini 2001, Rigopoulou et al. 2000), found that more than 70% of the energy emitted by young stars and reprocessed in the far-IR leaves no traces in the optical spectra (also after correcting for extinction). Even if a very refined extinction correction using Hydrogen Balmer line ratios could provide a correct estimate of the global star formation (Flores et al. 2004), it would be impossible to compute that for any redshift since only a few windows in the near-IR are accessible from the ground.

As shown in Figure 1, this band is essential to distinguish between different types of starburst SEDs in the redshift range , since most of the prominent mid-IR features (due to Polycyclic Aromatic Hydrocarbons, PAH) lie in the wavelength range covered by the LW3 band. Even with the recently launched infrared observatory Spitzer (Werner et al. 2004), the only possibility to obtain images in this wavelength range is by using the peak-up camera of the spectrograph with the blue filter (13.-18.5 m) as an imager, but its field of view is very small (80′′56′′). The next space observatory able to observe in this wavelength region will be the James Webb Space Telescope with its mid-IR camera111http://ircamera.as.arizona.edu/MIRI/miriscience.pdf. Therefore, this set of data will be extremely useful for the foreseeable future.
In this paper we present the 14.3 m image, catalogue and identification of optical counterparts of the shallow ISOCAM survey in the Lockman Hole. The survey consists of 4 raster scans which slightly overlap to cover 0.55 sq. degrees of sky for a total of 55 ksec observing time with the mid-infrared camera ISOCAM. The extension and depth of this survey is intermediate between the deep ISOCAM surveys (see e.g. Elbaz et al. 1999) and the shallow and extended ELAIS survey (Oliver et al. 2000). This allows us to obtain a sample of distant mid-infrared sources that is large enough to study the deep universe without being biased by large scale structures. Moreover, the range of fluxes which is spanned by these observations (0.5 - 4 mJy) covers the slope change in the 14.3 m counts discovered by Elbaz et al. (1999). The sensitivity is limited by the low redundancy of the survey, which is a necessary compromise in order to survey large regions of sky.
Section 2 gives a summary of the ISOCAM observations and of the optical follow-up of bright stars in the field for absolute calibration purposes. Section 3 describes the method used and outlines the passages of the reduction and source extraction. The absolute photometric calibration is also derived through a sample of stars observed in optical, near-IR and 14.3 m. Section 4 discusses the accuracy of astrometry and photometry, as well as the completeness of the survey, on the basis of simulations. Section 5 describes the identification of optical counterparts of the 14 m sources and the catalogue is presented in Section 6.
In a companion paper (Rodighiero et al. 2004), we present the analysis and catalogue of the 6.75 m and 14.3 m deep surveys in the central region of the Lockman Hole and the 14.3 m counts of the two surveys combined.
2 Observations
2.1 Infrared data
| Parameter | Value |
|---|---|
| Band effective wavelength | 14.3 m |
| Band width | 6 m |
| Detector gain | 2 e-/ADU |
| Integration time | 5.04 s |
| Nr. of exposures per pointing | 11 |
| Nr. of stabilisation exposures | 115 |
| Pixel field of view | 6′′ |
| Nr. of horizontal and vertical steps | 24 8 |
| Step sizes | 54′′, 168′′ |
| Nr. of raster maps | 4 |
| Total area covered | 0.55 deg2 |
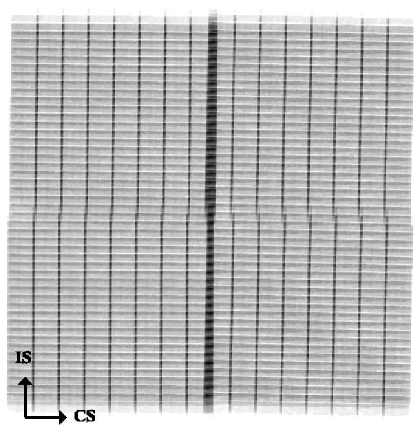
The data presented here correspond to the observations made during orbits nr. 201 and 202 by ISOCAM in the direction of the Lockman Hole, an area of the sky with low HI density: (Lockman et al. 1986). ISOCAM spent a total exposure time of 55 ksec observing a field centered in 10h52m03s57o21′46′′, J2000. Each of the four pointings which roughly cover a quarter of the total field (observations nr. 20100901, 20101502, 20201003 and 20201104) correspond to a raster scan of sub-pointings, with a mean number of 11 readouts of 5 seconds of exposure time. The four rasters slightly overlap to cover the field without gaps and obtain uniform coverage (see Figure 2). The mean covering factor of the observation is 3.4, since the detector - an array of 32 32 pixels - was displaced by 9 and 28 pixels along and across the scan directions, respectively. The choice of a 6” pixel size is a compromise between angular resolution and optimal signal-to-noise ratio (SNR) for the detection of faint sources. The observation parameters are summarized in Table 1.
The same area has been also covered by other ISO observations: 90 m and 160 m observations (Kawara et al. 1998, Rodighiero et al. 2003) and deep 14.3 m and 6.75 m observations in the central region (Rodighiero et al. , 2004). Two Spitzer programs (SWIRE, Lonsdale et al. 2003, and guaranteed time observations, P.I.: G. Rieke) have recently reobserved this region in all the Spitzer imaging bands.
2.2 Ancillary data
Several optical and near-IR images have been taken to support the ISOCAM observations. In this paper we make use of a r’ image taken with the 2.5m Isaac Newton Telescope (INT) at La Palma which covers the entire shallow survey. This image, along with other images in four optical bands covering the center of this field, will be presented in more detail in a forthcoming paper (Fadda, 2004).
Moreover, to check the absolute calibration of the source fluxes in the survey, the central field has been observed in the U, B, g’, r’ and i’ bands with short exposures using the INT Wide Field Camera (WFC) during the nights of January 23, 2003 and March 27, 2003. Using the 2MASS observations of the Lockman Hole (Beichman et al. , 2003), we gathered a sample of 21 stars emitting at 14.3 m with J, H, Ks and U, B, g’, r’, i’ magnitudes to compute expected 14.3 m fluxes. The bright stars, for which the 2MASS fluxes are more uncertain, have been observed in the J, H and Ks bands with the 1.5 m “Carlos Sanchez” infrared telescope in Tenerife during the nights of February 15 and 16, 2001. These data have been reduced using IRAF222IRAF, Image Reduction and Analysis Facility, is distributed by the National Optical Astronomy Observatory, which is operated by the Association of Universities for Research in Astronomy, Inc., under a cooperative agreement with the National Science Foundation packages. In particular, the WFC data have been reduced using the mscred package developed for the analysis of mosaic camera data and taking into account the information contained in the web page of the INT Wide Field Survey 333www.ast.cam.ac.uk/ wfcsur/index.php.
3 Data reduction
3.1 The method
The impacts of cosmic rays on the ISOCAM detector have dramatic effects on the pixel signals and make very difficult the detection of faint sources. When a cosmic ray hits the detector a glitch appears in the signal which, depending on the energy of the hitting particle, could decay in a few readouts or perturbate in a more serious way the signal up to several hundred readouts.
Detecting and correcting the pixel signals for the effects of these cosmic rays is the main goal of the methods developed for the extraction of faint sources from ISOCAM data.
The triple-beam technique by Désert et al. (1999) simply detects and masks the regions affected by this transient behavior. The Pattern Recognition Technique for ISOCAM data (PRETI) by Starck et al. (1999) decomposes the signal at different time scales and models the parts of the signal below and over the median level. Then, it recognizes patterns which are similar to sources and subtract the other parts from the original signal.
The method by Lari et al. (2001) is the first which attempts to model the signal using some physical hypothesis. It assumes that each pixel has two charge reservoirs evolving independently with two different time constants. Glitches due to cosmic ray impacts are treated like discontinuities in the charges. The signal observed is described by the equations:
| (1) | |||||
| (2) |
where is the incident flux of photons, the dark current, the accumulated charges. and , parameters describing the efficiency of the accumulation of charges and the time constant, are estimated through a fit to the data.
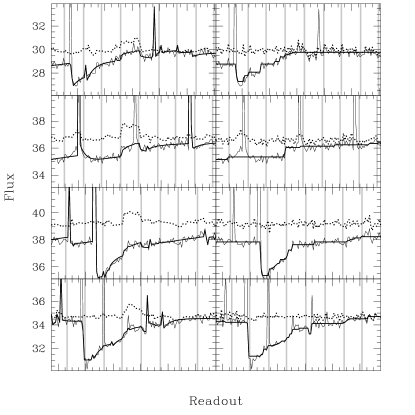
This model works remarkably well (see examples in Lari et al. 2001) allowing us to exploit in the best way the ISOCAM data. While the triple-beam method simply does not consider the data affected by transients losing the information contained in these readouts, the non-parametric corrections done with PRETI can be sometimes dangerous. PRETI in fact does not consider the short glitches which are smoothed before starting the analysis. The multiscale transform is able to compute a background (large scale) and detect positive and negative patterns in the signal. The negative patterns are considered as negative tails after cosmic ray impacts. The positive patterns are classified as sources or positive tails after cosmic ray impacts. This classification is based on the temporal size of the pattern and on its shape. Unfortunately, sometimes a positive tail is confused with a source or, due to a bad evaluation of the local background, a positive pattern can arise between two strong consecutive negative tails (see also discussion in Fadda et al. 2000). On the other hand, a source in a negative tail will be not considered if it lies under the local estimated background (see examples in Figure 3).
These effects become important for faint sources, especially in the case of data with low redundancy, such as the shallow survey in the Lockman Hole or the ELAIS surveys (see e.g. Lari et al. 2001, Gruppioni et al. 2002).
In conclusion, although the PRETI and the triple beam technique have been successfully applied to data with high redundancy as, for instance, the Hubble Deep Field North (Aussel et al. 1999, Désert et al. 1999), our interactive analysis greatly improve the completeness and reliability of faint sources in the case of low-redundancy data.
3.2 Reduction pipeline
The CIA444CAM interactive analysis, developed by the ESA Astrophysics Division and the ISOCAM Consortium. The ISOCAM Consortium is led by the ISOCAM PI, C. Cesarsky. package (Ott et al. 2001 ) was used to build the raster structure from raw data and to subtract the dark current from the data. The codes for data reduction with the method by Lari et al. (2001) are written in the Interactive Data Language (IDL) and the whole reduction and analysis is performed in the CIA environment.
The first part of the reduction consists in the first estimation of background flux levels, identification of bright sources and glitches in each pixel history. Hence, a fitting procedure is applied. Subsequently, the signal is checked interactively where the fit failures occurred or in noisy pixels. The small parts of the signal involved are refitted by considering further glitches or sources not previously identified. Although usually each pixel is treated individually, in cases of strong cosmic ray hits the charges propagate in the surrounding pixels. To take into account also these cases, strong features from nearby pixels are considered in the fitting.
Once all the pixels are well fitted, the signal is flat-fielded and a map is obtained with CIA routines which take into account the geometric distortion. Positive and negative excesses in the map are back-projected on pixel time histories and checked interactively, eventually improving the fit of the pieces involved.
Hence, a further map is obtained and sources are extracted. We consider all the sources at 4- level which we back-projected on the time pixel histories. At this point, the last interactive checking is done to recover all the faint parts of the source signal if the source is real or to correct the fit if the source is false. This last step allows us to improve the estimates of position and flux of the sources since we better recover the wings of the point spread function (PSF).
4 Mosaicing and source extraction
Since the total observation is composed of four different rasters, the absolute astrometry of each raster map has to be corrected before coadding the four maps in a unique image. We used as astrometrical reference the r’ image matching as many objects as possible to correct for shifts in the in-scan and cross-scan directions. While shifts in the cross-scan direction are around 2′′, those along the in-scan direction are typically bigger ( 7′′). After updating the astrometry information in the header of the raster structure, we reproject all the images using the same scale and orientation. Finally, the map is obtained summing the four maps by weighting them with the exposure maps.
As discussed by Lari et al. (2001), it is better to consider the map obtained without corrections for source transients (unreconstructed image) in the source extraction. In fact, the correction for the transient effects does not work efficiently at low fluxes and it is better to correct for these effects with simulations.
Since our extraction considers only the peak flux, we obtained better results in the extraction using 6′′ pixels sampled at a distance of 2′′. The image used for the extraction of point sources has a pixel of 2′′ size with the flux in each pixel corresponding to the flux recovered by a 6′′ pixel at the same center.
Another map of a 2′′ pixel size has been obtained to measure the flux of extended sources. In this case, we used the flux reconstructed by the model of Lari et al. (2001) which works well at high fluxes.
The root-mean-square (RMS) image used for the detection is obtained from the actual image and the exposure map. The source detection is done using the find routine of the IDL astronomical library (an IDL implementation of a DAOPHOT routine). We check interactively all the sources which have a peak in the SNR map higher than 4-. Then, once corrections and new fits are done, we reproject everything for the last time, extract the sources and retain in the final catalogue only the sources at the 5- level. Errors in the source position and photometry depend on the source SNR, as discussed further below.
4.1 Source Photometry
Measuring fluxes for ISOCAM faint sources is particularly challenging because of the presence of strong memory effects after cosmic ray impacts. The presence of these events in the pixel histories makes the photometry error extremely variable across the image. To overcome this effect, Lari et al. (2001) proposed to base the flux estimate on the peak fluxes, at least for point sources, and to correct the measured values for a scale factor deduced by simulating a source with a similar flux at the location where the source was detected (the so called autosimulation). Since most of the sources are distant faint sources and the pixel field of view is quite large (six arcseconds), the method is applied to almost every source with a few exceptions. For extended sources aperture photometry is used.
Although the autosimulations allow one to improve the photometric accuracy, the fact that the actual position of the source is poorly known typically leads to underestimates of the actual flux. To take into account this effect, we run extensive simulations which also allow us to estimate the errors and the completeness of the survey (see further below).
Finally, to transform instrumental units to physical units, one can refer to the factors computed by Blommaert et al. (2000) with calibration stars during the ISO mission. We have checked this calibration with a few stars in our field for which we collected near-IR and optical magnitudes.
4.2 Absolute calibration
Blommaert et al. (2000) calibrated the ISOCAM detectors using a few stars, observed several times during the ISO mission, for which detailed SEDs were available. In the case of the LW3 band, seven stars have been used. Although the computed sensitivity factor is in good agreement with pre-launch values, a large scatter is present in the data. This could depend on the reduction method used (especially for transient correction) or on possible variations of the detector responsivity during the mission.
Since in our field there are many bright stars emitting in the LW3 band, we decided to independently compute an absolute calibration factor by observing some stars in near-IR and optical bands and fitting their SEDs with Kurucz (1993) stellar models. Although the spectral type of these stars is unknown, this method has the advantage of being absolutely coherent (stars and extra-galactic sources are reduced in the same manner) and independent of the variations of the detector responsivity during the mission (stars and extra-galactic sources were observed at the same time).
For this reason, we observed 21 stars in the J, H and Ks near-IR bands and in the U, B, g’, r’ and i’ optical bands. We fitted the SEDs of these stars using a grid of 253 Kurucz (1993) models to deduce the expected flux at 14.3 m. Table 2 summarizes the photometric data and the expected LW3 fluxes (LW3exp). All the magnitudes are Vega-like and an asterisk indicates that the star is slightly saturated in the band. Optical magnitudes have been derived using the mag_auto magnitude of SExtractor (version 2.3; Bertin & Arnouts 1996). The estimates take into account the saturated pixels. Lower weights have been assigned to magnitudes of slightly saturated stars in the least-square-mean fits to the Kurucz (1993) models.
| RA | DEC | u | B | g’ | r’ | i’ | J | H | Ks | LW3 | LW3exp |
|---|---|---|---|---|---|---|---|---|---|---|---|
| (J2000) | (J2000) | [mJy] | [mJy] | ||||||||
| 10:49:58.831 | +57:13:31.47 | 14.788 | 14.01 | 13.36* | 12.49 | 11.98 | 11.23 | 10.71 | 10.58 | 0.900.12 | 1.200.04 |
| 10:50:09.377 | +57:04:10.89 | 12.916 | 12.84 | 12.82* | 11.84* | 11.49* | 11.04 | 10.82 | 10.70 | 0.730.11 | 0.930.03 |
| 10:51:01.477 | +57:03:42.03 | 14.381 | 13.93 | 13.64 | 12.61 | 12.16 | 11.52 | 11.12 | 11.03 | 0.430.06 | 0.710.02 |
| 10:51:30.919 | +57:34:39.72 | 18.010 | 17.11 | 16.37 | 14.69 | 12.79 | 11.04 | 10.47 | 10.21 | 2.410.30 | 1.910.07 |
| 10:50:58.259 | +57:25:12.28 | 13.164 | 13.01 | 12.91* | 11.88* | 11.47 | 10.93 | 10.54 | 10.46 | 0.530.08 | 1.250.04 |
| 10:50:59.130 | +57:24:26.44 | 14.137 | 13.82 | 13.54 | 12.61 | 12.20 | 11.63 | 11.23 | 11.14 | 0.310.06 | 0.610.02 |
| 10:51:59.816 | +57:13:12.37 | 13.573 | 13.33 | 12.89* | 12.14* | 11.72 | 11.16 | 10.77 | 10.73 | 0.910.14 | 0.970.03 |
| 10:52:51.858 | +57:27:37.85 | 13.071 | 13.13 | 12.87* | 12.26 | 11.93 | 11.58 | 11.35 | 11.27 | 0.780.11 | 0.580.02 |
| 10:52:50.223 | +57:26:08.61 | 12.462 | 12.61 | 12.54* | 11.83* | 11.44 | 11.06 | 10.82 | 10.75 | 0.980.12 | 0.940.03 |
| 10:53:10.858 | +57:13:55.95 | 12.556 | 12.48* | 12.28* | 11.62* | 11.14* | 10.69 | 10.42 | 10.33 | 1.380.17 | 1.320.04 |
| 10:53:07.946 | +57:18:25.70 | 12.893 | 12.66 | 12.37* | 11.66* | 11.17* | 10.73 | 10.42 | 10.33 | 1.350.17 | 1.340.04 |
| 10:53:08.928 | +57:33:16.41 | 13.239 | 12.91 | 12.50* | 11.66* | 11.19* | 10.60 | 10.21 | 10.11 | 2.090.26 | 1.780.05 |
| 10:52:01.560 | +57:10:46.90 | 12.485 | 11.99 | 11.83* | 10.97* | 10.38* | 9.46 | 9.03 | 8.91 | 5.200.63 | 5.430.15 |
| 10:51:53.820 | +57:19:00.30 | 11.288 | 11.46* | 11.26* | 10.66* | 10.23* | 9.48 | 9.16 | 9.11 | 4.180.50 | 4.060.11 |
| 10:51:22.040 | +57:24:15.30 | 12.744 | 11.97* | 11.83* | 10.75* | 10.19* | 9.19 | 8.65 | 8.54 | 7.250.87 | 7.580.20 |
| 10:51:14.843 | +57:35:25.84 | 12.402 | 12.21 | 12.28 | 11.29 | 10.71* | 10.25 | 9.93 | 9.86 | 2.010.25 | 2.230.07 |
| 10:49:45.966 | +57:03:55.64 | 12.247 | 11.84 | 11.84 | 10.82 | 10.37* | 9.62 | 9.31 | 9.17 | 4.480.54 | 4.100.12 |
| 10:50:36.049 | +57:06:13.27 | 11.880 | 11.86 | 11.88 | 11.01 | 10.56* | 10.02 | 9.71 | 9.67 | 2.540.31 | 2.560.07 |
| 10:51:10.844 | +57:21:40.86 | 19.340 | 18.31 | 17.64 | 16.01 | 14.16 | 12.40 | 11.79 | 11.55 | 0.650.09 | 0.570.02 |
| 10:52:31.335 | +57:15:52.54 | 14.061 | 14.08 | 13.64 | 13.12 | 12.74 | 12.29 | 11.96 | 11.90 | 0.370.06 | 0.310.01 |
| 10:52:33.483 | +57:12:33.94 | 14.922 | 14.50 | 13.94 | 13.25 | 12.84 | 12.31 | 11.98 | 11.89 | 0.230.06 | 0.350.01 |
-
∗
The star is slightly saturated in this band.

As shown in Figure 5, we found that the median ratio between predicted and measured fluxes (assuming the calibration factor by Blommaert et al. , 2000) is 1.0. Since most of the points lie inside a band, which correspond to our photometric errors, we conclude that this calibration factor is in agreement with our study and can be safely assumed also in case of faint fluxes. This is a very important point since these catalogues are used to compute deep 14.3 m extra-galactic counts. The counts of Gruppioni et al. (2002) assume, for instance, a slightly different calibration based on a relationship between near-IR magnitudes and IRAS fluxes.

5 Survey Performance
In spite of its low redundancy (on average three images for each sky point), the Lockman Hole shallow survey is one of the highest quality ISOCAM extra-galactic surveys. As visible in Figure 2, the coverage is highly homogeneous and without any gap. Moreover, each raster scan has the highest number of readouts among the ISOCAM surveys. Because of the presence of a long term transient in the ISOCAM data, this allow the detector to stabilize and have a more predictable behavior on a large part of the scan. Finally, observations have been performed during a period of low cosmic ray flux with respect to other deep surveys. In Figure 6, we compare several deep ISOCAM surveys which have been performed with the same gain, exposure time per readout and pixel field of view of the Lockman Hole shallow survey. We evaluated the rate of cosmic rays by counting the number of glitches in the pixel signals beyond 5 times the rms of the signal. Since the transients caused by cosmic ray hits are the most difficult thing to correct in the signals, this quantity gives a direct measure of the quality of the data.
Therefore, in spite of the low depth of these data with respect to other ISOCAM surveys, the low rate of cosmic rays and the long scans used in the observations make the Lockman Hole Shallow Survey one of the best extra-galactic surveys performed by ISOCAM.
The astrometric and photometric accuracy, as well as the completeness limits of the survey have been estimated through a set of simulations at different flux levels. We describe in the following how the simulations have been performed and analyzed. Moreover, since the central region has been observed twice at different depths, we discuss also the photometric accuracy and source extraction reliability comparing our catalogue to that of the deep survey (Rodighiero et al. 2004).
5.1 Simulations and Completeness
Although we autosimulate the extracted sources to recover the flux from the wings of their PSFs, a small fraction of flux remains undetected since the center of the source is not precisely known. To estimate statistically this correction, as well as to study the errors in astrometry and photometry and the completeness limit of the survey, simulations are needed. We decided to perform a set of simulations at several fluxes (0.35, 0.5, 0.7, 1, 1.4, and 2 mJy) which span the entire flux range of the survey.
Each simulation has been done introducing, in one of the rasters, a set of 50 artificial sources in regions observed at least 100 seconds to exclude the noisy borders of the images. The sources have been put in positions with SNR less than 2 in order to avoid overlapping real sources. This synthetic image, created using the LW3 PSF, has been backprojected to the data cube adding the transient behavior according to the model of Lari et al. (2001) and taking into account the camera distortions and flat-fielding. Finally, the synthetic data cube added to the original raw data cube has been reanalyzed in the same way as the original cube. To speed up the process, the interactive part of the reduction has been applied only to the parts of the cube close to the added artificial sources.
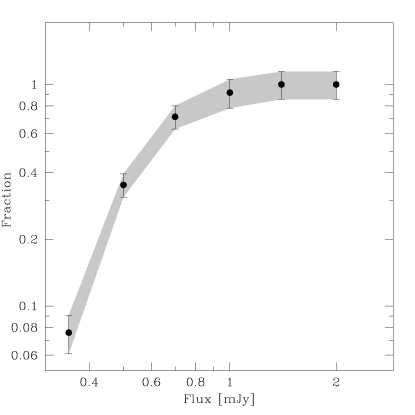
To have enough data for reliable statistics at each flux, we performed seven simulations at 0.35 mJy, four at 0.5 mJy, three at 0.7 mJy and one for the other fluxes. The number of sources detected at each flux automatically gives us the estimate of the completeness (see Figure 7). The survey is therefore close to 100% complete for fluxes brighter than 1 mJy. The 20%, 50%, and 80% completeness limits are 0.45, 0.6, and 0.8 mJy, respectively.

5.2 Astrometric Accuracy
To evaluate the astrometric accuracy we used the simulations and the cross-correlation with the optical image. While the comparison with the optical image gives a direct estimate of the astrometric accuracy, one has to add to the error estimated from the simulations the pointing error. In fact, although we improved the absolute astrometry of the LW3 images adding the offsets between the brightest LW3 sources and their optical counterparts, the dispersion of the estimated offsets is still significant (around 0.6′′).
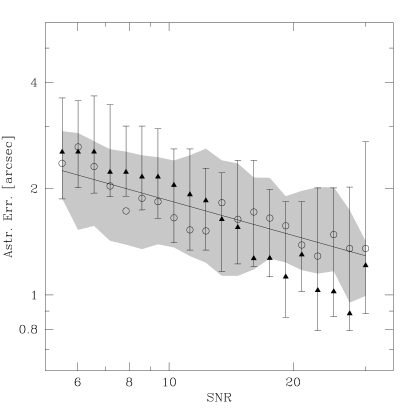
In Figure 8 we report the astrometric error as a function of the SNR of the detection for the simulated and observed sources. To show the uncertainty in the measurement of the astrometric error, we plotted the radii containing at each value of SNR 50%, 68% and 80% of the counterparts (true and optical positions for the simulated and observed sources, respectively). The agreement between simulations and cross-correlation of optical and real sources is generally good, except for high SNR values where the statistics of the real sources are poor. The line, obtained through a least square fit of the simulated points, traces the 1- error reported in our catalogue. The typical error is lower than 2.5′′ and, for well detected sources with SNR , is less than 2′′.
The and offsets between the observed sources and their optical counterparts are shown in Figure 9. Within a circle of 2 arcsec we have 68% of the optical counterparts, i.e. 1- in the case of a Gaussian distribution. We have considered in this case, only optical counterparts inside the beam of the LW3 image (4.7′′).


5.3 Photometric Accuracy
The photometric accuracy of the survey has been studied through our set of simulations. Moreover, since the central part of the field has been reobserved deeply a second time (Rodighiero et al. 2004), we also compared the photometry of the sources common to the two surveys.
Figure 10 summarizes the results of our set of simulations. The location and dispersion of the distributions have been evaluated by means of the biweight estimator (Beers, Flynn, & Gebhardt 1990). Except for the case of very low fluxes (0.35 mJy), the flux measured is always lower than the true flux. The median ratio between output and input fluxes is stable for fluxes greater than 0.5 mJy converging to the value of 0.84 at 2 mJy. We assume this value to correct the bias in the flux measurement of real sources.
Going towards low fluxes, the detection is more affected by the structure of the noise. Sources on the top of positive oscillations of the noise are enhanced allowing their detection, but also affecting their flux measurement. We remind in fact that our estimates of the flux are based on the peak value which is highly biased in these cases.
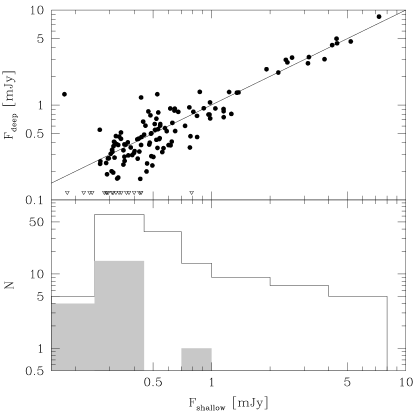
This effect is clearly visible in Figure 11 where we compare the fluxes of the same sources detected in the shallow and deep surveys. In the case of faint sources, the flux estimate based on the shallow survey is overestimated with respect to that based on the deeper observation.
Therefore, the fluxes of sources fainter than the 20% completeness limit are typically overestimated and it is very dangerous to consider sources below this limit for counts purposes. When used for computing SEDs, these values have to taken as upper limits of the flux.
As discussed in Lari et al. (2001), our photometric errors come from the autosimulation process and the noise in the sky map:
| (3) |
The second term is very important at low fluxes and negligible for high SNR sources. So, we can derive the first term from our simulations at high fluxes. Considering only sources detected with , the first term is 0.14. At our lower limit of , the relative error is 25% and converge to 15% at .
5.4 Reliability
Because of the low redundancy and the difficulty in properly correcting the transients caused by energetic cosmic rays, we expect a certain fraction of the sources in our catalogue to be spurious detections. A small percentage might be also due to detections of transient events (asteroids or variable objects).
Since a quarter of the area has been reobserved at the same wavelength in a deeper survey, we can match the sources in our catalogue with those of the deep survey (Rodighiero et al. 2004) to evaluate the false detection rate.
We stress here that this analysis gives an upper limit to the number of spurious detections, since some of the faint sources detected in the shallow survey can be missed by the deep survey. In fact, at faint fluxes, also the deep survey is not 100% complete and a certain percentage of sources is missed mainly because of the effect of uncorrected cosmic rays.
141 sources of our catalogue fall in the region of the deep survey. Using a matching radius of 9′′(twice the full-width half maximum (FWHM) of the 14.3 m PSF), we find 121 matches with the deep survey catalogue, i.e. 86% of the detections have a counterpart in the deep survey. However, as shown in Figure 12, the probable spurious detections have very low fluxes (lower than 0.45 mJy, i.e. the 20% completeness limit).
We do not consider in our final catalog sources fainter than 0.25 mJy which are almost certainly false detections.
Between 0.25 mJy and 0.45 mJy, the percentage of false detections is 24% and it decreases to a very low level at brighter fluxes. For this reason we split our catalogue into two lists. The first one presents the 260 sources with flux greater than 0.45 mJy which are reliable and have unbiased photometry.
Because of the great scientific interest of faint infrared sources, we also provide a supplementary list of 197 sources with estimated flux lower than 0.45 mJy with the caveats that the percentage of false detections is high (24%) and that some of sources have overestimated fluxes. The 16 sources which are undetected in the deep surveys are commented with a question mark in the catalogue. 10 of them have no optical counterpart or a probability of random association bigger than 10%.
6 Optical counterparts
We searched for optical counterparts on a r’ image which covers the entire ISOCAM survey. In this paragraph, we describe the optical image and the method used for the identification.
6.1 The optical image
The optical image was taken in the Sloan r’ filter band at the Isaac Newton telescope (INT) in La Palma, Spain in two nights (2001, Dec. 12 and 2002, Jan. 20). The field was covered with four pointings with five dithers at each position. Moreover, to cover a small part of the ISOCAM field which was out of the observed field, we used also an archival image taken as part of the Wide Field Survey with the INT (McMahon et al. , 2001).
The images have been reduced using IRAF packages (in particular mscred) and taking into account the non-linearity of the CCD response and the radial distortion term described in the INT Wide Field Survey web page 555www.ast.cam.ac.uk/ wfcsur/index.php. The astrometry has been added taking as a reference the GSC-II catalogue666The Guide Star Catalogue-II is a joint project of the Space Telescope Science Institute and the Osservatorio Astronomico di Torino. Space Telescope Science Institute is operated by the Association of Universities for Research in Astronomy, for the National Aeronautics and Space Administration under contract NAS5-26555. The participation of the Osservatorio Astronomico di Torino is supported by the Italian Council for Research in Astronomy. Additional support is provided by European Southern Observatory, Space Telescope European Coordinating Facility, the International GEMINI project and the European Space Agency Astrophysics Division..
To improve the background matching and obtain a smooth constant background, the bright Tycho stars in the field have been subtracted from each image.
The photometric zero-point has been evaluated using the standard stars in the night with the best transparency and every image has been scaled to an image taken during this night. Finally, the images have been coadded to obtain an image covering the entire LW3 field.
The spatial resolution is variable across the image (0.9′′ FWHM 1.3′′) due to different seeing conditions. Since the RMS of the images is slightly different for the different nights, the limiting magnitude depth varies from r’=25 to r’=25.5 (Vega), as measured at 5- inside an aperture of 1.35FWHM of a stellar PSF (optimal aperture to include most of the flux and least of the background in the case of a Gaussian PSF).
A catalogue of sources has been produced using SExtractor (version 2.3; Bertin & Arnouts 1996) using a 3FWHM aperture magnitude and the auto_mag for extended sources. In the catalogue we considered only sources with SNR greater than 3 within an aperture of 1.35FWHM. Since bright stars are saturated in this image, we will report in the catalogue, when this is possible, the magnitudes from the shallow exposures taken for calibration purposes. Position of saturated stars are taken from the Tycho2 catalogue.
SExtractor computes also a stellar index which can be safely used for magnitudes brighter than r’=23 to separate star-like objects from galaxies. We have used this index to identify stars in our catalogue (values greater than 0.85), unless in case of saturated stars which are easily classifiable by direct inspection of the image.
More details about the data reduction and source extraction of this optical image, as well as of a set of images in other four optical bands observed in the center of the same field, will be given in a forthcoming paper (Fadda, 2004).
6.2 Identification of the counterparts
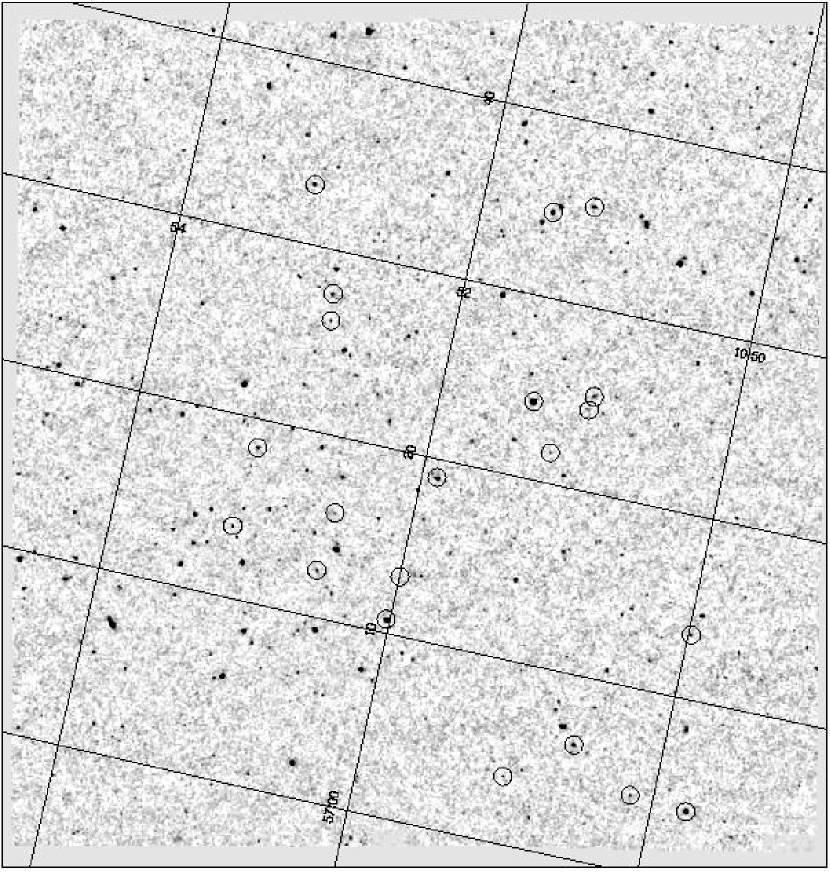
To search for optical counterparts of the mid-IR sources, we have considered a maximum distance of 4.7′′, i.e. the FWHM of the 14.3 m PSF. As shown in Figure 9, most of the sources lie inside a 2′′radius circle which agree very well with the typical astrometric error of the LW3 sources.
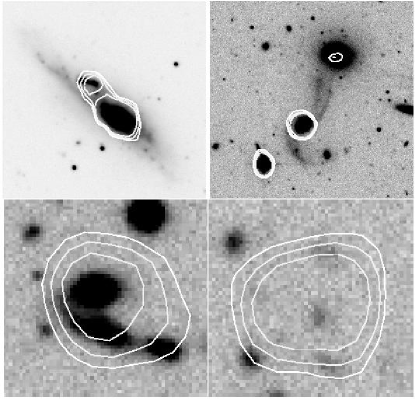
In general, mid-IR sources have clear optical counterparts. In a few cases, they correspond to a pair of interacting galaxies or there are several possible counterparts (see Figure 13 for some examples). In the entire field there is only one source which has been detected by IRAS (the galaxy NGC 3440) and that has been resolved by ISO in two components. This is also the only extended source in our survey.
For each source, we have computed the probability of random association of the mid-IR source with its optical counterpart. Assuming a Poissonian distribution of the optical sources,
| (4) |
gives the probability of random association within a distance with optical sources brighter than , where is the expected number density of optical sources brighter than (the magnitude of the possible counterpart). To evaluate we used the counts of sources in our optical image.

Figure 14 describes the cumulative counts of the sources, galaxies, stars and blank fields, i.e. sources without optical counterparts in our image. Stars are 21% of the sources for fluxes greater than the 50% completeness limit (0.6 mJy). The number of blank fields is very limited for sources brighter than the 20% completeness limit (less than 5%) and is less than 11% for the all sources. Since under the 20% completeness limit the number of false detections increases very rapidly, many of the blank fields correspond probably to false detections.
7 Data Products
Images in fits format and catalogues in ASCII format are made available to the astronomical community through the world-wide-web 777via anonymous ftp to cdsarc.u-strasbg.fr (130.79.128.5) or via http://cdsweb.u-strasbg.fr/cgi-bin/qcat?J/A+A/, http://spider.ipac.caltech.edu/staff/fadda/lockman.html and http://irsa.ipac.caltech.edu/data/SPITZER/SWIRE or directly on request from the authors.
7.1 Images
The images which are made publicly available have a size of 7.6 Mbyte and consist of:
Flux map: an image with pixels of 2′′ and units of mJy/pixel. This image corresponds to the reconstructed image, i.e. the image with transients of the sources corrected by the model. We stress that, in case of faint fluxes, the reconstruction does not work properly and that we computed the fluxes using the uncorrected image and correcting the fluxes with autosimulations;
Coverage map: an image with pixels of 2′′ and units of number of readouts. Since every readout has an integration time of 5.04 s, the exposure map can be obtained simply multiplying this map by the integration time per readout;
SNR map: this map has a resolution of 2′′and has been used for the extraction of source positions. Every pixel contains the SNR of an equivalent pixel of 6′′ (the natural beam of the observations) with the same center. Thanks to this kind of resampling, we have a better measurement of positions and fluxes.
7.2 Catalogue
The catalogue is split in two parts: the first one containing 260 highly reliable detections with estimated fluxes greater than 0.45 mJy and a second one with the 197 sources fainter than this limit for which the rate of false detections is around 24%. The two Tables (3 and 4) list:
-
•
Column 1: the full designation of the source recommended by the International Astronomical Union (IAU). The prefix is composed by the name of the satellite (ISO) and that of the survey (Lockman Hole Shallow Survey, LHSS);
-
•
Columns 2-3: right ascension and declination (J2000);
-
•
Column 4: estimated astrometric error in arcsec;
-
•
Column 5: 14.3 m flux and respective error in mJy;
-
•
Column 6: redundancy (number of frames) of the detection;
-
•
Column 7: peak SNR of the detection;
-
•
Column 8: r’ magnitude of the optical counterpart in the Vega system;
-
•
Column 9: SNR of the optical detection computed within an aperture of 1.35 FWHM;
-
•
Columns 10-11: right ascension and declination offsets of the optical counterpart in arcsec;
-
•
Column 12: probability of random association, computed according to the equation (4);
-
•
Column 13: notes about the object: star, if the object corresponds to a star (in the case the star is saturated on our image, we report the Tycho2 position); pair, if the IR emission comes from a pair of interacting galaxies; bridge, in one case the IR emission seems to come out of a faint bridge between two interacting galaxies; question mark, the source has not been detected in the deep survey (Rodighiero et al. 2004).
8 Summary
The Lockman Hole Shallow Survey, the shallowest and most extended among the IGTES surveys, has been reduced with the technique of Lari et al. (2001). These ISOCAM 14.3 m observations cover a region of 0.55 square arcminutes in the direction of the Lockman Hole. 457 sources are detected above the 5- threshold with fluxes in the interval 0.25-19. mJy.
Completeness and photometry accuracy of the catalogue have been assessed through a series of simulations at different flux levels. The survey is 80% complete at 0.8 mJy and 50% complete at 0.6 mJy. The positional accuracy, estimated with simulations and cross-correlation of infrared and optical sources, is around 1.5′′ for objects with SNR greater than 20 and around 2′′ for objects with SNR close to 5. We have checked also the absolute calibration using a set of 21 stars in the field observed in near-IR and optical bands. Our analysis confirms the factor computed by Blommaert et al. (2000). From the comparison with the deep survey in the same region (Rodighiero et al. 2004) we conclude that most of the spurious detections have fluxes lower than 0.45 mJy (also the 20% completeness limit of the survey).
Within the limiting depth of our optical image of the field (r’), we find 95% of counterparts for sources brighter than 0.45 mJy (the 20% completeness limit) and 89% in total. Stars make up 21% of the sources for fluxes brighter than 0.6 mJy (the 50% completeness limit) and 13% in total.
In a companion paper (Rodighiero et al. 2004), we present the analysis of the deep survey in the central region of the Lockman Hole at 14.3 m and 6.75 m and the combined 14.3 m counts. Forthcoming papers will present the imaging and spectroscopic follow-up observations of these fields and a cross-correlation between infrared and radio sources.
Acknowledgements.
Part of this work was supported by the “Spanish Ministerio de Ciencia y Tecnologia” (grant nr. PB1998-0409-C02-01) and by the EC Network ”POE” (grant nr. HPRN-CT-2000-00138). D.F. thanks Lisa Storrie-Lombardi for her comments and careful reading of the manuscript. He is also grateful to Yves Grosdidier who introduced him to the TCS telescope.References
- (1) Aussel, H., Cesarsky, C. J., Elbaz, D., & Starck, J. L., 1999, A&A, 342, 313
- (2) Beers, T.C., Flynn, K., & Gebhardt, K., 1990, AJ, 100, 32
- (3) Beichman, C.A., Cutri, R., Jarrett, T., Stiening, R., & Skrutskie, M., 2003, AJ, 125, 2521
- (4) Bertin, E., & Arnouts, S., 1996, A&AS, 117, 393
- (5) Blommaert, J., Metcalfe, L., Altieri, B., Biviano, A., Okumura, K., Siebenmorgen, R., Guest, S. & Ott, S., 2000, Exp. Astr., 10, 241.
- (6) Désert, F.-X., Puget, J.-L., Clements, D.L., Pérault, M., Abergel, A., Bernard, J.-P. & Cesarsky, C.J., 1999, A&A, 342, 363
- (7) Cesarsky, C., Abergel, A., Agnése P. et al. , 1996, A&A, 315, L32
- (8) Elbaz, D., Cesarsky, C., Fadda, D., et al. , 1999, A&A, 351, L37
- (9) Elbaz, D., Cesarsky, C. J., Chanial, P., Aussel, H., Franceschini, A., Fadda, D., & Chary, R. R., 2002, A&A, 384, 848
- (10) Fadda, D., Elbaz, D., Duc, P.-A. et al. , 2000, A&A, 361, 827
- (11) Fadda, D., Flores, H., Hasinger, G., Franceschini, A., Altieri, B., Cesarsky, C. J., Elbaz, D., & Ferrando, Ph., 2002, A&A, 383, 838
- (12) Fadda, 2004, in prep.
- (13) Fixsen, D. J., Dwek, E., Mather, J. C., Bennett, C. L., & Shafer, R. A., 1998, ApJ, 508, 123
- (14) Flores, H., Hammer, F., Thuan, T. X. et al. , 1999, ApJ, 517, 148
- (15) Flores, H., Hammer, F., Elbaz, D., Cesarsky, C. J., Liang, Y. C., Fadda, D., & Gruel, N., 2004A&A, 415, 885
- (16) Gispert, R., Lagache, G., & Puget, J. L., 2000, A&A, 360, 1
- (17) Gruppioni, C., Lari, C., Pozzi, F., Zamorani, G., Franceschini, A., Oliver, S., Rowan-Robinson, M., Serjeant, S., 2002, MNRAS, 335, 831
- (18) Hasinger, G., Burg, R., Giacconi, R., Hartner, G., Schmidt, M., Trumper, J., & Zamorani, G., 1993, A&A, 275, 1
- (19) Hauser, M. G., Arendt, R. G., Kelsall, T. et al. , 1998, ApJ, 508, 25
- (20) Kawara, K., Sato, Y., Matsuhara, H., Taniguchi, Y., Okuda, H., Sofue, Y. et al. , 1998, A&A, 336, L9
- (21) Kurucz, R.L., 1993, ATLAS9 Stellar Atmosphere Programs and 2 km/s grid (Kurucz CD-ROM No. 13), Cambridge, Mass.: Smithsonian Astrophysical Observatory
- (22) Lari, C., Pozzi, F., Gruppioni, C., Aussel, H., Ciliegi, P., Danese, L., et al. , 2001, MNRAS, 325, 1173
- (23) Laurent, O., Mirabel, I. F., Charmandaris, V., Gallais, P., Madden, S. C., Sauvage, M., Vigroux, L. & Cesarsky, C., 2000, A&A, 359, 887
- (24) Lockman, F. J., Jahoda, K., McCammon, D., 1986, ApJ, 302, 432
- (25) Lonsdale, C. J., Smith, H. E., Rowan-Robinson, M., et al. , 2003, PASP, 115, 897
- (26) McMahon, R. G., Walton, N. A., Irwin, M. J., Lewis, J. R., Bunclark, P. S., & Jones, D. H., 2001, NewAR, 45, 97
- (27) Metcalfe, L., Kneib, J.-P., McBreen, B. et al. , 2003, A&A, 407, 791
- (28) Oliver, S., Rowan-Robinson, M., Alexander, D. M., et al. , 2000, MNRAS, 316, 749
- (29) Oliver, S., Mann, R. G., Carballo, R. et al. , 2002, MNRAS, 332, 536
- (30) Ott, S., Gastaud, R., Ali, B., Delaney, M., Miville-Deschênes, M.-A., Okumura, K., Sauvage, M. and Guest, S., 2001, ASP Conf. Ser. 238, 170
- (31) Poggianti, B. M., & Wu, H., 2000, ApJ, 529, 157
- (32) Poggianti, B.M., Bressan, A., & Franceschini, A., 2001, ApJ, 550, 195
- (33) Puget, J.-L., Abergel, A., Bernard, J.-P. et al. , 1996, A&A, 308, L5
- (34) Rigopoulou, D., Franceschini, A., Aussel, H. et al. , 2000, ApJ, 537, L85
- (35) Rodighiero, G., Lari, C., Franceschini, A., Gregnanin, A. & Fadda, D., 2003, MNRAS, 343, 1155
- (36) Rodighiero, G., Lari, C., Fadda, D., Franceschini, A., Elbaz, D., & Cesarsky, C., 2004, A&A, submitted
- (37) Serjeant, S. B. G., Eaton, N., Oliver, S. J., et al. , 1997, MNRAS, 289, 457
- (38) Soifer, B. T., Houck, J. R., & Neugebauer, G., 1987, ARA&A, 25, 187
- (39) Soifer, B. T., & Neugebauer, G., 1991, AJ, 101, 354
- (40) Starck, J.-L., Aussel, H., Elbaz, D., Fadda, D. & Cesarsky, C.J., 1999, A&AS, 138, 365
- (41) Werner, M. et al. , 2004, ApJL, in press
| Source name | RA | DEC | Flux | Nfr | SNR | r’ | SNR_r | (ISO-opt) | Prob | Notes | ||
|---|---|---|---|---|---|---|---|---|---|---|---|---|
| (J2000) | (J2000) | [arcsec] | [mJy] | [mag] | [arcsec] | |||||||
| ISO_LHSS_J105301+57420 | 10:53:01.124 | +57:42:08.87 | 1.2 | 18.75 2.25 | 1 | 138 | 0.6 | 0.9 | 0.01 | star | ||
| ISO_LHSS_J105349+57070 | 10:53:49.570 | +57:07:07.77 | 1.2 | 11.15 1.61 | 2 | 58 | 13.59 | 5428 | 0.8 | 0.2 | 0.01 | NGC3440 |
| ISO_LHSS_J105122+57241 | 10:51:22.009 | +57:24:14.36 | 1.2 | 7.27 0.87 | 4 | 124 | 10.75 | 3619 | 0.2 | -0.3 | 0.01 | star |
| ISO_LHSS_J105035+57332 | 10:50:35.581 | +57:33:22.90 | 1.2 | 7.24 0.87 | 3 | 151 | 0.1 | -1.2 | 0.01 | star | ||
| ISO_LHSS_J105301+57054 | 10:53:01.406 | +57:05:43.64 | 1.2 | 7.10 0.85 | 4 | 132 | 16.92 | 1551 | 0.5 | 0.5 | 0.01 | |
| ISO_LHSS_J105201+57104 | 10:52:01.201 | +57:10:43.50 | 1.2 | 5.20 0.63 | 3 | 85 | 10.97 | 2714 | 0.2 | -0.9 | 0.01 | star |
| ISO_LHSS_J105336+57380 | 10:53:36.262 | +57:38:00.93 | 1.2 | 5.16 0.62 | 2 | 61 | -0.6 | 0.5 | 0.01 | star | ||
| ISO_LHSS_J105432+57093 | 10:54:32.260 | +57:09:31.23 | 1.2 | 4.80 0.58 | 2 | 57 | 15.87 | 2171 | -0.4 | -1.3 | 0.01 | |
| ISO_LHSS_J105445+57274 | 10:54:45.861 | +57:27:47.75 | 1.2 | 4.78 0.58 | 3 | 65 | 16.05 | 1810 | -0.2 | 0.2 | 0.01 | |
| ISO_LHSS_J104945+57035 | 10:49:45.959 | +57:03:56.37 | 1.2 | 4.48 0.54 | 3 | 55 | 10.82 | 3619 | -0.1 | 0.7 | 0.01 | star |
| ISO_LHSS_J105227+57135 | 10:52:27.484 | +57:13:54.67 | 1.2 | 4.43 0.53 | 4 | 82 | 21.49 | 57 | 0.2 | -0.3 | 0.01 | |
| ISO_LHSS_J105303+57120 | 10:53:03.798 | +57:12:05.72 | 1.2 | 4.40 0.53 | 4 | 77 | 19.34 | 310 | 1.0 | 0.1 | 0.01 | |
| ISO_LHSS_J105052+57350 | 10:50:52.474 | +57:35:06.89 | 1.2 | 4.31 0.52 | 4 | 66 | 15.31 | 2714 | 0.6 | -0.3 | 0.01 | |
| ISO_LHSS_J105153+57185 | 10:51:53.683 | +57:18:58.39 | 1.2 | 4.18 0.50 | 3 | 78 | 10.66 | 3620 | -1.0 | 0.8 | 0.01 | star |
| ISO_LHSS_J105041+57070 | 10:50:41.931 | +57:07:07.73 | 1.2 | 4.11 0.50 | 4 | 72 | 16.48 | 987 | -0.2 | 1.0 | 0.01 | |
| ISO_LHSS_J105225+57015 | 10:52:25.876 | +57:01:54.59 | 1.2 | 3.84 0.47 | 4 | 55 | 16.47 | 1206 | 1.2 | 0.5 | 0.01 | |
| ISO_LHSS_J105242+57244 | 10:52:42.338 | +57:24:44.69 | 1.2 | 3.81 0.46 | 3 | 54 | 17.14 | 1810 | -0.6 | -0.3 | 0.01 | |
| ISO_LHSS_J105128+57350 | 10:51:28.121 | +57:35:02.30 | 1.2 | 3.51 0.43 | 4 | 60 | 16.70 | 2171 | 0.3 | -0.5 | 0.01 | |
| ISO_LHSS_J104948+57345 | 10:49:48.882 | +57:34:58.31 | 1.2 | 3.48 0.42 | 3 | 53 | 17.40 | 905 | -0.1 | 0.1 | 0.01 | |
| ISO_LHSS_J105404+57401 | 10:54:04.105 | +57:40:19.20 | 1.2 | 3.29 0.40 | 1 | 38 | 17.99* | 905 | 0.2 | -0.7 | 0.01 | star |
| ISO_LHSS_J105328+57111 | 10:53:28.008 | +57:11:15.54 | 1.2 | 3.23 0.39 | 4 | 54 | 18.27 | 603 | 0.2 | -0.3 | 0.01 | |
| ISO_LHSS_J105228+57091 | 10:52:28.678 | +57:09:19.38 | 1.2 | 3.17 0.38 | 4 | 55 | 19.79 | 241 | 1.2 | -0.4 | 0.01 | |
| ISO_LHSS_J105318+57214 | 10:53:18.933 | +57:21:40.82 | 1.2 | 3.13 0.38 | 4 | 48 | 17.21 | 776 | 0.2 | 0.1 | 0.01 | |
| ISO_LHSS_J105207+57074 | 10:52:07.152 | +57:07:45.35 | 1.2 | 2.79 0.34 | 3 | 47 | 17.18 | 835 | -0.2 | -0.6 | 0.01 | |
| ISO_LHSS_J105256+57082 | 10:52:56.829 | +57:08:24.64 | 1.2 | 2.69 0.33 | 4 | 36 | 16.88 | 987 | 0.2 | -1.2 | 0.01 | |
| ISO_LHSS_J105421+57254 | 10:54:21.270 | +57:25:44.84 | 1.2 | 2.64 0.32 | 3 | 41 | 18.63 | 835 | 0.8 | 0.3 | 0.01 | |
| ISO_LHSS_J105242+57191 | 10:52:42.294 | +57:19:14.50 | 1.2 | 2.60 0.32 | 5 | 50 | 17.55 | 2171 | -1.1 | -0.3 | 0.01 | |
| ISO_LHSS_J105035+57061 | 10:50:35.929 | +57:06:13.08 | 1.2 | 2.55 0.31 | 4 | 37 | 11.01 | 2714 | -1.0 | -0.2 | 0.01 | star |
| ISO_LHSS_J105231+57175 | 10:52:31.674 | +57:17:51.98 | 1.2 | 2.46 0.30 | 3 | 33 | 22.99 | 24 | 1.1 | -0.1 | 0.01 | |
| ISO_LHSS_J105143+57293 | 10:51:43.660 | +57:29:38.89 | 1.3 | 2.41 0.30 | 3 | 28 | 16.39 | 1810 | -0.9 | 1.8 | 0.01 | |
| ISO_LHSS_J105130+57343 | 10:51:30.985 | +57:34:39.12 | 1.2 | 2.41 0.30 | 3 | 39 | 14.69* | 517 | -0.6 | -0.8 | 0.01 | star |
| ISO_LHSS_J105252+57290 | 10:52:52.753 | +57:29:01.68 | 1.2 | 2.21 0.27 | 4 | 44 | 17.32 | 1357 | -0.0 | 1.9 | 0.01 | |
| ISO_LHSS_J105309+57331 | 10:53:09.093 | +57:33:17.14 | 1.4 | 2.09 0.27 | 2 | 24 | 11.66 | 2171 | 1.2 | 0.6 | 0.01 | star |
| ISO_LHSS_J104948+57382 | 10:49:48.651 | +57:38:21.10 | 1.3 | 2.01 0.25 | 2 | 29 | 0.4 | 0.2 | 0.01 | star | ||
| ISO_LHSS_J105114+57352 | 10:51:14.832 | +57:35:25.47 | 1.4 | 2.01 0.25 | 4 | 25 | 11.29 | 2714 | -0.1 | -0.4 | 0.01 | star |
| ISO_LHSS_J105359+56581 | 10:53:59.546 | +56:58:17.31 | 1.2 | 1.98 0.25 | 4 | 31 | 18.12 | 517 | 0.4 | 0.3 | 0.01 | |
| ISO_LHSS_J105141+57450 | 10:51:41.422 | +57:45:07.02 | 2.0 | 1.93 0.35 | 1 | 7 | 24.89 | 4 | 1.3 | -1.5 | 0.11 | |
| ISO_LHSS_J105113+57142 | 10:51:13.381 | +57:14:26.20 | 1.2 | 1.92 0.24 | 3 | 37 | 20.10 | 184 | 0.5 | -0.6 | 0.01 | |
| ISO_LHSS_J105426+57364 | 10:54:26.407 | +57:36:49.23 | 1.2 | 1.84 0.23 | 3 | 33 | 18.08 | 517 | 1.2 | -0.0 | 0.01 | |
| ISO_LHSS_J105002+57472 | 10:50:02.791 | +57:47:20.91 | 1.6 | 1.79 0.25 | 1 | 15 | 20.43 | 149 | -0.3 | 0.8 | 0.01 | star |
| ISO_LHSS_J105320+57143 | 10:53:20.790 | +57:14:32.51 | 1.4 | 1.78 0.23 | 3 | 21 | 15.66 | 1810 | -1.1 | -0.7 | 0.01 | |
| ISO_LHSS_J105003+57323 | 10:50:03.885 | +57:32:37.79 | 1.4 | 1.65 0.21 | 3 | 23 | 0.3 | -0.3 | 0.01 | star | ||
| ISO_LHSS_J104958+57355 | 10:49:58.700 | +57:35:52.66 | 1.2 | 1.65 0.20 | 3 | 31 | 1.3 | -0.6 | 0.01 | star | ||
| ISO_LHSS_J105100+57411 | 10:51:00.385 | +57:41:15.22 | 1.2 | 1.61 0.20 | 3 | 33 | 16.13 | 776 | -0.2 | 0.2 | 0.01 | |
| ISO_LHSS_J105252+57075 | 10:52:52.690 | +57:07:53.17 | 1.5 | 1.57 0.20 | 2 | 20 | 17.46 | 1086 | -0.5 | -0.7 | 0.01 | |
| ISO_LHSS_J105434+57202 | 10:54:34.841 | +57:20:25.24 | 1.5 | 1.57 0.20 | 4 | 20 | 22.88 | 21 | 0.9 | 1.6 | 0.02 | |
| ISO_LHSS_J105243+57404 | 10:52:43.469 | +57:40:40.13 | 1.3 | 1.53 0.19 | 3 | 26 | 16.24* | 1357 | 0.0 | 0.9 | 0.01 | star |
| ISO_LHSS_J105216+57353 | 10:52:16.501 | +57:35:30.13 | 1.3 | 1.51 0.19 | 3 | 26 | 18.36 | 776 | -0.9 | -0.0 | 0.01 | |
| ISO_LHSS_J105134+57335 | 10:51:34.343 | +57:33:59.89 | 1.4 | 1.50 0.19 | 3 | 24 | 16.70 | 1357 | -0.8 | -0.1 | 0.01 | |
| ISO_LHSS_J105458+57282 | 10:54:58.477 | +57:28:28.13 | 1.3 | 1.47 0.18 | 3 | 26 | 22.46 | 26 | -0.5 | -0.4 | 0.01 | |
| ISO_LHSS_J105412+57090 | 10:54:12.220 | +57:09:00.20 | 1.2 | 1.47 0.18 | 7 | 33 | 15.99* | 542 | -1.8 | -2.1 | 0.01 | star |
| ISO_LHSS_J105314+57413 | 10:53:14.714 | +57:41:33.53 | 1.7 | 1.45 0.21 | 1 | 13 | 18.41 | 157 | -0.9 | -4.5 | 0.01 | |
| ISO_LHSS_J105019+57281 | 10:50:19.757 | +57:28:13.17 | 1.4 | 1.42 0.18 | 3 | 21 | 19.22 | 434 | 0.6 | 0.2 | 0.01 | |
| ISO_LHSS_J105341+57191 | 10:53:41.034 | +57:19:19.77 | 1.4 | 1.40 0.18 | 4 | 24 | 17.61 | 776 | 1.5 | 2.0 | 0.01 | |
| ISO_LHSS_J105351+57072 | 10:53:51.273 | +57:07:26.98 | 1.5 | 1.39 0.18 | 3 | 17 | 17.21 | 835 | 0.3 | -0.7 | 0.01 | NGC3440 (b) |
| ISO_LHSS_J105310+57135 | 10:53:10.719 | +57:13:56.50 | 1.4 | 1.38 0.17 | 2 | 24 | 11.62 | 2171 | -0.8 | 0.3 | 0.01 | star |
| ISO_LHSS_J105307+57182 | 10:53:07.906 | +57:18:27.11 | 1.4 | 1.35 0.17 | 3 | 22 | 11.66 | 2171 | -0.0 | 1.2 | 0.01 | star |
| ISO_LHSS_J105425+57193 | 10:54:25.653 | +57:19:37.60 | 1.4 | 1.34 0.17 | 4 | 22 | 21.07 | 89 | -0.2 | 0.3 | 0.01 | |
| ISO_LHSS_J104956+57144 | 10:49:56.045 | +57:14:41.42 | 1.4 | 1.34 0.17 | 4 | 22 | 17.75 | 494 | -0.4 | 1.0 | 0.01 | |
| ISO_LHSS_J105156+56583 | 10:51:56.210 | +56:58:33.10 | 1.9 | 1.29 0.21 | 1 | 8 | 24.65 | 3 | -1.8 | 2.2 | 0.18 | |
| ISO_LHSS_J105334+57130 | 10:53:34.138 | +57:13:01.47 | 1.3 | 1.29 0.16 | 4 | 26 | 19.20 | 418 | -0.5 | 0.2 | 0.01 | |
| ISO_LHSS_J105326+57140 | 10:53:26.796 | +57:14:05.70 | 1.5 | 1.29 0.17 | 4 | 19 | 19.34 | 339 | 0.9 | 0.1 | 0.01 | pair |
| ISO_LHSS_J105225+57113 | 10:52:25.649 | +57:11:30.57 | 1.7 | 1.26 0.18 | 3 | 13 | 17.73 | 1086 | 0.5 | -1.0 | 0.01 | |
| ISO_LHSS_J105427+57075 | 10:54:27.704 | +57:07:59.57 | 1.4 | 1.26 0.16 | 3 | 21 | 18.25 | 517 | -0.1 | -0.5 | 0.01 | |
| ISO_LHSS_J105336+57014 | 10:53:36.438 | +57:01:47.06 | 1.4 | 1.24 0.16 | 4 | 23 | 17.76 | 679 | 1.0 | 0.1 | 0.01 | |
| ISO_LHSS_J105200+57180 | 10:52:00.264 | +57:18:04.56 | 1.4 | 1.23 0.16 | 6 | 25 | 24.01 | 10 | -0.8 | -1.4 | 0.04 | |
| ISO_LHSS_J105058+57451 | 10:50:58.682 | +57:45:12.02 | 1.5 | 1.23 0.16 | 3 | 20 | 17.20 | 905 | 0.4 | -0.5 | 0.01 | |
| ISO_LHSS_J105330+57392 | 10:53:30.905 | +57:39:21.51 | 1.5 | 1.22 0.16 | 3 | 19 | 21.42 | 54 | -0.4 | 1.0 | 0.01 | |
| ISO_LHSS_J105324+57123 | 10:53:24.730 | +57:12:31.92 | 1.7 | 1.22 0.18 | 2 | 12 | 17.28 | 1357 | 0.6 | 0.8 | 0.01 | |
| ISO_LHSS_J105315+57412 | 10:53:15.970 | +57:41:25.33 | 1.8 | 1.19 0.18 | 1 | 11 | 19.07 | 105 | 1.2 | -6.0 | 0.01 | |
| ISO_LHSS_J105150+57390 | 10:51:50.273 | +57:39:06.89 | 1.4 | 1.19 0.15 | 3 | 23 | 17.40 | 776 | -1.8 | 0.8 | 0.01 | |
| ISO_LHSS_J105411+57101 | 10:54:11.016 | +57:10:16.14 | 1.5 | 1.18 0.15 | 3 | 19 | 17.33 | 835 | -1.8 | -0.2 | 0.01 | |
| ISO_LHSS_J105347+57013 | 10:53:47.780 | +57:01:36.27 | 1.7 | 1.17 0.16 | 2 | 13 | 21.83 | 49 | 1.5 | 0.3 | 0.01 | |
| ISO_LHSS_J105414+57124 | 10:54:14.777 | +57:12:42.85 | 1.4 | 1.16 0.15 | 4 | 21 | 19.20 | 472 | 0.1 | 0.5 | 0.01 | star |
| ISO_LHSS_J105141+57150 | 10:51:41.887 | +57:15:04.33 | 1.5 | 1.15 0.15 | 2 | 18 | 18.58 | 679 | -1.1 | 2.5 | 0.01 | pair |
| ISO_LHSS_J105239+57243 | 10:52:39.408 | +57:24:31.33 | 1.5 | 1.15 0.15 | 3 | 19 | 17.73* | 2171 | -1.5 | -0.3 | 0.01 | star |
| ISO_LHSS_J105213+57160 | 10:52:13.539 | +57:16:04.74 | 1.4 | 1.15 0.15 | 3 | 22 | 22.52 | 27 | 1.2 | -0.5 | 0.01 | |
| ISO_LHSS_J105134+57415 | 10:51:34.644 | +57:41:54.56 | 1.4 | 1.12 0.14 | 3 | 21 | 17.42 | 679 | 0.1 | 0.2 | 0.01 | |
| ISO_LHSS_J105039+57452 | 10:50:39.598 | +57:45:27.99 | 1.6 | 1.11 0.15 | 2 | 14 | 15.78 | 2171 | 0.6 | 0.5 | 0.01 | |
| ISO_LHSS_J104949+57375 | 10:49:49.977 | +57:37:57.67 | 1.5 | 1.10 0.15 | 3 | 17 | 21.30 | 80 | -0.1 | 0.3 | 0.01 | |
| ISO_LHSS_J105438+57225 | 10:54:38.419 | +57:22:55.78 | 1.7 | 1.08 0.15 | 3 | 13 | 22.15 | 26 | 1.1 | -0.1 | 0.01 | |
| ISO_LHSS_J105152+57090 | 10:51:52.046 | +57:09:08.81 | 1.6 | 1.07 0.15 | 2 | 15 | 19.21 | 241 | -0.3 | -0.4 | 0.01 | |
| ISO_LHSS_J105427+57100 | 10:54:27.012 | +57:10:03.97 | 1.5 | 1.07 0.14 | 3 | 17 | 21.72 | 41 | -0.9 | -0.4 | 0.01 | |
| ISO_LHSS_J105343+57253 | 10:53:43.348 | +57:25:30.29 | 1.6 | 1.06 0.14 | 4 | 16 | 20.64 | 122 | 1.2 | 0.4 | 0.01 | |
| ISO_LHSS_J105257+57151 | 10:52:57.678 | +57:15:15.93 | 1.4 | 1.05 0.13 | 6 | 25 | 18.03 | 724 | 0.1 | 0.2 | 0.01 | |
| ISO_LHSS_J105354+57052 | 10:53:54.174 | +57:05:27.13 | 1.6 | 1.04 0.14 | 3 | 16 | 19.31 | 319 | -0.9 | 1.0 | 0.01 | |
| ISO_LHSS_J105404+57203 | 10:54:04.211 | +57:20:35.39 | 1.6 | 1.03 0.14 | 2 | 15 | 19.58 | 418 | -0.7 | -1.0 | 0.01 | |
| ISO_LHSS_J105345+56552 | 10:53:45.908 | +56:55:27.72 | 2.0 | 1.00 0.17 | 1 | 8 | 23.34 | 8 | 1.5 | 2.9 | 0.10 | |
| ISO_LHSS_J105319+57124 | 10:53:19.545 | +57:12:44.21 | 1.6 | 0.99 0.14 | 2 | 14 | 22.83 | 19 | 0.1 | -1.8 | 0.02 | |
| ISO_LHSS_J105126+57215 | 10:51:26.646 | +57:21:59.72 | 1.6 | 0.98 0.13 | 5 | 15 | 19.47 | 494 | -0.9 | -0.7 | 0.01 | |
| ISO_LHSS_J105255+57195 | 10:52:55.481 | +57:19:51.99 | 1.6 | 0.98 0.13 | 2 | 15 | 24.30 | 6 | 1.3 | 2.3 | 0.13 | |
| ISO_LHSS_J105250+57260 | 10:52:50.255 | +57:26:08.20 | 1.5 | 0.98 0.13 | 4 | 19 | 11.83 | 2171 | 0.1 | -0.3 | 0.01 | star |
| ISO_LHSS_J105316+57355 | 10:53:16.641 | +57:35:51.37 | 1.8 | 0.98 0.15 | 2 | 11 | 19.01 | 603 | -0.7 | 0.5 | 0.01 | star |
| ISO_LHSS_J105308+57132 | 10:53:08.229 | +57:13:22.52 | 1.7 | 0.96 0.14 | 3 | 11 | 19.57 | 205 | -1.0 | -0.1 | 0.01 | |
| ISO_LHSS_J105413+57263 | 10:54:13.085 | +57:26:31.75 | 1.6 | 0.96 0.13 | 3 | 15 | 15.60* | 417 | 1.0 | 0.7 | 0.01 | star |
| ISO_LHSS_J104952+57082 | 10:49:52.837 | +57:08:20.30 | 1.6 | 0.96 0.13 | 4 | 14 | 20.13 | 201 | -0.7 | -1.0 | 0.01 | |
| ISO_LHSS_J105103+57431 | 10:51:03.311 | +57:43:16.93 | 1.5 | 0.96 0.13 | 4 | 18 | 19.37 | 310 | -0.4 | -0.0 | 0.01 | |
| ISO_LHSS_J105331+57340 | 10:53:31.857 | +57:34:09.57 | 1.6 | 0.95 0.13 | 4 | 15 | 15.63* | 684 | 0.1 | -0.7 | 0.01 | star |
| ISO_LHSS_J105340+57045 | 10:53:40.331 | +57:04:55.50 | 1.7 | 0.95 0.13 | 3 | 13 | 18.34 | 494 | 1.8 | 0.3 | 0.01 | |
| ISO_LHSS_J105018+57462 | 10:50:18.073 | +57:46:23.65 | 1.6 | 0.94 0.13 | 2 | 14 | 20.28 | 181 | -0.8 | -0.8 | 0.01 | |
| Source name | RA | DEC | Flux | Nfr | SNR | r’ | SNR_r | (ISO-opt) | Prob | Notes | ||
|---|---|---|---|---|---|---|---|---|---|---|---|---|
| (J2000) | (J2000) | [arcsec] | [mJy] | [mag] | [arcsec] | |||||||
| ISO_LHSS_J105456+57301 | 10:54:56.268 | +57:30:18.11 | 1.6 | 0.93 0.13 | 3 | 14 | 20.82 | 62 | -0.1 | 0.4 | 0.01 | |
| ISO_LHSS_J105335+57195 | 10:53:35.801 | +57:19:54.98 | 1.7 | 0.92 0.13 | 3 | 13 | 15.84* | 639 | -0.4 | -0.9 | 0.01 | star |
| ISO_LHSS_J104905+57130 | 10:49:05.684 | +57:13:08.08 | 1.6 | 0.92 0.13 | 2 | 14 | 19.40 | 265 | -2.4 | -0.4 | 0.01 | |
| ISO_LHSS_J105327+57093 | 10:53:27.484 | +57:09:31.15 | 1.6 | 0.92 0.13 | 4 | 14 | 20.14 | 187 | 0.0 | -0.7 | 0.01 | |
| ISO_LHSS_J105409+57101 | 10:54:09.965 | +57:10:14.08 | 1.8 | 0.91 0.14 | 2 | 10 | bridge | |||||
| ISO_LHSS_J105159+57131 | 10:51:59.769 | +57:13:11.21 | 1.9 | 0.91 0.15 | 3 | 9 | 12.14 | 1809 | -0.5 | 2.1 | 0.01 | star |
| ISO_LHSS_J105246+57174 | 10:52:46.278 | +57:17:47.67 | 1.6 | 0.90 0.12 | 3 | 14 | 20.65 | 74 | -0.5 | -0.7 | 0.01 | |
| ISO_LHSS_J105054+57353 | 10:50:54.946 | +57:35:30.81 | 1.6 | 0.90 0.12 | 2 | 14 | 22.51 | 30 | -0.3 | -1.2 | 0.01 | |
| ISO_LHSS_J104958+57133 | 10:49:58.982 | +57:13:32.36 | 1.7 | 0.90 0.13 | 3 | 12 | 12.61 | 1551 | 0.7 | 0.5 | 0.01 | star |
| ISO_LHSS_J105048+57430 | 10:50:48.351 | +57:43:04.08 | 1.7 | 0.88 0.12 | 2 | 13 | 21.31 | 65 | 0.5 | -0.2 | 0.01 | pair |
| ISO_LHSS_J105107+57455 | 10:51:07.665 | +57:45:50.41 | 1.9 | 0.88 0.14 | 1 | 9 | 24.82 | 3 | -2.6 | -2.9 | 0.34 | |
| ISO_LHSS_J105045+57082 | 10:50:45.692 | +57:08:22.83 | 1.5 | 0.88 0.11 | 5 | 19 | 21.72 | 67 | 0.4 | -0.7 | 0.01 | pair |
| ISO_LHSS_J105351+57352 | 10:53:51.119 | +57:35:27.38 | 1.6 | 0.87 0.12 | 6 | 15 | 21.99 | 44 | 0.2 | -0.6 | 0.01 | |
| ISO_LHSS_J105217+57212 | 10:52:17.765 | +57:21:27.56 | 1.6 | 0.87 0.12 | 3 | 16 | 21.79 | 64 | 1.2 | 0.2 | 0.01 | |
| ISO_LHSS_J105232+56571 | 10:52:32.307 | +56:57:17.36 | 1.8 | 0.86 0.13 | 1 | 10 | 20.65 | 139 | 2.2 | 0.8 | 0.01 | |
| ISO_LHSS_J105125+57254 | 10:51:25.078 | +57:25:43.36 | 1.6 | 0.84 0.12 | 3 | 15 | 21.92 | 54 | -3.1 | -0.9 | 0.03 | |
| ISO_LHSS_J105307+57145 | 10:53:07.885 | +57:14:59.05 | 1.7 | 0.84 0.12 | 3 | 13 | 21.68 | 34 | 0.5 | -0.8 | 0.01 | |
| ISO_LHSS_J105220+57340 | 10:52:20.826 | +57:34:07.93 | 1.6 | 0.82 0.11 | 3 | 14 | 22.91 | 19 | 0.7 | -0.7 | 0.01 | |
| ISO_LHSS_J105301+57343 | 10:53:01.436 | +57:34:30.68 | 1.7 | 0.81 0.12 | 2 | 12 | 21.97 | 44 | 0.5 | 0.3 | 0.01 | |
| ISO_LHSS_J105234+57264 | 10:52:34.944 | +57:26:45.31 | 1.7 | 0.81 0.11 | 3 | 13 | 21.17 | 136 | 1.0 | 1.8 | 0.01 | star |
| ISO_LHSS_J105029+57103 | 10:50:29.421 | +57:10:37.37 | 1.7 | 0.80 0.11 | 3 | 13 | 18.63 | 452 | -2.0 | 1.0 | 0.01 | |
| ISO_LHSS_J105211+57433 | 10:52:11.429 | +57:43:31.94 | 2.0 | 0.80 0.14 | 1 | 7 | 23.39 | 15 | -1.3 | -0.1 | 0.02 | |
| ISO_LHSS_J105312+57201 | 10:53:12.015 | +57:20:13.74 | 1.8 | 0.79 0.12 | 2 | 10 | 23.66 | 8 | 3.2 | -1.5 | 0.14 | ? |
| ISO_LHSS_J104903+57063 | 10:49:03.120 | +57:06:38.58 | 1.6 | 0.79 0.11 | 3 | 15 | 19.90 | 247 | -0.8 | 0.0 | 0.01 | |
| ISO_LHSS_J105251+57273 | 10:52:51.855 | +57:27:36.55 | 1.7 | 0.78 0.11 | 3 | 13 | 12.26 | 1809 | 0.1 | -2.1 | 0.01 | star |
| ISO_LHSS_J105149+57330 | 10:51:49.772 | +57:33:02.25 | 1.8 | 0.77 0.12 | 2 | 10 | ||||||
| ISO_LHSS_J105157+56581 | 10:51:57.352 | +56:58:10.91 | 1.9 | 0.77 0.13 | 1 | 8 | 23.66 | 10 | 0.7 | -0.3 | 0.01 | |
| ISO_LHSS_J105237+57143 | 10:52:37.482 | +57:14:33.62 | 1.7 | 0.77 0.11 | 3 | 12 | 21.17 | 82 | -0.6 | 0.2 | 0.01 | |
| ISO_LHSS_J105047+57014 | 10:50:47.681 | +57:01:45.89 | 1.9 | 0.77 0.13 | 2 | 8 | -0.3 | -2.4 | 0.01 | star | ||
| ISO_LHSS_J105440+57140 | 10:54:40.653 | +57:14:03.76 | 1.9 | 0.76 0.12 | 3 | 9 | 21.67 | 42 | 0.2 | -1.2 | 0.01 | |
| ISO_LHSS_J105304+57053 | 10:53:04.347 | +57:05:30.66 | 1.8 | 0.75 0.12 | 4 | 10 | 21.25 | 57 | -1.7 | 0.9 | 0.01 | |
| ISO_LHSS_J105034+57410 | 10:50:34.398 | +57:41:05.10 | 1.7 | 0.74 0.11 | 3 | 12 | 15.92* | 1206 | -2.1 | 0.6 | 0.01 | star |
| ISO_LHSS_J105025+57331 | 10:50:25.107 | +57:33:12.33 | 1.7 | 0.74 0.10 | 4 | 13 | 20.48 | 151 | -1.9 | -1.2 | 0.01 | |
| ISO_LHSS_J105009+57041 | 10:50:09.291 | +57:04:11.37 | 1.9 | 0.73 0.12 | 4 | 9 | 11.84 | 2171 | -0.7 | 0.4 | 0.01 | star |
| ISO_LHSS_J105306+57280 | 10:53:06.617 | +57:28:06.76 | 1.7 | 0.73 0.10 | 3 | 12 | 22.02 | 44 | -0.5 | 0.1 | 0.01 | |
| ISO_LHSS_J104940+57161 | 10:49:40.591 | +57:16:10.53 | 2.0 | 0.73 0.13 | 2 | 7 | 22.86 | 15 | 0.4 | 0.4 | 0.01 | |
| ISO_LHSS_J105404+57332 | 10:54:04.537 | +57:33:28.29 | 1.9 | 0.72 0.12 | 2 | 8 | 21.25 | 80 | -0.2 | -0.6 | 0.01 | |
| ISO_LHSS_J105410+57090 | 10:54:10.488 | +57:09:09.30 | 1.7 | 0.72 0.10 | 4 | 12 | 19.16 | 65 | 0.8 | -1.1 | 0.01 | |
| ISO_LHSS_J105019+57434 | 10:50:19.856 | +57:43:46.75 | 1.8 | 0.71 0.10 | 3 | 11 | 18.77 | 571 | -2.1 | -1.0 | 0.01 | |
| ISO_LHSS_J105231+57064 | 10:52:31.963 | +57:06:49.42 | 1.8 | 0.69 0.10 | 3 | 11 | 19.33 | 241 | 1.3 | -1.6 | 0.01 | |
| ISO_LHSS_J105435+57171 | 10:54:35.735 | +57:17:10.01 | 1.8 | 0.69 0.10 | 2 | 11 | 20.96 | 91 | -0.6 | 1.0 | 0.01 | pair |
| ISO_LHSS_J105031+57082 | 10:50:31.124 | +57:08:29.48 | 1.8 | 0.69 0.10 | 2 | 11 | 21.78 | 43 | 0.7 | 1.3 | 0.01 | |
| ISO_LHSS_J105232+57051 | 10:52:32.197 | +57:05:12.09 | 1.9 | 0.68 0.11 | 3 | 9 | 19.80 | 265 | -1.5 | -0.6 | 0.01 | |
| ISO_LHSS_J105151+56583 | 10:51:51.742 | +56:58:30.90 | 2.2 | 0.68 0.14 | 1 | 6 | 20.41 | 145 | -2.0 | 1.8 | 0.01 | |
| ISO_LHSS_J105439+57200 | 10:54:39.056 | +57:20:08.54 | 1.8 | 0.68 0.10 | 4 | 10 | 18.68* | 835 | -0.9 | -0.3 | 0.01 | star |
| ISO_LHSS_J104953+57381 | 10:49:53.936 | +57:38:14.30 | 1.9 | 0.68 0.11 | 3 | 9 | 21.87 | 48 | 1.2 | -1.6 | 0.01 | |
| ISO_LHSS_J105227+57141 | 10:52:27.561 | +57:14:13.43 | 2.1 | 0.67 0.13 | 2 | 6 | 19.85 | 247 | 1.1 | -1.9 | 0.01 | |
| ISO_LHSS_J104944+57342 | 10:49:44.938 | +57:34:23.77 | 1.7 | 0.67 0.10 | 3 | 12 | 18.63 | 339 | -1.9 | 0.1 | 0.01 | |
| ISO_LHSS_J105115+57355 | 10:51:15.168 | +57:35:51.97 | 1.7 | 0.67 0.10 | 3 | 11 | 21.63 | 22 | 1.7 | -0.5 | 0.01 | |
| ISO_LHSS_J104911+57140 | 10:49:11.598 | +57:14:09.31 | 1.9 | 0.67 0.11 | 2 | 8 | 22.26 | 34 | 0.8 | 0.2 | 0.01 | |
| ISO_LHSS_J105154+57300 | 10:51:54.199 | +57:30:08.82 | 2.0 | 0.67 0.11 | 2 | 8 | 24.73 | 5 | 1.1 | 0.1 | 0.03 | |
| ISO_LHSS_J105013+57113 | 10:50:13.132 | +57:11:39.57 | 2.0 | 0.66 0.11 | 2 | 8 | 20.44 | 136 | -1.5 | 1.4 | 0.01 | |
| ISO_LHSS_J105015+57414 | 10:50:15.535 | +57:41:40.01 | 1.9 | 0.66 0.10 | 3 | 9 | 22.73 | 18 | 0.4 | 2.2 | 0.03 | star |
| ISO_LHSS_J105257+57012 | 10:52:57.671 | +57:01:20.26 | 2.1 | 0.66 0.13 | 2 | 6 | 22.40 | 27 | 1.2 | -0.3 | 0.01 | |
| ISO_LHSS_J105110+57214 | 10:51:10.730 | +57:21:41.85 | 1.8 | 0.65 0.10 | 3 | 10 | 16.01* | 231 | -0.8 | 1.1 | 0.01 | star |
| ISO_LHSS_J105135+57274 | 10:51:35.728 | +57:27:40.86 | 1.8 | 0.65 0.10 | 4 | 10 | 22.73 | 34 | 1.7 | 1.6 | 0.03 | |
| ISO_LHSS_J105148+57380 | 10:51:48.186 | +57:38:05.49 | 1.7 | 0.65 0.09 | 4 | 12 | 21.62 | 50 | -1.4 | -1.6 | 0.01 | |
| ISO_LHSS_J105136+57300 | 10:51:36.160 | +57:30:00.37 | 1.9 | 0.64 0.10 | 3 | 9 | 21.82 | 58 | -0.1 | 0.5 | 0.01 | |
| ISO_LHSS_J105242+57004 | 10:52:42.524 | +57:00:47.96 | 1.9 | 0.64 0.10 | 3 | 9 | 22.66 | 24 | 2.9 | -0.6 | 0.05 | |
| ISO_LHSS_J105256+56594 | 10:52:56.078 | +56:59:46.91 | 1.9 | 0.64 0.11 | 3 | 8 | 18.27 | 494 | -1.8 | -0.5 | 0.01 | |
| ISO_LHSS_J105350+57091 | 10:53:50.449 | +57:09:15.24 | 1.6 | 0.64 0.09 | 5 | 15 | 19.64 | 271 | -2.0 | -0.4 | 0.01 | |
| ISO_LHSS_J104938+57130 | 10:49:38.243 | +57:13:07.84 | 1.8 | 0.63 0.09 | 4 | 11 | 19.96 | 226 | 0.5 | -0.1 | 0.01 | |
| ISO_LHSS_J105215+57263 | 10:52:15.103 | +57:26:34.89 | 1.8 | 0.63 0.10 | 6 | 10 | 19.31 | 418 | 0.6 | -0.3 | 0.01 | |
| ISO_LHSS_J105417+57002 | 10:54:17.278 | +57:00:25.17 | 1.7 | 0.63 0.09 | 4 | 12 | 19.38 | 310 | -0.8 | -0.7 | 0.01 | |
| ISO_LHSS_J105024+57141 | 10:50:24.694 | +57:14:13.53 | 1.9 | 0.63 0.10 | 3 | 9 | 18.32 | 571 | -0.6 | -1.2 | 0.01 | |
| ISO_LHSS_J105103+57203 | 10:51:03.538 | +57:20:37.94 | 1.6 | 0.62 0.09 | 5 | 14 | 19.63 | 434 | 0.7 | 0.7 | 0.01 | |
| ISO_LHSS_J105409+57012 | 10:54:09.305 | +57:01:23.37 | 1.8 | 0.62 0.10 | 3 | 10 | 20.35 | 88 | 1.5 | -0.1 | 0.01 | |
| ISO_LHSS_J105020+57424 | 10:50:20.566 | +57:42:40.42 | 1.8 | 0.62 0.10 | 3 | 10 | 21.52 | 72 | 0.7 | 0.1 | 0.01 | star |
| ISO_LHSS_J105242+57421 | 10:52:42.177 | +57:42:18.21 | 2.1 | 0.62 0.12 | 2 | 6 | 23.02 | 22 | 3.9 | 1.0 | 0.11 | |
| ISO_LHSS_J105115+57431 | 10:51:15.150 | +57:43:19.05 | 1.9 | 0.62 0.10 | 3 | 8 | 17.69 | 571 | 0.8 | 0.8 | 0.01 | |
| ISO_LHSS_J104950+57202 | 10:49:50.720 | +57:20:20.66 | 1.8 | 0.62 0.09 | 4 | 10 | 21.15 | 76 | -0.1 | 0.9 | 0.01 | |
| ISO_LHSS_J104925+57030 | 10:49:25.627 | +57:03:03.60 | 2.0 | 0.62 0.11 | 1 | 7 | 18.92 | 434 | -2.0 | 0.1 | 0.01 | |
| ISO_LHSS_J105011+57345 | 10:50:11.261 | +57:34:56.62 | 1.9 | 0.62 0.10 | 3 | 9 | 16.07* | 1357 | 1.2 | -0.7 | 0.01 | star |
| ISO_LHSS_J105417+57331 | 10:54:17.889 | +57:33:10.64 | 2.0 | 0.62 0.11 | 3 | 7 | 21.60 | 55 | -0.9 | 1.6 | 0.01 | |
| ISO_LHSS_J105104+57331 | 10:51:04.285 | +57:33:12.21 | 2.0 | 0.62 0.11 | 3 | 8 | 21.31 | 72 | 1.7 | 0.5 | 0.01 | |
| ISO_LHSS_J105505+57295 | 10:55:05.951 | +57:29:58.71 | 1.9 | 0.62 0.10 | 3 | 9 | 24.17 | 5 | -1.2 | -0.1 | 0.03 | |
| ISO_LHSS_J105218+57261 | 10:52:18.065 | +57:26:14.85 | 1.6 | 0.61 0.08 | 6 | 15 | 18.62 | 724 | 0.9 | -1.6 | 0.01 | |
| ISO_LHSS_J105339+57120 | 10:53:39.602 | +57:12:00.79 | 2.0 | 0.61 0.11 | 2 | 7 | ||||||
| ISO_LHSS_J105429+57061 | 10:54:29.539 | +57:06:11.97 | 1.9 | 0.61 0.10 | 2 | 8 | 23.95 | 40 | 0.7 | 1.1 | 0.03 | |
| ISO_LHSS_J105400+57054 | 10:54:00.776 | +57:05:48.83 | 2.1 | 0.60 0.12 | 3 | 6 | 21.68 | 24 | -2.3 | 4.3 | 0.06 | |
| ISO_LHSS_J105258+57274 | 10:52:58.187 | +57:27:49.85 | 1.9 | 0.60 0.10 | 4 | 9 | 19.39 | 418 | -1.3 | 1.0 | 0.01 | |
| ISO_LHSS_J104954+57045 | 10:49:54.320 | +57:04:56.00 | 1.7 | 0.60 0.09 | 3 | 12 | 20.23 | 157 | 0.8 | -0.1 | 0.01 | |
| ISO_LHSS_J105003+57221 | 10:50:03.823 | +57:22:13.66 | 1.9 | 0.60 0.09 | 2 | 9 | 20.77 | 102 | 0.3 | 0.3 | 0.01 | |
| ISO_LHSS_J105054+57041 | 10:50:54.371 | +57:04:15.36 | 1.9 | 0.59 0.09 | 2 | 9 | 24.97 | 3 | -0.9 | 1.4 | 0.08 | |
| ISO_LHSS_J105428+57224 | 10:54:28.359 | +57:22:48.83 | 1.8 | 0.59 0.09 | 3 | 10 | 18.42 | 679 | -1.8 | -1.0 | 0.01 | |
| ISO_LHSS_J105354+57190 | 10:53:54.357 | +57:19:06.45 | 1.9 | 0.59 0.10 | 3 | 9 | 23.53 | 11 | 0.4 | -2.5 | 0.07 | |
| ISO_LHSS_J105046+57075 | 10:50:46.351 | +57:07:54.33 | 1.7 | 0.59 0.09 | 4 | 11 | 21.28 | 62 | 0.8 | -0.6 | 0.01 | |
| ISO_LHSS_J105426+57065 | 10:54:26.646 | +57:06:55.21 | 2.0 | 0.59 0.10 | 2 | 8 | 22.45 | 18 | -1.5 | -1.4 | 0.02 | |
| ISO_LHSS_J105233+57093 | 10:52:33.424 | +57:09:35.49 | 2.0 | 0.59 0.10 | 3 | 7 | 19.25 | 339 | -0.1 | 0.1 | 0.01 | |
| ISO_LHSS_J105034+57334 | 10:50:34.186 | +57:33:45.55 | 1.8 | 0.58 0.09 | 4 | 10 | 20.64 | 157 | 0.5 | -0.2 | 0.01 | star |
| ISO_LHSS_J105028+57135 | 10:50:28.015 | +57:13:50.48 | 1.8 | 0.58 0.09 | 4 | 11 | 21.09 | 93 | 0.3 | -1.3 | 0.01 | |
| ISO_LHSS_J105315+57194 | 10:53:15.736 | +57:19:41.15 | 1.9 | 0.58 0.09 | 3 | 9 | 20.73 | 78 | 2.2 | 0.2 | 0.01 | |
| ISO_LHSS_J104941+57113 | 10:49:41.536 | +57:11:35.82 | 2.0 | 0.57 0.10 | 1 | 7 | 23.51 | 12 | -0.5 | -2.9 | 0.09 | |
| ISO_LHSS_J105041+57372 | 10:50:41.609 | +57:37:24.26 | 1.7 | 0.57 0.08 | 4 | 11 | 20.47 | 101 | -1.2 | 0.3 | 0.01 | |
| ISO_LHSS_J105112+57121 | 10:51:12.590 | +57:12:13.96 | 1.8 | 0.57 0.09 | 5 | 10 | 23.44 | 11 | -0.5 | -0.0 | 0.01 | |
| ISO_LHSS_J105000+57101 | 10:50:00.399 | +57:10:15.69 | 1.9 | 0.56 0.09 | 2 | 9 | 21.02 | 73 | 1.3 | 0.4 | 0.01 | |
| ISO_LHSS_J105112+57311 | 10:51:12.748 | +57:31:16.08 | 2.0 | 0.56 0.10 | 2 | 7 | 21.52 | 60 | 0.0 | -1.5 | 0.01 | |
| ISO_LHSS_J105157+57084 | 10:51:57.653 | +57:08:46.29 | 2.1 | 0.56 0.10 | 3 | 7 | 19.62 | 293 | -0.1 | -1.2 | 0.01 | |
| ISO_LHSS_J105022+57244 | 10:50:22.240 | +57:24:42.25 | 1.9 | 0.55 0.09 | 3 | 9 | 22.13 | 52 | 0.1 | 0.1 | 0.01 | |
| ISO_LHSS_J105133+57332 | 10:51:33.486 | +57:33:27.39 | 2.0 | 0.55 0.10 | 2 | 7 | 23.42 | 16 | -0.3 | 2.7 | 0.07 | |
| Source name | RA | DEC | Flux | Nfr | SNR | r’ | SNR_r | (ISO-opt) | Prob | Notes | ||
|---|---|---|---|---|---|---|---|---|---|---|---|---|
| (J2000) | (J2000) | [arcsec] | [mJy] | [mag] | [arcsec] | |||||||
| ISO_LHSS_J105004+57273 | 10:50:04.922 | +57:27:33.35 | 2.1 | 0.55 0.10 | 2 | 7 | 23.18 | 14 | 0.0 | -1.9 | 0.03 | |
| ISO_LHSS_J105421+57142 | 10:54:21.006 | +57:14:26.35 | 2.0 | 0.55 0.10 | 4 | 7 | 20.37 | 30 | -0.1 | 0.9 | 0.01 | |
| ISO_LHSS_J104944+57113 | 10:49:44.707 | +57:11:32.87 | 2.2 | 0.55 0.12 | 2 | 5 | 24.17 | 7 | 0.2 | -1.8 | 0.06 | |
| ISO_LHSS_J105011+57400 | 10:50:11.514 | +57:40:07.64 | 1.9 | 0.55 0.09 | 3 | 9 | 23.98 | 6 | -0.1 | 2.5 | 0.09 | |
| ISO_LHSS_J105053+57242 | 10:50:53.177 | +57:24:25.55 | 2.0 | 0.55 0.10 | 2 | 7 | 19.05 | 603 | -1.8 | -0.5 | 0.01 | |
| ISO_LHSS_J105058+57335 | 10:50:58.455 | +57:33:53.68 | 1.8 | 0.54 0.08 | 3 | 11 | 20.92 | 126 | 0.3 | -1.9 | 0.01 | star |
| ISO_LHSS_J105228+57114 | 10:52:28.011 | +57:11:46.04 | 2.0 | 0.54 0.09 | 3 | 8 | 18.37 | 517 | -1.1 | -2.5 | 0.01 | |
| ISO_LHSS_J105142+57371 | 10:51:42.590 | +57:37:12.79 | 2.1 | 0.54 0.10 | 3 | 6 | 19.00 | 236 | 0.1 | -1.8 | 0.01 | |
| ISO_LHSS_J105253+57241 | 10:52:53.741 | +57:24:17.69 | 1.9 | 0.54 0.09 | 4 | 9 | 21.65 | 63 | 0.4 | -0.2 | 0.01 | |
| ISO_LHSS_J105033+57170 | 10:50:33.245 | +57:17:02.46 | 2.0 | 0.54 0.09 | 3 | 8 | 22.19 | 30 | 0.6 | -1.3 | 0.01 | |
| ISO_LHSS_J105434+57173 | 10:54:34.871 | +57:17:37.60 | 1.9 | 0.53 0.09 | 4 | 8 | 23.39 | 14 | -1.6 | 1.4 | 0.04 | |
| ISO_LHSS_J105246+57063 | 10:52:46.930 | +57:06:36.85 | 2.0 | 0.53 0.09 | 3 | 8 | 14.88* | 452 | 1.8 | 0.1 | 0.01 | star |
| ISO_LHSS_J105255+57222 | 10:52:55.049 | +57:22:24.20 | 1.9 | 0.53 0.09 | 4 | 9 | 18.83 | 362 | -0.3 | 1.3 | 0.01 | |
| ISO_LHSS_J105142+57212 | 10:51:42.946 | +57:21:22.15 | 2.0 | 0.53 0.09 | 3 | 7 | 18.65 | 494 | -1.6 | -1.3 | 0.01 | |
| ISO_LHSS_J105344+56553 | 10:53:44.462 | +56:55:36.05 | 2.2 | 0.53 0.11 | 1 | 6 | ||||||
| ISO_LHSS_J105141+57410 | 10:51:41.448 | +57:41:09.45 | 1.8 | 0.53 0.08 | 4 | 10 | ||||||
| ISO_LHSS_J105128+57285 | 10:51:28.967 | +57:28:54.01 | 1.8 | 0.53 0.08 | 3 | 10 | 20.74 | 162 | 0.0 | 0.3 | 0.01 | |
| ISO_LHSS_J105058+57251 | 10:50:58.264 | +57:25:14.99 | 2.0 | 0.53 0.09 | 2 | 8 | 11.88 | 2171 | -0.1 | 1.9 | 0.01 | star |
| ISO_LHSS_J104929+57035 | 10:49:29.813 | +57:03:51.50 | 2.1 | 0.52 0.10 | 2 | 6 | ||||||
| ISO_LHSS_J104953+57082 | 10:49:53.126 | +57:08:29.26 | 2.0 | 0.52 0.09 | 3 | 7 | ||||||
| ISO_LHSS_J105242+57313 | 10:52:42.964 | +57:31:39.73 | 2.0 | 0.52 0.09 | 2 | 8 | 17.07 | 1551 | 0.6 | 1.9 | 0.01 | |
| ISO_LHSS_J105159+57241 | 10:51:59.927 | +57:24:11.02 | 2.0 | 0.52 0.09 | 3 | 8 | 25.26 | 3 | 3.9 | -0.1 | 0.40 | |
| ISO_LHSS_J105455+57304 | 10:54:55.591 | +57:30:48.38 | 1.9 | 0.52 0.09 | 4 | 8 | 20.90 | 113 | -1.1 | -0.1 | 0.01 | |
| ISO_LHSS_J105025+57020 | 10:50:25.170 | +57:02:08.02 | 2.3 | 0.51 0.12 | 2 | 5 | 22.82 | 17 | -2.2 | 3.3 | 0.09 | |
| ISO_LHSS_J104958+57384 | 10:49:58.616 | +57:38:44.13 | 2.0 | 0.51 0.09 | 2 | 7 | ||||||
| ISO_LHSS_J105113+57265 | 10:51:13.323 | +57:26:53.69 | 2.0 | 0.51 0.09 | 4 | 7 | 23.11 | 23 | -1.1 | -0.4 | 0.01 | |
| ISO_LHSS_J105035+57260 | 10:50:35.867 | +57:26:08.22 | 1.9 | 0.51 0.09 | 3 | 8 | 18.67 | 639 | 1.2 | 0.8 | 0.01 | |
| ISO_LHSS_J105109+57252 | 10:51:09.576 | +57:25:26.59 | 1.9 | 0.51 0.08 | 3 | 9 | 21.09 | 107 | 0.6 | 2.5 | 0.01 | |
| ISO_LHSS_J104941+57035 | 10:49:41.796 | +57:03:50.38 | 2.0 | 0.51 0.09 | 3 | 7 | 21.71 | 18 | 1.9 | 0.0 | 0.01 | |
| ISO_LHSS_J105231+57320 | 10:52:31.190 | +57:32:04.13 | 2.1 | 0.50 0.09 | 3 | 6 | 22.75 | 25 | -0.3 | -1.1 | 0.01 | star |
| ISO_LHSS_J105446+57383 | 10:54:46.263 | +57:38:30.23 | 2.2 | 0.50 0.11 | 2 | 5 | ||||||
| ISO_LHSS_J105006+57452 | 10:50:06.914 | +57:45:28.32 | 1.9 | 0.50 0.08 | 3 | 8 | 21.73 | 46 | -1.7 | 0.2 | 0.01 | |
| ISO_LHSS_J105229+57302 | 10:52:29.150 | +57:30:23.99 | 2.0 | 0.50 0.09 | 4 | 7 | 20.66 | 165 | -0.5 | 0.7 | 0.01 | star |
| ISO_LHSS_J105235+57233 | 10:52:35.182 | +57:23:31.37 | 2.1 | 0.49 0.10 | 3 | 6 | 19.95 | 302 | -0.0 | 1.9 | 0.01 | |
| ISO_LHSS_J105245+57142 | 10:52:45.923 | +57:14:23.83 | 2.0 | 0.49 0.08 | 4 | 8 | 21.15 | 98 | 0.1 | -0.5 | 0.01 | |
| ISO_LHSS_J105148+57324 | 10:51:48.794 | +57:32:48.74 | 1.9 | 0.49 0.08 | 4 | 9 | 22.26 | 22 | 0.6 | -0.1 | 0.01 | |
| ISO_LHSS_J105023+57243 | 10:50:23.577 | +57:24:37.29 | 2.0 | 0.49 0.08 | 3 | 8 | 23.50 | 15 | 1.8 | -1.7 | 0.06 | |
| ISO_LHSS_J105308+57064 | 10:53:08.221 | +57:06:45.82 | 2.0 | 0.49 0.09 | 3 | 7 | 22.07 | 27 | -0.5 | -0.1 | 0.01 | |
| ISO_LHSS_J105056+57163 | 10:50:56.781 | +57:16:30.77 | 1.7 | 0.49 0.07 | 6 | 11 | 20.80 | 121 | -1.2 | 1.1 | 0.01 | |
| ISO_LHSS_J104957+57175 | 10:49:57.601 | +57:17:59.91 | 2.0 | 0.48 0.09 | 3 | 7 | 20.20 | 178 | 1.2 | 0.6 | 0.01 | |
| ISO_LHSS_J105151+57133 | 10:51:51.207 | +57:13:31.26 | 1.7 | 0.48 0.07 | 7 | 12 | 18.83 | 418 | -1.0 | -1.3 | 0.01 | |
| ISO_LHSS_J105228+57421 | 10:52:28.824 | +57:42:14.38 | 2.0 | 0.48 0.09 | 2 | 7 | 17.12 | 1810 | 0.6 | 0.9 | 0.01 | |
| ISO_LHSS_J105236+57085 | 10:52:36.705 | +57:08:50.97 | 2.0 | 0.48 0.09 | 3 | 7 | 22.98 | 17 | 1.0 | 0.7 | 0.01 | |
| ISO_LHSS_J105235+57090 | 10:52:35.647 | +57:09:05.54 | 2.0 | 0.48 0.08 | 4 | 7 | 25.33 | |||||
| ISO_LHSS_J105155+57190 | 10:51:55.964 | +57:19:09.93 | 2.1 | 0.48 0.09 | 3 | 6 | 19.31 | 494 | -0.4 | -0.3 | 0.01 | |
| ISO_LHSS_J104946+57320 | 10:49:46.132 | +57:32:06.63 | 2.0 | 0.47 0.08 | 3 | 8 | 20.77 | 107 | -1.7 | 1.7 | 0.01 | |
| ISO_LHSS_J105112+57172 | 10:51:12.887 | +57:17:24.29 | 2.3 | 0.47 0.11 | 2 | 5 | ||||||
| ISO_LHSS_J105047+57401 | 10:50:47.421 | +57:40:17.88 | 1.9 | 0.47 0.08 | 3 | 8 | 23.52 | 10 | 0.2 | -1.5 | 0.02 | |
| ISO_LHSS_J105430+57220 | 10:54:30.322 | +57:22:09.13 | 2.0 | 0.47 0.08 | 3 | 8 | 17.39 | 1357 | -0.5 | -0.9 | 0.01 | |
| ISO_LHSS_J105249+57123 | 10:52:49.222 | +57:12:38.25 | 2.3 | 0.47 0.11 | 3 | 5 | 24.60 | 3 | 0.2 | -0.0 | 0.01 | |
| ISO_LHSS_J105251+57153 | 10:52:51.610 | +57:15:39.65 | 1.9 | 0.47 0.08 | 3 | 8 | 23.36 | 17 | 2.8 | 1.4 | 0.09 | |
| ISO_LHSS_J105355+57295 | 10:53:55.990 | +57:29:58.45 | 2.2 | 0.47 0.09 | 3 | 6 | 18.37 | 54 | -1.2 | -0.6 | 0.01 | |
| ISO_LHSS_J105100+57242 | 10:51:00.183 | +57:24:28.82 | 2.2 | 0.46 0.09 | 3 | 6 | 20.89 | 155 | -4.2 | -1.6 | 0.02 | |
| ISO_LHSS_J105328+57401 | 10:53:28.711 | +57:40:17.13 | 2.1 | 0.46 0.09 | 2 | 6 | 24.11 | 3 | 1.2 | 1.0 | 0.04 | |
| ISO_LHSS_J105305+57233 | 10:53:05.219 | +57:23:32.65 | 1.9 | 0.46 0.08 | 3 | 8 | 21.67 | 52 | -0.3 | 2.2 | 0.01 | |
| ISO_LHSS_J105219+57055 | 10:52:19.786 | +57:05:56.41 | 2.0 | 0.46 0.08 | 4 | 8 | 23.17 | 16 | 0.1 | 1.0 | 0.01 | |
| ISO_LHSS_J105442+57225 | 10:54:42.462 | +57:22:58.89 | 2.0 | 0.46 0.08 | 4 | 7 | 18.08 | 639 | -0.3 | 1.0 | 0.01 | |
| ISO_LHSS_J104923+57165 | 10:49:23.452 | +57:16:59.60 | 2.1 | 0.46 0.08 | 3 | 7 | 22.97 | 15 | -0.1 | -0.9 | 0.01 | |
| ISO_LHSS_J105019+57151 | 10:50:19.977 | +57:15:10.22 | 2.2 | 0.46 0.09 | 2 | 5 | 19.88 | 213 | -1.1 | -1.1 | 0.01 | |
-
∗
The source is saturated on the r’ image.
| Source name | RA | DEC | Flux | Nfr | SNR | r’ | SNR_r | (ISO-opt) | Prob | Notes | ||
|---|---|---|---|---|---|---|---|---|---|---|---|---|
| (J2000) | (J2000) | [arcsec] | [mJy] | [mag] | [arcsec] | |||||||
| ISO_LHSS_J105339+57310 | 10:53:39.639 | +57:31:03.35 | 2.0 | 0.45 0.08 | 4 | 8 | 19.68 | 350 | -0.6 | -1.1 | 0.01 | |
| ISO_LHSS_J105043+57172 | 10:50:43.297 | +57:17:29.61 | 2.2 | 0.45 0.10 | 2 | 5 | 18.99 | 543 | 1.4 | 2.3 | 0.01 | |
| ISO_LHSS_J105007+57280 | 10:50:07.661 | +57:28:04.44 | 2.2 | 0.45 0.09 | 4 | 5 | 21.53 | 79 | 0.0 | -2.8 | 0.02 | |
| ISO_LHSS_J104949+57165 | 10:49:49.017 | +57:16:57.18 | 2.2 | 0.45 0.10 | 2 | 5 | 19.43 | 271 | -0.3 | -0.3 | 0.01 | |
| ISO_LHSS_J105350+57294 | 10:53:50.823 | +57:29:47.20 | 2.2 | 0.45 0.09 | 3 | 5 | ||||||
| ISO_LHSS_J105215+57131 | 10:52:15.487 | +57:13:18.06 | 2.0 | 0.44 0.08 | 3 | 7 | 21.38 | 67 | 1.8 | -1.8 | 0.01 | |
| ISO_LHSS_J105056+57321 | 10:50:56.818 | +57:32:18.13 | 1.8 | 0.44 0.07 | 4 | 10 | 23.09 | 17 | 2.2 | -1.7 | 0.06 | |
| ISO_LHSS_J105249+56595 | 10:52:49.175 | +56:59:57.29 | 1.9 | 0.44 0.07 | 3 | 8 | 22.87 | 25 | 1.2 | -2.8 | 0.06 | |
| ISO_LHSS_J105314+57030 | 10:53:14.048 | +57:03:09.46 | 2.2 | 0.44 0.09 | 3 | 6 | 22.15 | 28 | -1.3 | -4.1 | 0.06 | |
| ISO_LHSS_J105121+57055 | 10:51:21.738 | +57:05:57.65 | 2.0 | 0.44 0.08 | 4 | 7 | 22.31 | 19 | -1.2 | -2.4 | 0.03 | |
| ISO_LHSS_J105410+56594 | 10:54:10.294 | +56:59:49.87 | 2.0 | 0.44 0.08 | 4 | 7 | 16.46 | 905 | -0.2 | 1.9 | 0.01 | star |
| ISO_LHSS_J105159+57015 | 10:51:59.268 | +57:01:57.02 | 2.0 | 0.44 0.08 | 4 | 8 | 23.99 | 6 | 0.1 | 0.1 | 0.01 | |
| ISO_LHSS_J105058+57254 | 10:50:58.865 | +57:25:44.92 | 2.1 | 0.44 0.08 | 4 | 7 | 19.58 | 153 | -0.6 | 0.0 | 0.01 | |
| ISO_LHSS_J105258+57092 | 10:52:58.246 | +57:09:24.70 | 2.1 | 0.43 0.08 | 4 | 6 | 17.93 | 350 | -1.0 | -0.2 | 0.01 | |
| ISO_LHSS_J105046+57105 | 10:50:46.516 | +57:10:52.29 | 2.0 | 0.43 0.07 | 2 | 8 | 20.69 | 119 | 0.0 | -2.6 | 0.01 | |
| ISO_LHSS_J105049+57252 | 10:50:49.255 | +57:25:28.12 | 2.2 | 0.43 0.09 | 2 | 5 | 18.91 | 679 | -1.1 | 0.8 | 0.01 | |
| ISO_LHSS_J105228+57294 | 10:52:28.136 | +57:29:47.23 | 2.1 | 0.43 0.09 | 3 | 6 | 23.14 | 14 | -2.7 | 1.4 | 0.07 | ? |
| ISO_LHSS_J105328+57304 | 10:53:28.608 | +57:30:49.81 | 2.3 | 0.43 0.10 | 2 | 5 | ? | |||||
| ISO_LHSS_J105101+57034 | 10:51:01.285 | +57:03:42.32 | 1.9 | 0.43 0.07 | 4 | 9 | 12.61 | 1551 | -1.6 | 0.3 | 0.01 | star |
| ISO_LHSS_J104938+57090 | 10:49:38.529 | +57:09:01.72 | 2.0 | 0.43 0.07 | 3 | 8 | 22.05 | 38 | -0.7 | -1.7 | 0.01 | |
| ISO_LHSS_J105308+57172 | 10:53:08.961 | +57:17:22.34 | 2.0 | 0.43 0.08 | 4 | 7 | 20.85 | 63 | 0.1 | 1.1 | 0.01 | |
| ISO_LHSS_J105137+57055 | 10:51:37.075 | +57:05:51.99 | 2.0 | 0.43 0.07 | 3 | 8 | 21.06 | 85 | -0.8 | -2.4 | 0.01 | |
| ISO_LHSS_J105258+57403 | 10:52:58.517 | +57:40:32.24 | 2.3 | 0.43 0.10 | 3 | 5 | 23.29 | 6 | 0.0 | 0.5 | 0.01 | |
| ISO_LHSS_J105201+57071 | 10:52:01.384 | +57:07:18.04 | 2.0 | 0.43 0.07 | 6 | 8 | 19.48 | 170 | 1.1 | -1.0 | 0.01 | |
| ISO_LHSS_J105218+57260 | 10:52:18.896 | +57:26:01.69 | 2.2 | 0.43 0.09 | 3 | 5 | 23.05 | 47 | -2.5 | -3.0 | 0.11 | ? |
| ISO_LHSS_J104918+57145 | 10:49:18.245 | +57:14:56.35 | 2.3 | 0.43 0.10 | 2 | 5 | ||||||
| ISO_LHSS_J105232+57215 | 10:52:32.457 | +57:21:57.70 | 2.1 | 0.43 0.08 | 3 | 6 | 21.06 | 128 | 1.0 | 0.6 | 0.01 | |
| ISO_LHSS_J105117+57142 | 10:51:17.834 | +57:14:24.65 | 2.0 | 0.42 0.07 | 4 | 7 | 22.05 | 35 | -0.5 | -0.3 | 0.01 | |
| ISO_LHSS_J104952+57263 | 10:49:52.628 | +57:26:36.59 | 1.9 | 0.42 0.07 | 4 | 8 | 21.73 | 0.9 | -0.9 | |||
| ISO_LHSS_J105044+57172 | 10:50:44.718 | +57:17:24.68 | 2.1 | 0.42 0.08 | 3 | 6 | 23.42 | 15 | -2.1 | 1.7 | 0.07 | |
| ISO_LHSS_J105224+57224 | 10:52:24.979 | +57:22:45.86 | 1.9 | 0.42 0.07 | 5 | 9 | 21.50 | 106 | -1.8 | -1.2 | 0.01 | star |
| ISO_LHSS_J105147+57085 | 10:51:47.190 | +57:08:55.08 | 2.0 | 0.42 0.07 | 7 | 8 | 18.56 | 350 | 1.4 | 1.7 | 0.01 | |
| ISO_LHSS_J105152+57244 | 10:51:52.108 | +57:24:47.29 | 2.2 | 0.41 0.09 | 2 | 5 | 21.07 | 145 | 0.1 | -1.9 | 0.01 | star |
| ISO_LHSS_J105421+57380 | 10:54:21.262 | +57:38:03.84 | 2.1 | 0.41 0.08 | 3 | 6 | 23.27 | 17 | -0.8 | 1.7 | 0.03 | |
| ISO_LHSS_J104900+57071 | 10:49:00.289 | +57:07:16.39 | 2.1 | 0.41 0.08 | 3 | 6 | 24.49 | 4 | -3.3 | -1.3 | 0.25 | |
| ISO_LHSS_J105242+57125 | 10:52:42.550 | +57:12:51.43 | 2.3 | 0.41 0.10 | 2 | 5 | 23.40 | 14 | 2.3 | -1.5 | 0.07 | |
| ISO_LHSS_J105049+57031 | 10:50:49.274 | +57:03:13.70 | 2.3 | 0.41 0.10 | 4 | 5 | 20.41 | 86 | -1.2 | 2.2 | 0.01 | |
| ISO_LHSS_J105412+57121 | 10:54:12.184 | +57:12:10.30 | 2.0 | 0.41 0.07 | 3 | 7 | 24.28 | 6 | -3.6 | 1.7 | 0.26 | |
| ISO_LHSS_J105436+57202 | 10:54:36.793 | +57:20:27.74 | 2.2 | 0.41 0.09 | 3 | 5 | 25.78 | 3 | -1.2 | 1.3 | 0.11 | |
| ISO_LHSS_J105339+57010 | 10:53:39.463 | +57:01:04.68 | 2.2 | 0.41 0.09 | 3 | 5 | 17.45 | 452 | -0.7 | 0.7 | 0.01 | |
| ISO_LHSS_J105050+57084 | 10:50:50.087 | +57:08:45.19 | 2.3 | 0.41 0.10 | 3 | 5 | 24.72 | 3 | -0.4 | -2.0 | 0.10 | |
| ISO_LHSS_J105423+57194 | 10:54:23.331 | +57:19:48.43 | 2.0 | 0.41 0.07 | 4 | 8 | 25.29 | 4 | -1.0 | 1.2 | 0.08 | |
| ISO_LHSS_J105439+57382 | 10:54:39.474 | +57:38:24.49 | 2.2 | 0.41 0.09 | 3 | 5 | 24.33 | 3 | 1.7 | -1.6 | 0.10 | |
| ISO_LHSS_J105111+57331 | 10:51:11.906 | +57:33:12.55 | 2.1 | 0.40 0.08 | 2 | 6 | 18.97 | 418 | 0.0 | -2.1 | 0.01 | |
| ISO_LHSS_J105154+57343 | 10:51:54.529 | +57:34:37.43 | 2.1 | 0.40 0.07 | 3 | 7 | 20.69 | 149 | 1.4 | -0.4 | 0.01 | star |
| ISO_LHSS_J105501+57361 | 10:55:01.729 | +57:36:17.26 | 2.2 | 0.40 0.08 | 3 | 6 | ||||||
| ISO_LHSS_J105008+57032 | 10:50:08.577 | +57:03:22.64 | 2.2 | 0.40 0.08 | 3 | 6 | ||||||
| ISO_LHSS_J105240+57305 | 10:52:40.085 | +57:30:56.61 | 2.2 | 0.40 0.08 | 5 | 5 | 23.30 | 12 | 3.0 | 1.5 | 0.10 | ? |
| ISO_LHSS_J105459+57264 | 10:54:59.923 | +57:26:46.32 | 2.0 | 0.40 0.07 | 3 | 7 | 23.83 | 13 | -0.2 | -2.0 | 0.06 | |
| ISO_LHSS_J104952+57173 | 10:49:52.830 | +57:17:36.32 | 2.0 | 0.40 0.07 | 4 | 8 | 22.77 | 16 | 2.2 | -1.5 | 0.04 | |
| ISO_LHSS_J105049+57290 | 10:50:49.596 | +57:29:02.61 | 2.0 | 0.40 0.07 | 3 | 7 | ||||||
| ISO_LHSS_J105006+57145 | 10:50:06.423 | +57:14:55.23 | 2.0 | 0.40 0.07 | 3 | 7 | 23.20 | 11 | -1.0 | -2.9 | 0.08 | |
| ISO_LHSS_J105454+57362 | 10:54:54.265 | +57:36:29.97 | 2.0 | 0.39 0.07 | 4 | 7 | ||||||
| ISO_LHSS_J105308+56594 | 10:53:08.134 | +56:59:40.77 | 2.2 | 0.39 0.08 | 3 | 5 | 21.15 | 59 | -1.4 | -0.6 | 0.01 | |
| ISO_LHSS_J105252+57160 | 10:52:52.903 | +57:16:02.28 | 2.1 | 0.39 0.08 | 4 | 6 | 20.62 | 170 | -0.9 | -1.0 | 0.01 | |
| ISO_LHSS_J105223+57055 | 10:52:23.115 | +57:05:58.14 | 2.3 | 0.39 0.09 | 3 | 5 | 23.73 | 8 | 0.0 | -1.7 | 0.04 | |
| ISO_LHSS_J104920+57031 | 10:49:20.680 | +57:03:18.00 | 2.3 | 0.39 0.09 | 1 | 5 | 24.83 | 4 | -1.4 | -0.2 | 0.06 | |
| ISO_LHSS_J105447+57222 | 10:54:47.260 | +57:22:20.36 | 2.2 | 0.39 0.08 | 3 | 6 | ||||||
| ISO_LHSS_J105125+57354 | 10:51:25.649 | +57:35:42.87 | 2.1 | 0.39 0.07 | 3 | 7 | 15.62 | 2714 | -0.2 | -1.3 | 0.01 | |
| ISO_LHSS_J105442+57340 | 10:54:42.393 | +57:34:03.99 | 2.1 | 0.39 0.07 | 4 | 6 | 23.93 | 6 | -3.2 | -2.0 | 0.20 | |
| ISO_LHSS_J105235+57063 | 10:52:35.819 | +57:06:32.10 | 2.1 | 0.39 0.07 | 3 | 6 | 23.90 | 6 | 0.9 | -0.6 | 0.02 | |
| ISO_LHSS_J105255+57115 | 10:52:55.668 | +57:11:51.12 | 2.2 | 0.38 0.08 | 3 | 5 | 21.40 | 56 | -0.1 | 2.2 | 0.01 | |
| ISO_LHSS_J105249+57272 | 10:52:49.900 | +57:27:23.64 | 2.3 | 0.38 0.09 | 2 | 5 | 22.79 | 9 | 1.4 | 3.3 | 0.07 | |
| ISO_LHSS_J105247+57362 | 10:52:47.743 | +57:36:20.10 | 1.9 | 0.38 0.06 | 7 | 9 | 17.87 | 1357 | -0.9 | -0.5 | 0.01 | |
| ISO_LHSS_J104927+57115 | 10:49:27.169 | +57:11:54.25 | 2.2 | 0.38 0.08 | 3 | 5 | 25.02 | 3 | 0.4 | 2.0 | 0.12 | |
| ISO_LHSS_J105033+57391 | 10:50:33.798 | +57:39:14.85 | 2.0 | 0.38 0.07 | 4 | 7 | 22.23 | 39 | -2.3 | 1.2 | 0.02 | star |
| ISO_LHSS_J105329+56570 | 10:53:29.019 | +56:57:06.86 | 2.3 | 0.38 0.09 | 2 | 5 | 24.11 | 6 | 2.6 | 1.3 | 0.13 | |
| ISO_LHSS_J105442+57300 | 10:54:42.594 | +57:30:02.44 | 2.2 | 0.38 0.08 | 3 | 5 | 23.29 | 12 | 0.3 | 1.1 | 0.01 | |
| ISO_LHSS_J105159+57014 | 10:51:59.022 | +57:01:41.79 | 2.3 | 0.38 0.08 | 3 | 5 | ||||||
| ISO_LHSS_J104958+57305 | 10:49:58.169 | +57:30:53.09 | 2.1 | 0.38 0.07 | 3 | 6 | 24.91 | 4 | -1.0 | -1.2 | 0.07 | |
| ISO_LHSS_J105226+57290 | 10:52:26.276 | +57:29:06.58 | 2.1 | 0.38 0.07 | 3 | 6 | ? | |||||
| ISO_LHSS_J105037+57304 | 10:50:37.042 | +57:30:40.00 | 2.0 | 0.38 0.07 | 5 | 7 | 21.12 | 103 | -1.9 | -1.4 | 0.01 | |
| ISO_LHSS_J104954+57031 | 10:49:54.023 | +57:03:12.89 | 2.2 | 0.38 0.08 | 2 | 6 | 24.96 | 3 | 1.2 | 2.1 | 0.15 | |
| ISO_LHSS_J105103+57093 | 10:51:03.472 | +57:09:36.88 | 2.0 | 0.37 0.07 | 3 | 7 | 21.25 | 82 | -1.2 | -1.8 | 0.01 | |
| ISO_LHSS_J105231+57155 | 10:52:31.395 | +57:15:50.34 | 2.1 | 0.37 0.07 | 4 | 6 | 13.12 | 1085 | 0.4 | -3.4 | 0.01 | star |
| ISO_LHSS_J105041+57302 | 10:50:41.693 | +57:30:20.08 | 2.3 | 0.37 0.09 | 3 | 5 | 21.83 | 54 | 2.0 | -1.4 | 0.02 | |
| ISO_LHSS_J105240+57160 | 10:52:40.415 | +57:16:02.99 | 2.2 | 0.37 0.08 | 3 | 5 | 22.42 | 35 | 0.6 | 3.2 | 0.05 | |
| ISO_LHSS_J105302+57360 | 10:53:02.076 | +57:36:09.36 | 2.2 | 0.37 0.08 | 3 | 6 | 22.88 | 17 | -1.2 | -3.5 | 0.08 | |
| ISO_LHSS_J105126+57423 | 10:51:26.635 | +57:42:35.52 | 2.1 | 0.37 0.07 | 4 | 6 | 14.77 | 3619 | -3.7 | -0.9 | 0.01 | |
| ISO_LHSS_J104954+57313 | 10:49:54.379 | +57:31:39.55 | 2.3 | 0.37 0.09 | 3 | 5 | 23.87 | 3 | 0.4 | -1.5 | 0.03 | |
| ISO_LHSS_J105329+57182 | 10:53:29.696 | +57:18:22.60 | 2.2 | 0.37 0.07 | 3 | 6 | 21.42 | 69 | 0.3 | 2.2 | 0.01 | |
| ISO_LHSS_J105058+57185 | 10:50:58.315 | +57:18:59.04 | 2.3 | 0.37 0.09 | 3 | 5 | ? | |||||
| ISO_LHSS_J105336+57005 | 10:53:36.427 | +57:00:59.07 | 2.2 | 0.36 0.07 | 4 | 5 | 22.16 | 28 | 3.3 | 1.5 | 0.05 | |
| ISO_LHSS_J105218+57102 | 10:52:18.219 | +57:10:25.97 | 2.2 | 0.36 0.07 | 4 | 6 | 21.48 | 54 | 0.0 | -0.2 | 0.01 | |
| ISO_LHSS_J105008+57251 | 10:50:08.815 | +57:25:12.01 | 2.1 | 0.36 0.07 | 5 | 6 | ||||||
| ISO_LHSS_J105309+57334 | 10:53:09.899 | +57:33:46.65 | 2.2 | 0.36 0.07 | 4 | 5 | 23.07 | 8 | -1.1 | 2.3 | 0.05 | |
| ISO_LHSS_J105050+57381 | 10:50:50.336 | +57:38:19.34 | 2.2 | 0.36 0.07 | 3 | 6 | 19.04 | 603 | 1.6 | -0.8 | 0.01 | star |
| ISO_LHSS_J105236+57310 | 10:52:36.207 | +57:31:03.12 | 2.0 | 0.36 0.06 | 3 | 7 | 21.04 | 91 | -0.6 | -0.9 | 0.01 | |
| ISO_LHSS_J105220+57134 | 10:52:20.662 | +57:13:47.13 | 2.3 | 0.36 0.08 | 3 | 5 | 24.89 | 4 | 0.2 | -1.7 | 0.08 | |
| ISO_LHSS_J105314+57193 | 10:53:14.095 | +57:19:33.05 | 2.2 | 0.36 0.08 | 3 | 5 | 22.09 | 11 | -2.7 | -1.1 | 0.03 | |
| ISO_LHSS_J105249+57391 | 10:52:49.757 | +57:39:14.47 | 2.1 | 0.35 0.07 | 4 | 6 | ||||||
| ISO_LHSS_J105104+57425 | 10:51:04.991 | +57:42:57.02 | 2.1 | 0.35 0.07 | 4 | 6 | ||||||
| ISO_LHSS_J105104+57273 | 10:51:04.548 | +57:27:38.58 | 2.2 | 0.35 0.07 | 4 | 6 | 20.49 | 217 | 0.7 | 1.5 | 0.01 | |
| ISO_LHSS_J104953+57401 | 10:49:53.372 | +57:40:12.50 | 2.2 | 0.35 0.07 | 3 | 6 | 22.89 | 17 | -1.8 | 0.6 | 0.02 | |
| ISO_LHSS_J105348+57193 | 10:53:48.420 | +57:19:31.55 | 2.3 | 0.35 0.08 | 3 | 5 | ||||||
| ISO_LHSS_J105110+57160 | 10:51:10.613 | +57:16:03.72 | 2.1 | 0.35 0.06 | 3 | 7 | 20.78 | 113 | -1.5 | 1.3 | 0.01 | |
| ISO_LHSS_J105016+57413 | 10:50:16.370 | +57:41:35.89 | 2.0 | 0.35 0.06 | 4 | 7 | 23.64 | 7 | -3.5 | -0.1 | 0.14 | |
| ISO_LHSS_J105150+57412 | 10:51:50.043 | +57:41:23.32 | 2.1 | 0.35 0.07 | 3 | 6 | 20.11 | 61 | 0.0 | -1.8 | 0.01 | |
| ISO_LHSS_J105027+57281 | 10:50:27.803 | +57:28:16.58 | 2.2 | 0.35 0.08 | 3 | 5 | 19.84 | 1206 | -1.7 | -1.9 | 0.01 | star |
| Source name | RA | DEC | Flux | Nfr | SNR | r’ | SNR_r | (ISO-opt) | Prob | Notes | ||
|---|---|---|---|---|---|---|---|---|---|---|---|---|
| (J2000) | (J2000) | [arcsec] | [mJy] | [mag] | [arcsec] | |||||||
| ISO_LHSS_J105245+57074 | 10:52:45.476 | +57:07:47.55 | 2.1 | 0.35 0.07 | 6 | 6 | 18.49 | 517 | 1.9 | 0.0 | 0.01 | |
| ISO_LHSS_J105018+57431 | 10:50:18.618 | +57:43:19.24 | 2.2 | 0.35 0.07 | 3 | 5 | 22.78 | 23 | -2.4 | 1.3 | 0.04 | |
| ISO_LHSS_J105426+57072 | 10:54:26.649 | +57:07:26.17 | 2.2 | 0.34 0.07 | 4 | 5 | ||||||
| ISO_LHSS_J105349+57264 | 10:53:49.127 | +57:26:44.91 | 2.2 | 0.34 0.07 | 3 | 5 | ||||||
| ISO_LHSS_J105036+57054 | 10:50:36.548 | +57:05:45.84 | 2.2 | 0.34 0.07 | 3 | 5 | 24.49 | 5 | 0.1 | -0.5 | 0.01 | |
| ISO_LHSS_J105013+57403 | 10:50:13.085 | +57:40:38.95 | 2.1 | 0.34 0.07 | 3 | 6 | 24.48 | 4 | 2.3 | -2.1 | 0.20 | |
| ISO_LHSS_J105139+57224 | 10:51:39.690 | +57:22:48.84 | 2.0 | 0.34 0.06 | 4 | 7 | ? | |||||
| ISO_LHSS_J105038+57114 | 10:50:38.298 | +57:11:42.60 | 2.3 | 0.34 0.08 | 4 | 5 | 24.45 | 5 | 0.5 | 0.2 | 0.01 | |
| ISO_LHSS_J105039+57233 | 10:50:39.738 | +57:23:36.40 | 2.1 | 0.34 0.07 | 4 | 6 | 19.26 | 724 | 1.5 | -0.3 | 0.01 | star |
| ISO_LHSS_J105400+57162 | 10:54:00.070 | +57:16:20.01 | 2.2 | 0.34 0.07 | 3 | 6 | 23.18 | 11 | 0.2 | -1.6 | 0.02 | |
| ISO_LHSS_J105237+57214 | 10:52:37.581 | +57:21:48.38 | 2.3 | 0.34 0.08 | 3 | 5 | 21.01 | 123 | 1.7 | -0.0 | 0.01 | |
| ISO_LHSS_J105033+57403 | 10:50:33.600 | +57:40:30.18 | 2.3 | 0.34 0.08 | 2 | 5 | 24.12 | 3 | -3.7 | -0.6 | 0.22 | |
| ISO_LHSS_J105300+57134 | 10:53:00.912 | +57:13:41.80 | 2.3 | 0.34 0.08 | 3 | 5 | 2.7 | -0.6 | 0.01 | star | ||
| ISO_LHSS_J105104+57054 | 10:51:04.417 | +57:05:46.01 | 2.3 | 0.34 0.08 | 2 | 5 | 22.59 | 26 | 2.9 | 3.1 | 0.09 | |
| ISO_LHSS_J105303+56580 | 10:53:03.501 | +56:58:00.54 | 2.2 | 0.34 0.07 | 3 | 5 | 22.48 | 20 | 0.4 | -0.3 | 0.01 | |
| ISO_LHSS_J105052+57101 | 10:50:52.690 | +57:10:19.48 | 2.2 | 0.34 0.07 | 4 | 6 | 23.72 | 9 | -0.5 | 0.6 | 0.01 | |
| ISO_LHSS_J105006+57170 | 10:50:06.127 | +57:17:01.74 | 2.3 | 0.34 0.08 | 4 | 5 | 20.39 | 119 | 0.2 | -0.1 | 0.01 | |
| ISO_LHSS_J104932+57174 | 10:49:32.736 | +57:17:43.93 | 2.0 | 0.34 0.06 | 3 | 7 | 20.72 | 139 | 1.0 | -1.6 | 0.01 | |
| ISO_LHSS_J105311+57023 | 10:53:11.832 | +57:02:38.00 | 2.2 | 0.34 0.07 | 4 | 5 | 23.20 | 14 | -0.0 | -2.5 | 0.05 | |
| ISO_LHSS_J105047+57185 | 10:50:47.776 | +57:18:54.70 | 2.1 | 0.34 0.07 | 3 | 6 | 22.74 | 33 | -0.4 | 0.1 | 0.01 | |
| ISO_LHSS_J105117+57124 | 10:51:17.479 | +57:12:49.13 | 2.1 | 0.33 0.07 | 3 | 6 | ? | |||||
| ISO_LHSS_J104943+57110 | 10:49:43.945 | +57:11:07.19 | 2.2 | 0.33 0.07 | 3 | 5 | 21.24 | 54 | 1.6 | 0.5 | 0.01 | |
| ISO_LHSS_J105239+57312 | 10:52:39.016 | +57:31:24.36 | 2.3 | 0.33 0.07 | 4 | 5 | 21.25 | 98 | 3.2 | 0.1 | 0.02 | |
| ISO_LHSS_J105054+57164 | 10:50:54.749 | +57:16:40.66 | 2.1 | 0.33 0.06 | 4 | 6 | 21.75 | 60 | -1.1 | 0.2 | 0.01 | star |
| ISO_LHSS_J105030+57055 | 10:50:30.249 | +57:05:56.59 | 2.2 | 0.33 0.07 | 3 | 5 | ||||||
| ISO_LHSS_J105012+57034 | 10:50:12.935 | +57:03:48.38 | 2.2 | 0.33 0.07 | 3 | 5 | 25.70 | 3 | 1.8 | -0.4 | 0.11 | |
| ISO_LHSS_J105135+57255 | 10:51:35.713 | +57:25:52.22 | 2.2 | 0.33 0.07 | 4 | 5 | 21.34 | 119 | -1.5 | -1.4 | 0.01 | |
| ISO_LHSS_J105443+57355 | 10:54:43.557 | +57:35:54.30 | 2.3 | 0.33 0.07 | 4 | 5 | 24.93 | 3 | 2.7 | 1.4 | 0.24 | |
| ISO_LHSS_J105304+57093 | 10:53:04.270 | +57:09:32.51 | 2.2 | 0.32 0.07 | 2 | 5 | 21.84 | 43 | 1.8 | -3.9 | 0.05 | |
| ISO_LHSS_J105051+57292 | 10:50:51.013 | +57:29:23.54 | 2.1 | 0.32 0.06 | 3 | 6 | 20.04 | 286 | -2.0 | 0.1 | 0.01 | |
| ISO_LHSS_J105135+57251 | 10:51:35.966 | +57:25:12.54 | 2.1 | 0.32 0.06 | 3 | 6 | 23.50 | 17 | -1.2 | -3.1 | 0.12 | |
| ISO_LHSS_J105155+57163 | 10:51:55.313 | +57:16:34.44 | 2.0 | 0.32 0.06 | 5 | 7 | 25.08 | 3 | 3.1 | -0.7 | 0.27 | ? |
| ISO_LHSS_J105147+57075 | 10:51:47.157 | +57:07:57.30 | 2.2 | 0.32 0.06 | 7 | 6 | 21.96 | 31 | 1.0 | -1.8 | 0.01 | |
| ISO_LHSS_J105010+57130 | 10:50:10.320 | +57:13:03.24 | 2.0 | 0.32 0.06 | 5 | 7 | 20.19 | 145 | -0.2 | 2.2 | 0.01 | |
| ISO_LHSS_J105154+57233 | 10:51:54.192 | +57:23:32.47 | 2.3 | 0.32 0.07 | 4 | 5 | 20.93 | 149 | 1.6 | -0.7 | 0.01 | |
| ISO_LHSS_J105029+57300 | 10:50:29.073 | +57:30:05.07 | 2.2 | 0.32 0.07 | 3 | 5 | 21.32 | 79 | -1.7 | -1.8 | 0.01 | |
| ISO_LHSS_J105219+57292 | 10:52:19.332 | +57:29:23.31 | 2.2 | 0.32 0.06 | 6 | 6 | 21.70 | 62 | 0.7 | 0.8 | 0.01 | |
| ISO_LHSS_J105340+57300 | 10:53:40.712 | +57:30:01.54 | 2.2 | 0.32 0.07 | 5 | 5 | 23.06 | 19 | -0.1 | 1.4 | 0.01 | |
| ISO_LHSS_J104931+57114 | 10:49:31.923 | +57:11:47.48 | 2.3 | 0.32 0.07 | 3 | 5 | ||||||
| ISO_LHSS_J104926+57200 | 10:49:26.624 | +57:20:09.86 | 2.2 | 0.31 0.07 | 4 | 5 | 21.98 | 32 | -0.7 | 0.4 | 0.01 | |
| ISO_LHSS_J105059+57242 | 10:50:59.103 | +57:24:25.36 | 2.3 | 0.31 0.07 | 3 | 5 | 12.61 | 1551 | -1.3 | -1.3 | 0.01 | star |
| ISO_LHSS_J105143+57290 | 10:51:43.989 | +57:29:05.86 | 2.1 | 0.31 0.06 | 4 | 6 | 21.38 | 101 | -1.9 | -0.6 | 0.01 | |
| ISO_LHSS_J105217+57405 | 10:52:17.417 | +57:40:50.56 | 1.9 | 0.31 0.05 | 5 | 8 | 22.33 | 37 | -0.1 | -3.5 | 0.05 | star |
| ISO_LHSS_J105458+57284 | 10:54:58.920 | +57:28:44.74 | 2.2 | 0.31 0.07 | 4 | 5 | 24.87 | 4 | 2.1 | -0.5 | 0.13 | |
| ISO_LHSS_J105232+57244 | 10:52:32.029 | +57:24:47.75 | 2.2 | 0.31 0.07 | 4 | 5 | 21.74 | 73 | 1.3 | -3.1 | 0.03 | |
| ISO_LHSS_J105321+57131 | 10:53:21.742 | +57:13:14.37 | 2.3 | 0.31 0.07 | 4 | 5 | ||||||
| ISO_LHSS_J105141+57160 | 10:51:41.136 | +57:16:03.91 | 2.3 | 0.31 0.07 | 3 | 5 | ||||||
| ISO_LHSS_J105027+57440 | 10:50:27.209 | +57:44:04.44 | 2.2 | 0.31 0.07 | 4 | 5 | 23.26 | 13 | 3.6 | 1.3 | 0.12 | |
| ISO_LHSS_J105117+57163 | 10:51:17.692 | +57:16:39.87 | 2.0 | 0.31 0.05 | 5 | 8 | 21.83 | 51 | 0.4 | 0.5 | 0.01 | ? |
| ISO_LHSS_J104945+57345 | 10:49:45.663 | +57:34:57.77 | 2.2 | 0.31 0.06 | 3 | 6 | 24.91 | 4 | 0.3 | -3.5 | 0.30 | |
| ISO_LHSS_J105330+57284 | 10:53:30.326 | +57:28:40.10 | 2.2 | 0.31 0.07 | 4 | 5 | ||||||
| ISO_LHSS_J104955+57282 | 10:49:55.338 | +57:28:22.00 | 2.2 | 0.31 0.07 | 4 | 5 | 22.72 | 19 | 1.3 | -1.6 | 0.02 | |
| ISO_LHSS_J105141+57115 | 10:51:41.246 | +57:11:50.12 | 2.3 | 0.31 0.07 | 4 | 5 | 21.03 | 72 | -0.1 | 0.5 | 0.01 | |
| ISO_LHSS_J105315+57182 | 10:53:15.223 | +57:18:26.43 | 2.3 | 0.31 0.07 | 3 | 5 | 21.08 | 34 | 0.4 | -1.5 | 0.01 | |
| ISO_LHSS_J105318+57284 | 10:53:18.640 | +57:28:49.77 | 2.3 | 0.31 0.07 | 6 | 5 | 20.48 | 101 | -0.1 | -1.5 | 0.01 | ? |
| ISO_LHSS_J105058+57182 | 10:50:58.019 | +57:18:25.42 | 2.2 | 0.31 0.06 | 4 | 5 | 20.35 | 226 | 0.8 | -2.6 | 0.01 | |
| ISO_LHSS_J105004+57085 | 10:50:04.545 | +57:08:51.64 | 2.2 | 0.30 0.06 | 6 | 6 | 22.16 | 23 | -1.1 | -0.2 | 0.01 | |
| ISO_LHSS_J105123+57122 | 10:51:23.317 | +57:12:26.59 | 2.2 | 0.30 0.06 | 4 | 5 | 24.56 | 4 | -2.8 | 0.3 | 0.17 | |
| ISO_LHSS_J105223+57085 | 10:52:23.727 | +57:08:55.27 | 2.2 | 0.30 0.07 | 3 | 5 | ||||||
| ISO_LHSS_J104957+57275 | 10:49:57.524 | +57:27:58.23 | 2.3 | 0.30 0.07 | 3 | 5 | 21.06 | 79 | 0.2 | 0.5 | 0.01 | star |
| ISO_LHSS_J105325+57074 | 10:53:25.052 | +57:07:41.36 | 2.2 | 0.30 0.06 | 4 | 5 | ||||||
| ISO_LHSS_J104930+57115 | 10:49:30.857 | +57:11:57.05 | 2.3 | 0.30 0.07 | 2 | 5 | ||||||
| ISO_LHSS_J105048+57022 | 10:50:48.461 | +57:02:22.99 | 2.2 | 0.30 0.06 | 3 | 6 | 24.55 | 4 | 2.0 | -1.8 | 0.16 | |
| ISO_LHSS_J105132+57111 | 10:51:32.571 | +57:11:11.14 | 2.2 | 0.30 0.06 | 5 | 6 | 21.94 | 56 | 2.6 | 0.2 | 0.02 | |
| ISO_LHSS_J105120+57300 | 10:51:20.065 | +57:30:02.31 | 2.1 | 0.30 0.06 | 6 | 6 | ||||||
| ISO_LHSS_J104921+57100 | 10:49:21.910 | +57:10:09.80 | 2.1 | 0.30 0.06 | 4 | 6 | ||||||
| ISO_LHSS_J105154+57133 | 10:51:54.056 | +57:13:30.15 | 2.3 | 0.30 0.07 | 6 | 5 | 25.01 | 4 | 0.5 | -1.1 | 0.05 | |
| ISO_LHSS_J105255+57110 | 10:52:55.005 | +57:11:06.05 | 2.2 | 0.29 0.06 | 3 | 5 | 23.26 | 14 | -2.4 | -0.8 | 0.05 | ? |
| ISO_LHSS_J105101+57195 | 10:51:01.121 | +57:19:54.64 | 2.1 | 0.29 0.06 | 5 | 6 | 21.89 | 49 | 0.6 | 1.4 | 0.01 | |
| ISO_LHSS_J104953+57284 | 10:49:53.511 | +57:28:41.23 | 2.3 | 0.29 0.07 | 4 | 5 | 22.39 | 31 | 0.9 | -0.4 | 0.01 | |
| ISO_LHSS_J105350+57353 | 10:53:50.786 | +57:35:37.50 | 2.1 | 0.29 0.06 | 6 | 6 | 23.49 | 12 | 1.7 | 3.3 | 0.14 | |
| ISO_LHSS_J105245+57211 | 10:52:45.985 | +57:21:11.74 | 2.3 | 0.29 0.07 | 4 | 5 | ? | |||||
| ISO_LHSS_J105102+57145 | 10:51:02.439 | +57:14:59.63 | 2.3 | 0.29 0.07 | 2 | 5 | ||||||
| ISO_LHSS_J105043+57062 | 10:50:43.612 | +57:06:27.89 | 2.2 | 0.29 0.06 | 3 | 5 | 24.19 | 3 | 1.8 | 2.3 | 0.15 | |
| ISO_LHSS_J105024+57142 | 10:50:24.507 | +57:14:24.39 | 2.3 | 0.29 0.07 | 3 | 5 | 21.63 | 47 | 2.9 | 0.8 | 0.02 | |
| ISO_LHSS_J105502+57322 | 10:55:02.677 | +57:32:25.28 | 2.3 | 0.29 0.07 | 4 | 5 | 20.23 | 97 | 3.4 | -1.0 | 0.01 | |
| ISO_LHSS_J105101+57095 | 10:51:01.630 | +57:09:53.84 | 2.3 | 0.29 0.06 | 3 | 5 | 24.35 | 6 | -0.8 | -3.1 | 0.19 | |
| ISO_LHSS_J105129+57163 | 10:51:29.656 | +57:16:39.92 | 2.2 | 0.29 0.06 | 4 | 5 | 23.58 | 11 | 1.9 | -0.3 | 0.04 | |
| ISO_LHSS_J105234+57182 | 10:52:34.156 | +57:18:26.56 | 2.3 | 0.29 0.07 | 4 | 5 | 22.24 | 49 | 1.2 | 0.4 | 0.01 | ? |
| ISO_LHSS_J105424+57301 | 10:54:24.620 | +57:30:12.48 | 2.0 | 0.29 0.05 | 6 | 7 | 21.43 | 44 | -2.2 | 1.1 | 0.01 | |
| ISO_LHSS_J104913+57130 | 10:49:13.477 | +57:13:00.61 | 2.3 | 0.29 0.06 | 3 | 5 | 22.10 | 30 | 1.4 | -0.5 | 0.01 | |
| ISO_LHSS_J105306+57341 | 10:53:06.555 | +57:34:16.01 | 2.3 | 0.28 0.06 | 4 | 5 | ||||||
| ISO_LHSS_J105220+57314 | 10:52:20.610 | +57:31:42.53 | 2.2 | 0.28 0.06 | 7 | 5 | 24.34 | 6 | -0.4 | -1.5 | 0.05 | ? |
| ISO_LHSS_J105053+57285 | 10:50:53.558 | +57:28:55.57 | 2.3 | 0.28 0.06 | 3 | 5 | 23.90 | 10 | -1.2 | -2.8 | 0.13 | |
| ISO_LHSS_J104954+57244 | 10:49:54.236 | +57:24:45.57 | 2.3 | 0.28 0.06 | 4 | 5 | 21.42 | 75 | -0.2 | 4.1 | 0.03 | |
| ISO_LHSS_J105217+57034 | 10:52:17.021 | +57:03:49.79 | 2.3 | 0.27 0.06 | 6 | 5 | 24.40 | 6 | -2.1 | -0.4 | 0.09 | |
| ISO_LHSS_J105106+57042 | 10:51:06.368 | +57:04:25.62 | 2.3 | 0.27 0.06 | 4 | 5 | 22.62 | 21 | -0.5 | 1.3 | 0.01 | |
| ISO_LHSS_J105114+57434 | 10:51:14.608 | +57:43:47.42 | 2.3 | 0.27 0.06 | 3 | 5 | 21.44 | 64 | 0.1 | -1.5 | 0.01 | |
| ISO_LHSS_J104934+57315 | 10:49:34.607 | +57:31:51.06 | 2.3 | 0.27 0.06 | 3 | 5 | ||||||
| ISO_LHSS_J105004+57372 | 10:50:04.080 | +57:37:25.15 | 2.2 | 0.27 0.06 | 6 | 5 | 21.64 | 36 | -2.1 | -1.1 | 0.01 | |
| ISO_LHSS_J105003+57355 | 10:50:03.607 | +57:35:56.30 | 2.2 | 0.27 0.06 | 4 | 5 | 23.65 | 6 | -0.9 | -1.4 | 0.03 | |
| ISO_LHSS_J105225+57313 | 10:52:25.876 | +57:31:30.61 | 2.2 | 0.27 0.05 | 6 | 6 | 24.59 | 3 | 1.4 | -2.1 | 0.14 | |
| ISO_LHSS_J104929+57072 | 10:49:29.473 | +57:07:25.89 | 2.3 | 0.27 0.06 | 3 | 5 | 19.22 | 293 | -1.4 | 0.5 | 0.01 | |
| ISO_LHSS_J105055+57160 | 10:50:55.723 | +57:16:06.44 | 2.3 | 0.27 0.06 | 5 | 5 | 20.65 | 103 | -0.2 | -0.5 | 0.01 | |
| ISO_LHSS_J105121+57193 | 10:51:21.584 | +57:19:37.83 | 2.3 | 0.27 0.06 | 5 | 5 | 25.09 | 3 | 0.7 | -1.1 | 0.05 | |
| ISO_LHSS_J105208+57320 | 10:52:08.335 | +57:32:05.29 | 2.2 | 0.27 0.06 | 3 | 5 | 23.89 | 10 | -0.1 | -0.6 | 0.01 | |
| ISO_LHSS_J104943+57240 | 10:49:43.209 | +57:24:00.14 | 2.1 | 0.26 0.05 | 6 | 6 | ||||||
| ISO_LHSS_J105212+57364 | 10:52:12.349 | +57:36:47.19 | 2.3 | 0.26 0.06 | 6 | 5 | ||||||