Network Structures from Selection Principles
Abstract
We present an analysis of the topologies of a class of networks which are optimal in terms of the requirements of having as short a route as possible between any two nodes while yet keeping the congestion in the network as low as possible. Strikingly, we find a variety of distinct topologies and novel phase transitions between them on varying the number of links per node. Our results suggest that the emergence of the topologies observed in nature may arise both from growth mechanisms and the interplay of dynamical mechanisms with a selection process.
pacs:
68.70.+W, 92.40.Gc, 92.40.Fb, 64.60.HtThere have been many exciting recent developments developments ; barab1 ; barab2 in understanding the topologies of many natural and artificial networks. The analysis of network topology is carried out using classic concepts such as clustering bollobas , the distribution of the number of links from each node (called the degree) unknown ; barab1 ; barab2 and its small world character strogatz ; newman . Strikingly, many of the observed topologies are quite distinct from those expected for generic random networks erdos ; bollobas . There has been important progress barab1 ; barab2 ; others ; unknown ; mendes1 in rationalizing the existence of non-universal scale-free networks (the degree distribution exhibits a power law behavior over a finite range with a non-universal exponent) by dynamical models entailing the growth by node and edge addition (with possible preferential attachment), rewiring barab1 and edge removal mendes1 .
Our focus here is the proposal and analysis of a class of models in which the key selection criterion for network topology is optimality. Channel networks formed in river basins have been shown to attain, in the steady state of their dissipative dynamics epitomized by the general landscape evolution equation banavar , a minimum of total energy dissipation rodriguez . Strikingly, a variety of robust scaling features emerge that closely resemble those observed for natural landforms rodriguez , and universality classes exist depending, for example, on the terrain heterogeneities river . Because of the nature of the functional to be miminized, all trees, i.e. networks with no loops, are local optima and thus prevail over networks which are not competitive from an evolutionary viewpoint rodriguez ; river ; banavar . Optimization has been introduced as a possible explanation of the degree distribution observed in the Internet topology fabrikant or to investigate the origin of small-world networks mathias , taking into account the physical distance, i.e. Euclidean distance, between the nodes of a spatial network. Scale-free networks arising from optimal design have been previously studied sole . It has been shown that the minimization of a linear combination of average degree and average distance (the distance between two nodes is defined as the minimum number of edges traversed to join them) can lead to the emergence of a truncated power-law in the degree distribution.
Our goal is to understand the topology of networks which minimize a physically motivated cost function. Strikingly, we find a variety of distinct topologies and novel phase transitions between them on varying the number of links per node.
Suppose that some type of information has to be communicated between pairs of nodes of the network strogatz . It is plausible that besides the average distance between any two nodes, the type of nodes encountered along the path(s) joining them may also matter in the optimization of the dynamics of communication taking place in the system. For example, selective pressure may operate so as to choose certain nodes because of their high connectedness - or else to avoid them for the same reason. Associated with the type of node, is a local feature that depends only on its degree, namely, the number of edges rooted in the node. On a global scale, we will distinguish among structures that rewire local features at random selecting the changes if the new structure provides a selective advantage. It is well known that in many such optimization problems, the key factor that matters is the shape of the cost function rodriguez ; river . The concavity or convexity of the cost function can be embodied by a power law form with scaling exponent less than or greater than 1 respectively:
| (1) |
where and are pairs of nodes of the network, and
| (2) |
Here is any path connecting site to site of the system, is any node belonging to such a path and is the degree or connectivity of node . The weighted distance is a global quantity associated with the pair and is the minimum of the sum of degrees (a local property), evaluated along the path from to , over all the paths connecting and . Note that in the special case of loopless tree-like structures, such a path is unique and . In the limiting case , Eq.(2) becomes the standard definition of distance on a network newman . The new definition of weighted graph distance introduced in Eq.(2) captures the conflict between two competitive trends: the avoidance of long paths and the desire to skip heavy traffic.
The networks minimizing the cost eq.(1) are searched for among the ensemble containing a fixed number of nodes , as well as the number of links (edges) . The resulting networks are analyzed in terms of the degree distribution , i.e. the fraction of nodes with degree , the average distance between pairs of nodes and the average clustering coefficient , where is a measure of how interconnected the neighbors of a given node are newman :
| (3) |
is the number of links between the neighbours of node and is the total number of possible pairs that can be formed among them.
The optimization method used in the numerical simulations is a Metropolis scheme at zero temperature. The goal is to obtain the statistics of all local minima which are accessible topologies associated with the chosen dynamics banavar .
We have studied several values of and with . The protocol of the simulation is as follows:
i) generation of a random initial configuration with fixed and ;
ii) random rewiring: Specifically, a link connecting the sites and is randomly chosen and substituted with a link from to a site , not already connected to , extracted with uniform probability among the sites of the system. This ensures that the number of links as well as the size of the system remains constant during the minimization;
iii) connectedness control: If the graph is not connected after rewiring, step (ii) is repeated;
iv) energetic control. The new value of is calculated. The new configuration is accepted only if it is energetically favorable, i.e. only if ; otherwise the change is rejected and we return to step (ii).
Note that the zero-temperature setting ensures feasible optimality of the emerging network structure river , a feature that is relevant for dynamical accessibility of complex optimal structures. The minimization algorithm stops after consecutive failed changes on the network; we have chosen , so that, on average, each pair of vertices is allowed to change its state twice. For each case we performed independent simulations, starting with different random initial configurations and varying the size of the system: . For each size, the different values of the ratio investigated are: .
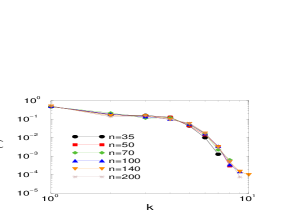
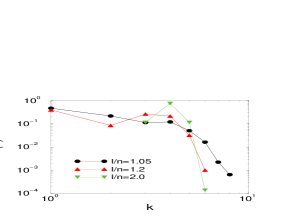
On varying , we observe two distinct behaviors. The first occurs for values of : the system displays an apparent scale-free behavior in for several values of (see Figure 1, for ). However, the behavior does not seem to be a genuine power law because the sharp cut-off does not display the expected dependence on the system size . Unfortunately, the computational cost, which grows exponentially with the number of nodes, does not permit us to quantify the weak dependence of the cut-off on . As increases, this apparent scale-free region shrinks around the value and is vanishingly small for . The second behavior is obtained for larger values of the ratio – the degree distribution obtained is strongly peaked around the average value of , (Figure (2)).
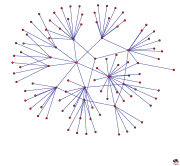
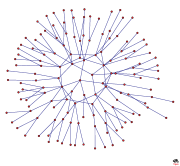
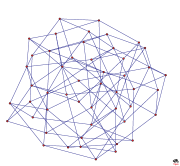
A sample of network topologies are illustrated in Figure (3), for different values of and .
On increasing the value of the ratio , one moves from networks characterized by the presence of some highly connected nodes together with many peripheral sites (Top Left and Right) to networks in which almost every node has the same degree (Bottom Left and Right). In addition, a sharp transition is observed in terms of the average clustering coefficient , as defined in eq.(3).
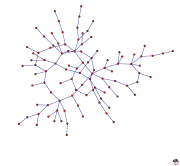
For (fig. 4 Top), the system undergoes a clear phase transition as the value of the ratio increases passing from a regime characterized by zero clustering to one in which the clustering coefficient becomes different from zero. The cost function in eq.(1) has two competing forces: the minimization of the graph diameter and the minimization of node degree. When the minimization of node degree dominates and the system attempts to minimize the degree of each node resulting in a peaked distribution around the mean value , with a non-trivial topology characterized by zero clustering and exhibiting the presence of long loops. (fig. 3 Bottom Right). When the ratio reaches the critical value , one obtains a non-zero clustering coefficient.
This transition also occurs for . However, when one obtains an additional phase transition at , where the system passes from optimal networks exhibiting a non-zero clustering coefficient, to ones with no clustering at all. Starting from very small values of , we observe topologies characterized by the presence of few interconnected hubs (i.e. sites with very high degree complexnetworks ; barab1 ) linked to many peripheral sites (fig. 3 Top Left). Indeed, when , the tendency expressed by the cost function is to decrease the graph diameter, i.e. a measure of the mutual distance among pairs of nodes.
The emergence of this extra phase transition underscores the importance of the concavity (convexity) of the cost function.
The limiting case would correspond to the minimization of the standard graph distance, leading, in the region , to a single central hub connected to peripheral nodes, which share the remaining links. This situation leads to non-zero clustering. The minimization of the graph distance corresponds to a limiting case of sole as well; however, in sole there is no constraint on the number of links , so that the optimal network they find is a clique, in which each node is connected to each other.


Increasing the ratio does not favour adding other links among the hubs, because their already high degrees would only increase further. Hence the system reorganizes by increasing the number of hubs and automatically reducing their degrees, trying to avoid expensive triangles between hubs. When the transition occurs, at , the network does not exhibit hubs any more, but tends to become quite homogeneous in the sense that almost every node has coordination close to the average value . Even in this regime the optimal topology is distinctly different from the random one. In fact, it displays a peaked degree distribution around the mean value without significant clustering (fig. 3 Bottom Left). The loops formed have the maximum possible length in order to reduce the energy function. Adding extra links to the network forces the loops to become smaller, still avoiding clustering up to a second critical value of , . Beyond this value, ’triangles’ appear leading to a transition similar to the one encountered for (fig. 4 Bottom, inset).
The extent of the clustering phase for and shrinks for increasing values of ; the critical value decreases as increases, . From Fig. 1, 2 and Fig. 4, one finds that several distinct topologies are obtained for different values of and : a heterogeneous regime exhibiting a broad distribution of degrees (, ) observable both in the clustering and no clustering phase depending on the value of ; a homogeneous regime for larger values of with (, and , but not in the tree-like limit) or (, and , ).
We have also studied the characteristic path length, , defined as the average, over all pairs in the system, of the graph distance between pairs of nodes.
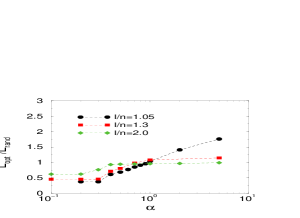
As shown in fig. 5, in the entire interval of , the characteristic path length of the optimal configuration, , is comparable to or smaller than the random one, . Even though the small network sizes studied here do not allow us to reach definitive conclusions, the system seems to display a small-world effect newman .
We have studied the system behaviour in terms of mean clustering and average path length in comparison to both a classical random graph erdos ; bollobas ( and ) and a random graph characterized by the same degree distribution as the optimized network ( and ): both studies give comparable results (see for example the top inset of fig. 4).
In summary, we have investigated the role of selective pressure in determining the topological features observed in natural and artificial complex networks. Our work is complementary to existing models that either rely on dynamical mechanisms, such as preferential attachment, or on topological and geometrical criteria. Optimality leads to the emergence of several distinct network structures including an apparent scale-free arrangement in the tree-like topology limit. Besides the degree distribution, we have studied the clustering coefficient and the average path length of the selected networks which point to the existence of non-trivial phase transitions and to the features of the small-world effect. Our main result is that the emergence of the topologies observed in nature may not exclusively be the outcome of growth mechanisms but may also arise from the interplay of dynamical mechanisms with an evolutionary selection process.
This work was supported by COFIN MURST 2001, NASA and by NSF IGERT grant DGE-998758.
References
- (1) D.J. Watts, Small Worlds (Princeton Univ. Press, Princeton, 1999); M. Buchanan, Nexus: Small Worlds and the Groundbreaking Science of Networks (W.W. Norton, New York, 2002); A.L. Barabási, Linked: the New Science of Networks (Perseus, Cambridge, 2002); S. Strogatz, SYNC: the Emerging Science of Spontaneous Order (Hyperion, New York, 2003).
- (2) R. Albert and A.L. Barabási Rev. Mod. Phys. 74, 47 (2002).
- (3) A.L. Barabási and R. Albert Science 286, 509 (1999); A.L. Barabási, R. Albert and H. Jeong Physica A 272, 173 (1999); A.L. Barabási, H. Jeong, Z. Neda, E. Ravasz, A. Schubert and T. Vicsek Physica A 311, 590 (2002).
- (4) B. Bollobás, Random Graphs (Cambridge Univ. Press, Cambridge, 2001).
- (5) M.E.J. Newman, S.H. Strogatz, D.J. Watts, Phys. Rev. E 64, 026118 (2001); M.E.J. Newman, Phys. Rev. Lett. 89, 208701 (2002); M.E.J. Newman, Phys. Rev. E 67. 026126 (2003)
- (6) D.J. Watts and S.H. Strogatz, Nature 393, 440 (1998).
- (7) M.E.J. Newman, SIAM Review 45, 167 (2003).
- (8) P. Erdos and A. Rényi, Publ. Math. Inst. Hung. Acad. Sci. 5, 17 (1960).
- (9) S. Redner Eur. Phys. J. B 4, 131 (1998); P.L. Krapivsky, S. Redner and F. Leyvraz Phys. Rev. Lett. 85, 4629 (2000); S.N. Dorogovtsev and J.F.F. Mendes Phys. Rev. E 63, 056125 (2001); A. Vázquez, R. Pastor-Satorras and A. Vespignani Phys. Rev. E 65, 066130 (2002).
- (10) S.N. Dorogovtsev and J.F.F. Mendes Europhys. Lett. 52, 33 (2000).
- (11) J.R. Banavar, F. Colaiori, A. Flammini, A. Maritan and A. Rinaldo, J. Stat. Phys. 104, 1 (2001).
- (12) I. Rodriguez-Iturbe and A. Rinaldo, Fractal River Basins. Chance and Self-Organization, (Cambridge Univ. Press, New York, 1997).
- (13) A. Maritan, F. Colaiori, A. Flammini, M. Cieplak and J.R. Banavar Science 272, 984 (1996); J.R. Banavar, F. Colaiori, A. Flammini, A. Giacometti, A. Maritan and A. Rinaldo Phys. Rev. Lett. 78, 4522 (1997); J.R. Banavar, F. Colaiori, A. Flammini, A. Maritan and A. Rinaldo, Phys. Rev. Lett. 84, 4745 (2000).
- (14) A. Fabrikant, E. Koutsoupias and C.H. Papadimitriou, ICALP 2002 (2002).
- (15) N. Mathias and V. Gopal, Phys. Rev. E 63, 21117 (2001).
- (16) S. Valverde, R.F. Cancho, R.V. Solé, Europhys. Lett. 60, 512 (2002); R.F. Cancho and R.V. Solé, cond-mat/0111222 (2002).
- (17) M.E. Fisher. In Critical Phenomena, ed. M.S. Green (Academic Press, New York), 271-295 (1972).
- (18) S.H. Strogatz, Nature 410, 268 (2001).