Electronic specific heat and low energy quasiparticle excitations in superconducting state of single crystals
Abstract
Low temperature specific heat has been measured and extensively analyzed on a series of single crystals from underdoped to overdoped regime. From these data the quasiparticle density of states (DOS) in the mixed state is derived and compared to the predicted scaling law of d-wave superconductivity. It is found that the scaling law can be nicely followed by the optimally doped sample (x=0.15) in quite wide region of (). However, the region for this scaling becomes smaller and smaller towards more underdoped region: a clear trend can be seen for samples from x= 0.15 to 0.069. Therefore, generally speaking, the scaling quality becomes worse on the underdoped samples in terms of scalable region of . This feature in the underdoped region is explained as due to the low energy excitations from a second order (for example, anti-ferromagnetic correlation, d-density wave, spin density wave or charge density wave order) that may co-exist or compete with superconductivity. Surprisingly, deviations from the d-wave scaling law have also been found for the overdoped sample (x=0.22). While the scaling law is reconciled for the overdoped sample when the core size effect is taken into account. An important discovery of present work is that the zero-temperature data follow the Volovik’s relation quite well for all samples investigated here although the applicability of the d-wave scaling law to the data at finite temperatures varies with doped hole concentration. Finally we present the doping dependence of some parameters, such as, the residual linear term , the value, etc. It is suggested that the residual linear term () of the electronic specific heat observed in all cuprate superconductors is probably due to the inhomogeneity, either chemical or electronic in origin. The field induced reduction of the specific heat in the mixed state is also reported. Finally implications on the electronic phase diagram are suggested.
pacs:
74.20.Rp, 74.25.Dw, 74.25.Fy, 74.72.DnI Introduction
One of few points with consensus in the cuprate superconductors is the pairing symmetry in hole doped region. This has been supported by tremendous experiments Tsuei1 both from surface detectionTsuei2 ; ARPES ; Hardy ; Tunneling ; YehNC and bulk measurementsNMR ; Moler ; Revaz ; Wright ; Fisher ; Phillips ; Nohara ; Chen . In a d-wave superconductor with line nodes in the gap function, the quasiparticle density of states (DOS) rises linearly with energy at the Fermi level in zero field, i.e., , resulting inKopnin1996 an electronic specific heat , where and is the specific heat which is proportional to the DOS at the Fermi level of the normal state. In the mixed state with the field higher than a certain value, the DOS near the Fermi surface becomes finite, therefore the quadratic term will be surpassed and substituted by both the localized excitations inside the vortex core and the de-localized excitations outside the core. Volovik Volovik pointed out that for d-wave superconductors in the mixed state, supercurrents around a vortex core lead to a Doppler shift to the quasiparticle excitation spectrum, which affects strongly the low energy excitation around the nodes. It was shown that the contribution from the delocalized part (outside the core) will prevail over the core part and the specific heat is predicted to behave asVolovik ; Kopnin1996 with in the order of unity. This prediction has been verified by many measurements which were taken as the evidence for d-wave symmetryMoler ; Revaz ; Wright ; Fisher ; Phillips ; Nohara ; Chen ; Hussey . In the finite temperature and field region a scaling law is proposedSimonLee as
| (1) |
with . This scaling law can be further converted into the form of or , here , or or are unknown scaling functions. This scaling law has been proved in Moler ; Revaz ; Wright and in LSCOFisher ; Phillips ; Nohara ; Chen . It remains however unclear whether this scaling law is still valid in the very overdoped region since the vortex core size grows up. In the underdoped region, inelastic neutron scattering reveals that an anti-ferromagnetic order emerges when the superconductivity is suppressedLake ; Kang . It is thus also interesting to check whether the d-wave scaling law proposed by Simon and Lee is applicable in underdoped regime. In addition, the Simon-Lee scaling law is in agreement with the calculations as proposed by Volovik and KopninVolovik ; Kopnin1996 in two extreme conditions of temperature. In the low temperature limit the scaling law becomes the Volovik’s relation . When the temperature is increased, another relation is reached. The boundary between these two regions is according to Volovik and KopninVolovikComment . These theoretical models can be quantitatively tested by experiments on samples with different doping concentrations.
Another important but controversial issue is the vortex core state in the cuprate superconductors. By solving the mean-field Bogoliubov-de Gennes (BdG) equation, theoretically it is suggested that a zero-bias conductance peak (ZBCP) exists in the vortex coreWangYong ; Franz . However this is in sharp contrast with the experimental observationsMaggio ; Renner ; Pan ; Hoogenboom ; Dagan ; Mitrovic , mainly on optimally doped samples. The absence of a ZBCP within the vortex cores was attributed to the presence of or componentsDagan , or the competing orders (see later). In this paper we show that the DOS due to vortex quasiparticle excitations deviates from Simon-Lee scaling law for the overdoped sample, but follows rather well with the optimally doped one. The deviations for the overdoped sample are found to be induced by the vortex core size effect. In the extremely underdoped region, it is found that the Simon-Lee scaling law fails, except for in very low temperature region. This can be understood as due to the competing order emerging within or nearby the vortex cores.
II Experiment
The single crystals measured in this work were prepared by the travelling solvent floating-zone technique. Samples with seven different doping concentrations (p=0.063, 0.069, 0.075, 0.09, 0.11, 0.15, 0.22) have been investigated. The sample with p=0.15 and 0.22 are from CRIEP, and others are from NLSC(IOP). Part of the data for all samples will be presented, for example the field induced change of at zero K, the residual linear term and the value in the pure d-wave expression when (see later). However for clarity we mainly show data and the analysis on three typical samples with x=0.22 (K, overdoped), x=0.15 (K, close to optimal doping point) and p=0.069 (K, underdoped, x=0.063 originally) as characterized by AC susceptibility and DC magnetization (shown by the insets in Fig.3, Fig.8 and main panel of Fig.12). The quality of our samples has also been characterized by x-ray diffraction patterns, and data showing a narrow transition 2 K. For some samples, the full width at the half maximum (FWHM) of the rocking curve of the (008) peak is only 0.10∘. The overdoped sample has a mass about 28.55 mg and in dimension. The optimally doped sample weighs about 23.6 mg with dimensions of . For the underdoped sample with nominal concentration x=0.063, before annealing, it has a superconducting transition temperature of about 12 K and a mass of about 32.89mg and 3.75 x 2.75 x 0.5 in dimensions. By fitting to the empirical relation with the maximum at the optimal doping point , we estimate that the hole concentration of this sample is around . After annealing in flowing Ar gas for 48h, the drops down from about 12 K to 9 K indicating that the sample becomes more underdoped. Note that =9 K is expected exactly by the empirical relation at .
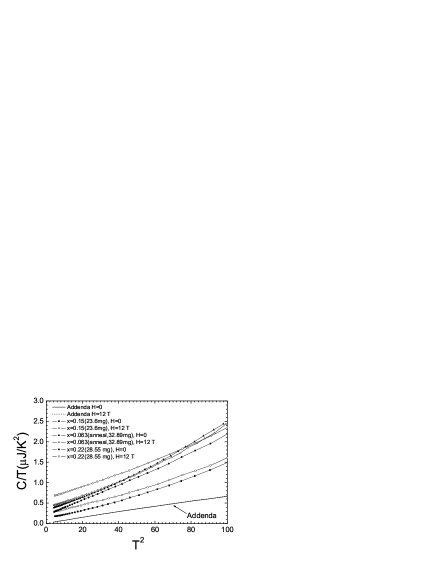
The heat capacity presented here were taken with the relaxation method based on an Oxford cryogenic system Maglab. The sample is put onto a micro-chip on which there is a tiny Cernox temperature sensor, a film heater. The micro-chip together with the sample are hung up by golden wires in vacuum. These golden wires are the only thermal links between the micro-chip and the thermal sink whose temperature is well controlled. The temperature of the micro-chip is controlled by the on-board small film heater and measured by the on-board thermometer. When the temperature of the micro-chip is stable, a heating power with fixed current is sent to the film heater on the chip and the time dependence of the chip temperature is measured simultaneously. The change of temperature is fitted to an exponential relation , and heat capacity is determined by , here and are the heat capacity of the sample and addenda (including a small sapphire substrate, small printed film heater, tiny Cernox temperature sensor, 25 gold wire leads, Wakefield thermal conducting grease (about )) respectively, where is the thermal conductance between the chip and the thermal link. The value has been measured and subtracted from the total heat capacity, thus value reported here is only that from the sample. In Fig.1 we present the temperature and field dependence of the heat capacity from the addenda and three typical samples. It is clear that the heat capacity of the addenda is much smaller than the value of the samples. In addition, the data of for the addenda extrapolates to zero at showing the only existence of phonon part. One can also see that almost no field dependence can be observed for the addenda. However, for all samples, there is a clear finite intercept at which gives rise to a residual linear term . Meanwhile the field induced change can be easily observed for all samples, even for the very underdoped sample. The inter-crossing of the data at and at about 6K for the undedoped sample is understandable and will be discussed later.
In all measurements done for the present work, the magnetic field H is always parallel to c-axis of single crystals, and the data are collected in the warming up process after it is cooled under a field (Field-Cooling process, abbreviated as FC hereafter). In the data treatment we use instead of using . The latter may inevitably involve the unknown DOS contributions from another kind of vortices (for example, Josephson vortices) when . The field dependence of the Cernox thermometer has been calibrated well by Oxford before the shipment. The true temperature has been derived automatically by the software with a calibration table with magnetic fields at 0T, 1T, 2T, 4T, 8T and 12 T. The values at other fields are obtained also automatically by software by doing linear interpolation between two nearby fields. Therefore the readout from the machine gives directly the true temperature value with the field effect corrected.
III Results and Data Analysis
III.1 Fitting to the zero field data
Before showing the field induced change of the heat capacity we present in Fig.2 the temperature dependence of for some samples at zero field. As mentioned previously, for a d-wave superconductor in the superconducting state, it is known that when . In addition, as observed in other cuprate superconductors, the curve at zero field extrapolates to a finite value () at 0 K instead of zero. This was interpreted as potential scattering effect due to small amount impurities or disordersMoler ; Hirschfeld . We will argue that this residual linear term may also reflect physics beyond the simple argument of impurity scattering (see later). As also observed by other groups for system, the anomalous upturn of due to the Schottky anomaly of free spins is very weakFisher ; Phillips ; Nohara ; Chen . This avoids the complexity in the data analysis. Together with the phonon contribution , we have
| (2) |
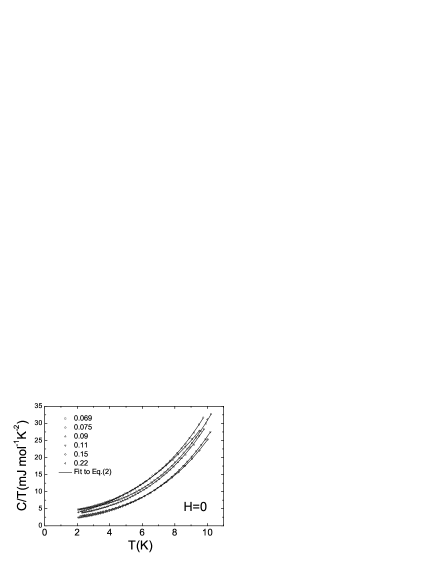
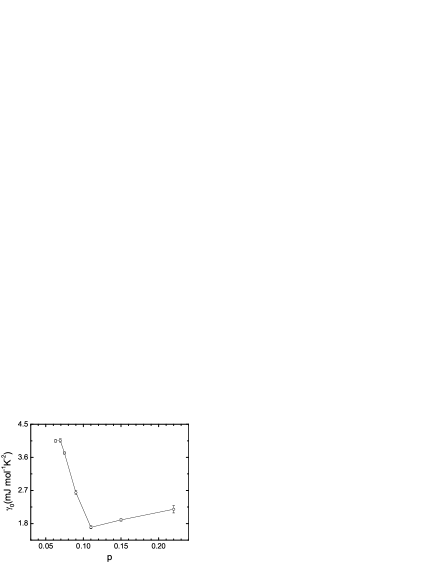
Above equation is used to fit the data at for some samples. The fitting results are shown in Fig.2 and listed in Table-I, where the units for , , and are , , and respectively. One can see that decreases quickly towards underdoping, (and thus the Debye temperature ) does not change too much with doping. The sudden drop of at may be induced by the well known problem. The residual linear term increases rapidly towards underdoping, which will be discussed later. The values are also comparable to those found by other groupsNohara ; Chen .
| p | |||||
|---|---|---|---|---|---|
| 0.22 | 27.4 | 2.19 | 0.463 | 0.186 | 0.00054 |
| 0.15 | 36.1 | 1.90 | 0.177 | 0.120 | 0.00093 |
| 0.11 | 29.3 | 1.70 | 0.065 | 0.137 | 0.00096 |
| 0.09 | 24.4 | 2.64 | 0.158 | 0.145 | 0.00110 |
| 0.075 | 15.6 | 3.72 | 0.131 | 0.177 | 0.00110 |
| 0.069 | 12.0 | 4.06 | -0.077(?) | 0.157 | 0.00117 |
III.2 Overdoped sample with x=0.22
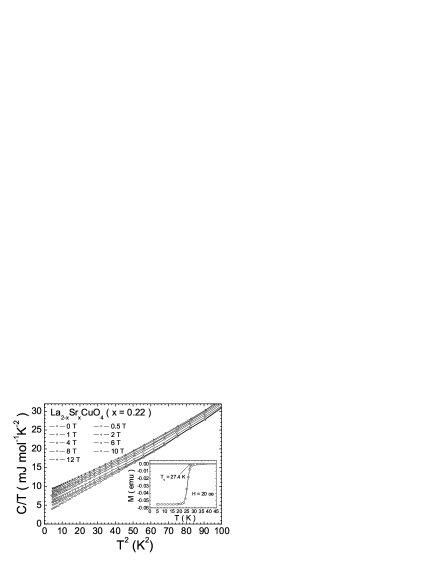
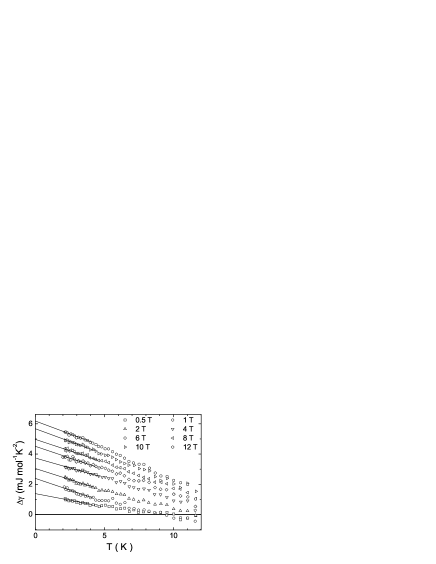
Fig.3 shows as a function of at magnetic fields ranging from 0 to 12 T for the overdoped sample. The separation between each field can be well determined. In low temperature region the curves are rather linear showing that the major part is due to phonon contribution . It is known that the phonon part is independent on the magnetic field, this allows to remove the phonon contribution by subtracting the at a certain field with that at zero field. The results after the substraction are shown in Fig.4. The subtracted values exhibit a rather linear dependence in low temperature region. One can also see that the negative slope is actually field dependent. In the following we will show that the field dependent slope of the linear part in low temperature region shown in Fig.4 directly deviates from the Simon-LeeSimonLee scaling law.
According to Simon-Lee scaling law , in low temperature region, the Volovik’s relation restores, thus one has and further has
| (3) |
This clearly shows that there is a negative slope for vs. , but the slope is a constant. However, from Fig.4 one can see that the slope changes slightly with the magnetic field . This indicates that only the Volovik’s relation is not enough to interpret the data. In the following we will take both the core size effect and finite temperature effect into account. The former has not been considered in the original Simon-Lee scaling law since the size of the vortex core was thought to be small, and the contribution from that small region is negligible. If the vortex core size becomes bigger, this should be reconsidered when counting the DOS due to the Doppler shift effect.
Let us first consider only the finite temperature effect. Suppose that we are in the crossover region between the low temperature limit and high temperature limit suggested by Volovik and KopninVolovikComment , making Taylor’s expansion to the right hand side of Simon-Lee scaling law leads to
| (4) |
where = 0 because should not diverge when and , . Since is very small in low temperature region, one thus has . Interestingly, one can see that this simple formula contains the results both in the low temperature limit Volovik ; Vekhter ; Kopnin1996 and high temperature limitVekhter ; VolovikComment . This is not surprising since a scaling function should be more general and cover most possible cases. When , the total specific heat contains four parts: Doppler shift term from the region outside the core , the inner vortex core term , the residual linear term and the phonon term . Here it is assumed that the heat capacity contributed by the core region is equal for each vortex and independent on the external magnetic field, thus depends only on the vortex density which is proportional to H. The local DOS measured by STMPan revealed that the low energy DOS within the vortex core differs only slightly from the case for a d-wave superconductivity (outside and far away from the vortex core). When changing the external magnetic field, the low energy DOS within the vortex core is not expected to vary too much. At zero field, the total specific heat contains three parts: and , and a quadratic term due to the thermal excitation near the nodal region. Thus can be written as:
| (5) |
From eq.5 one can see that depends on T through the second term, however the slope is still field independent by definition. This clearly indicates that the Simon-Lee scaling law is still not enough to interpret the field dependent slope of vs. as shown in Fig.4.
Let us keep going, still based on eq.5, we propose that the core size effect may have a sizable influence on the total vortex quasiparticle excitations. This is actually reasonable since the vortex core with size grows up in the overdoped side due to smaller superconducting gap valueWen2003EPL , where is the Fermi velocity and is the superconducting gap. By taking the vortex core size () into account, i.e., deducting the normal core area away from the Volovik term, one can rewrite as
| (6) |
where is the radius of the normal core, is the outer radius of a single vortex where the supercurrent is flowing, thus . Reorganizing all terms in eq.6 leads to
| (7) |
One can see that the third term in eq.7 is just what we need for interpreting the difficulty as mentioned above. It is necessary to recall that the core size correction is proportional to , for example, it will be four times when doubles. Thus increase of in the overdoped side will give sizable effect on the total DOS and core size effect should be considered. Next let us have a closer inspection at the data and derive some parameters. At zero temperature, only the first term and the last term are left in eq.7. The values of are determined from the extrapolation of the linear lines in Fig.4 to 0 K and presented in Fig.5. The data is also determined by doing linear fit to the raw data vs. between and , and then subtracted the zero temperature value . The results are quite close to each other by using these two different methods. The solid line in Fig.5 is a fit to the data using the first term in eq.7 yielding and and thus . The value derived here is quite close to that found in NernstWangYaYu and STM measurementsPan ( for optimally doped Bi-2212 sample). We also tried to use the first term together with the last term to fit the data but find out that the contribution from the last term is extremely small. The first term here describes the zero temperature data very well, indicating the absence of a second component of order parameter such as or since otherwise the Fermi surface would be fully gapped and the Doppler shift had very weak effect on the quasiparticle excitations. The inset of Fig.5 shows the field dependence of the slope of the linear part in Fig.4. It is clear that the slope increases roughly linearly with H above 1 T. This can be exactly anticipated by the second and third terms in eq.7. From the inset of Fig.5 one obtains and . By taking , we obtain the following values: and . The value of found here is quite close to the value obtained by fitting the zero field data to eq.2 (0.465 see Table-I). Since the contribution from the core region (last term in eq.7) is negligible comparing to the Volovik term, from eq.7 one understands that the failure of using the Simon-Lee scaling law in very overdoped sample is due to the core size effect. This is actually quite reasonable since the core size in the overdoped region grows up. Sofar we don’t know yet whether the negligible contribution from the core region is because of the gapped feature within the core region as found in optimally and underdoped samplesMaggio ; Renner ; Pan ; Hoogenboom ; Dagan ; Mitrovic , or it is naturally small comparing to the contributions from the Doppler shift effect of the surrounding superfluid. This casts a interesting issue for future STM measurement on the tunnelling spectrum within the vortex cores in very overdoped region.
It is necessary to estimate how much of the field induced delocalized DOS is contributed by the impurity scattering in our present sample. At the unitary limit at zero energy, i.e., when T=0, Kbert and HirschfeldHirschfeld predict that the field induced relative DOS is , where , the gap maximum, the impurity scattering rate, and , . The dotted line in Fig.5 represents the best fit of this relation to our data yielding (close to the clean limit). In addition, the value of derived here is about 21.53T, which is too small for present sample. It is clear that the fit has a poor quality comparing to the better fit in the clean limit (solid line). Furthermore, the formulism considering the impurity effect does not predict a field dependent slope for the linear relation vs. T in low temperature region. Therefore together with the extremely small found in present case, we believe that the field induced DOS in our sample comes mainly from the Doppler shift effect on supercurrent outside the cores. The residual linear term ( ) of electronic specific heat will be discussed separately in the following subsection.
In order to show the inapplicability of Simon-Lee scaling law for the overdoped sample, we present the raw data vs. in Fig.6. Clearly the scaling looks very poor. From above discussion, we conclude that the failure of the Simon-Lee scaling law in the very overdoped region is due to the quite large vortex core size which needs to be corrected.
The nice fit in Fig.5 with only the first term of eq.7 suggests that the core region has very small contribution to the DOS since otherwise the last term should be sizeable. This implies that the low energy DOS inside the vortex core is very small. Based on this idea, we write a new scaling law as
| (8) |
One can use this equation to test the idea about the vortex core size correction. We thus present the data of vs. in Fig.7 with and derived above. The data collapse on one branch and show good consistency with the expected theoretical curve. The slight scattering or deviation from the main scaling branch is due to the simple assumption made for the core size correction () and the rough estimation for value. Worthy of noting is that to have this nice data collapsing and consistency with the theoretical curve we need to take , again showing a small contribution from the inner vortex core. The nice data collapsing using eq.8 suggests that the Simon-Lee scaling law can be reconciled by considering the vortex core size effect. It is interesting to note that the electronic thermal conductivity derived by Sun et al.SunXF is not consistent with the Volovik’s expression in low temperature region for the overdoped sample, rather it shows a plateau when the field is high. However the law is followed very well in low temperature region for the optimally doped sample. Our core-size correction picture may provide alternative interpretation to this discrepancy.
III.3 Optimally doped sample (x=0.15)
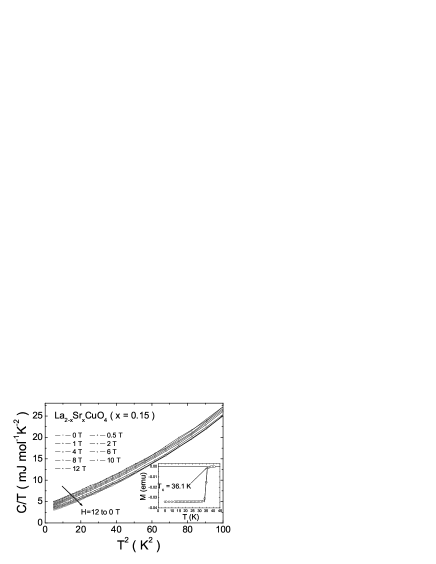
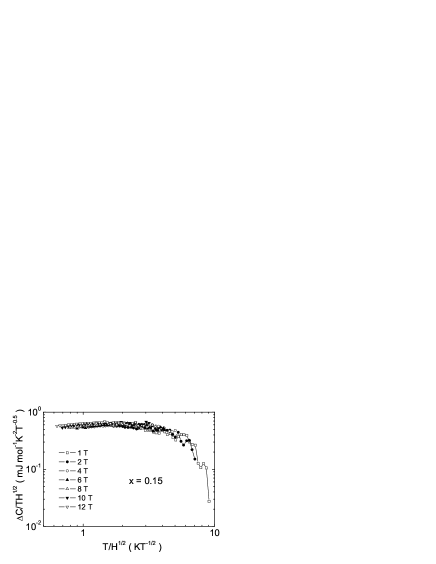
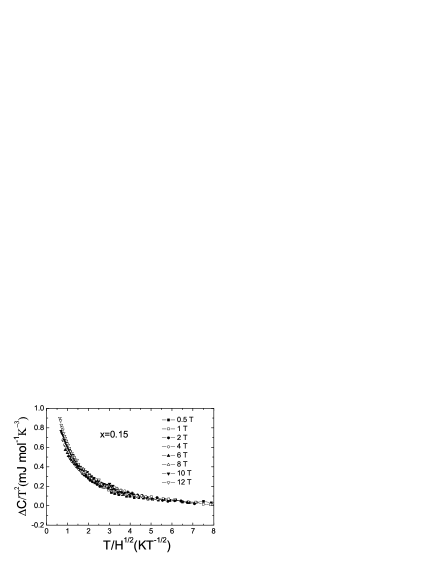
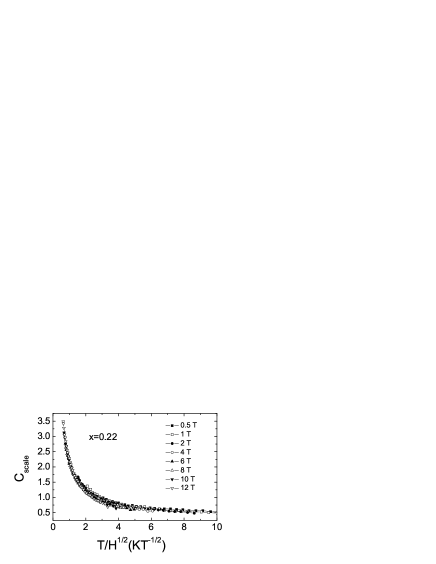
In order to have a comparison with the overdoped sample, in this subsection we present the data from an optimally doped one with x=0.15. The raw data of specific heat for the optimally doped sample is shown in Fig.8. The separation between each field can also be easily distinguished in low temperature region. Again here the curve at zero field extrapolates to a finite value () at 0 K instead of zero. This will be discussed in the forthcoming subsection. It is found that the linear behavior of vs. for the overdoped sample (shown in Fig.4) is absent here. This may be due to the much smaller value (see Table-I). We then check whether the d-wave scaling law is applicable here. If the Volovik (Doppler shift) effect really dominates here, one can expect that , thus , or should scale with . In Fig.9 we present the result of vs. . It is clear the scaling is rather good comparing to that of the overdoped sample [Fig.6]. Here the value of in the zero temperature limit gives the pre-factor in the Volovik’s relation which is about 0.55 to 0.6 . In Fig.10 we present the Simon-Lee scaling in the way of vs. . One can see that the scaling is reasonably good. All data below about 10 K collapse onto one branch. We have been aware that Nohara et al.Nohara successfully used the Simon-Lee scaling law to the overdoped sample , but failed for the optimally doped one. The failure of using Simon-Lee scaling law in Nohara’s experiment for optimally doped sample is in contradiction with the reports from many other groupsChen ; Fisher ; Phillips . This may be caused by the way that they used to derive . As stressed in previous subsection, we use instead of using to derive the field induced change of . The latter (as used by Nohara et al.) may inevitably involve the unknown DOS contributions from another kind of vortices (for example, Josephson vortices) when . For system, since the Schottky anomaly is very week, it is not necessary to derive in the second way. While Nohara et al.Nohara obtained a relatively good scaling for the overdoped sample (). We would not comment on the validity of this successful scaling at . One reason for the discrepancy between their results and our results may be from different doping levels: our sample () is more overdoped and the vortex core size is certainly larger and needs to be corrected .
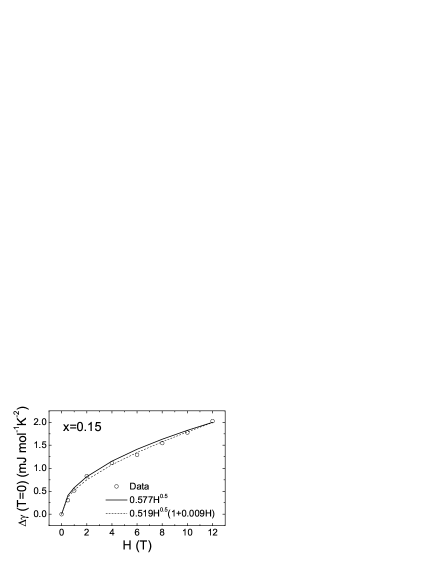
The data is determined by doing linear fit to the raw data vs. between and , and then subtracted the zero temperature value . The results are shown in Fig.11. We tried to fit the zero temperature data in Fig.11 to the first term in eq.7 in terms of core size correction ( shown by the solid line), it turns out that the correction term is very small and negative, which is certainly unreasonable. This actually indicates that can be nicely fitted to the theoretical expression . Using , we have . A similar value (0.49) was derived by Fisher et al.Fisher for sample with . Taking Wen2003EPL and 0.74Hussey , we have , which is very close to the reported values for optimally doped sampleNohara ; Chen . Worthy of noting here is that the field induced extra DOS at zero K can be nicely fitted with the Volovik’s relation albeit the residual linear term is quite large. This suggests that the residual linear term observed commonly in curate superconductors may originate from some other properties, such as inhomogeneity. It may not be induced by the small scale impurity scattering since otherwise the law should not be followed so well. Since both the Simon-Lee scaling law and the Volovik’s are followed very well for optimally doped sample, the core size effect seems to be very week.
III.4 Underdoped sample
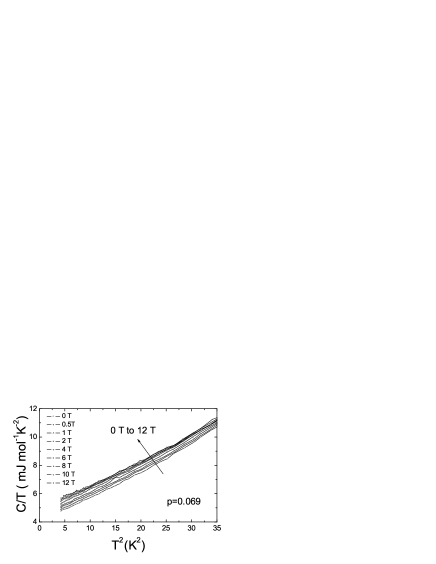
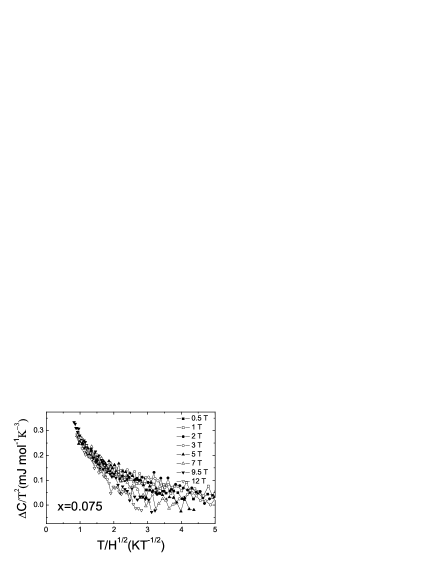
In this subsection the low temperature specific heat of underdoped ( and ) single crystals is reported in magnetic fields up to 12 T. It is found that the Volovik’s relation is still satisfied in the zero temperature limit, but the proposed Simon-Lee scaling law, i.e., , is not followed so well, except for at very low temperatures (below about 3-4 K).
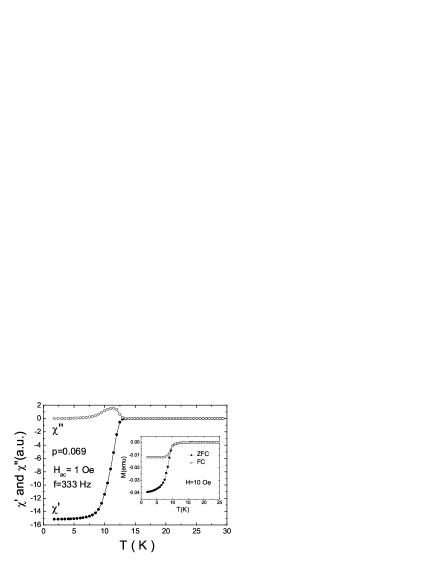
Fig.12 shows the temperature dependence of the AC susceptibility and DC magnetization of the underdoped sample (). The transition temperature drops from about 12 K to 9 K after extracting some oxygen out of the sample (not shown here) by annealing the sample in gas for 48 hrs. Then keeps stable upon further annealing in gas. The is increased again when the sample is treated in flowing oxygen. The DC magnetization measured in the FC process shows a transition width of about K. Below about the M(T) curve keeps flat. The magnetization measured in ZFC mode shows a slight increase with temperature induced by the easy flux penetration in the very underdoped region. Specific heat has been measured in the FC mode as done for all other samples. This mode provides a vortex system which is close to equilibrium state and thus relatively uniformLiSL . Presented in Fig.13 is the specific heat as a function of at magnetic fields ranging from 0 to 12T for this underdoped sample before annealing (estimated p=0.069). In low temperature region the curves are rather linear showing that the major part is due to the phonon contribution , and has no slight upturn in low temperature region due to the Schottky anomaly of free spins. The curve at zero field extrapolates to a finite value () at 0K , again showing the existence of a residual linear term which will be discussed later. As mentioned before the phonon part is independent on the magnetic field, this allows to remove the phonon contribution by subtracting the C/T at a certain field with that at zero field, one has and . The results after the substraction are shown in Fig.14. One can see that the linear part with negative slope as appearing for the overdoped sample is absent here. This is understandable when value (or term) is very small comparing to the field induced change of total specific heat. Therefore for this underdoped sample, no apparent term at was observed which can be found easily in the overdoped LSCO sample. This is consistent with the data shown in Table-I and experimental results from other groups on LSCOChen ; Nohara . The disappearance of this term was usually interpreted as due to either the impurity scattering which smears out the nodal effect, or the small value of coefficient of the term. We will show that this is induced by much smaller value (thus smaller ) just above .
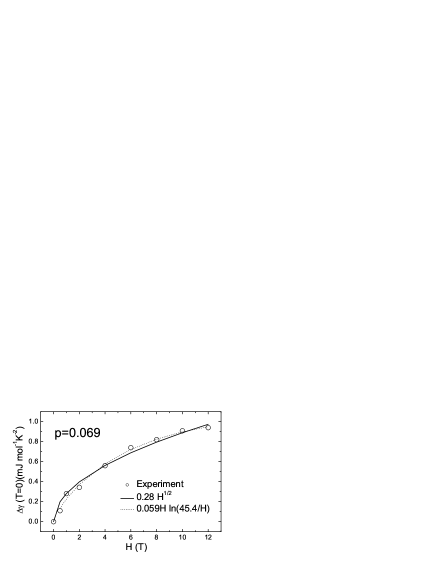
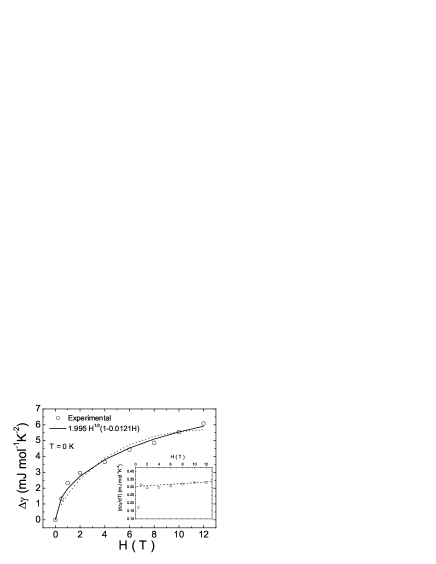
Next let us have a look at the field induced DOS at T=0 K. The data is determined by doing linear fit to the raw data vs. between and , and then subtracted the zero temperature value . The results are shown in Fig.15. In order to compare with the theoretical predictions, the increase in was fitted with , and the value of is and is about 0.28. The value derived here from free fitting is very close to as predicted by the Volovik theory Volovik which may manifest the existence of line node in the gap function. We can also fix and find out that . This is also compatible with the results of other groupsChen . For the zero temperature data we also considered the core size correction, i.e., tried to use the first term of eq.7 to fit the zero temperature data. But it gives rise to a small and negative value of which is certainly unreasonable.
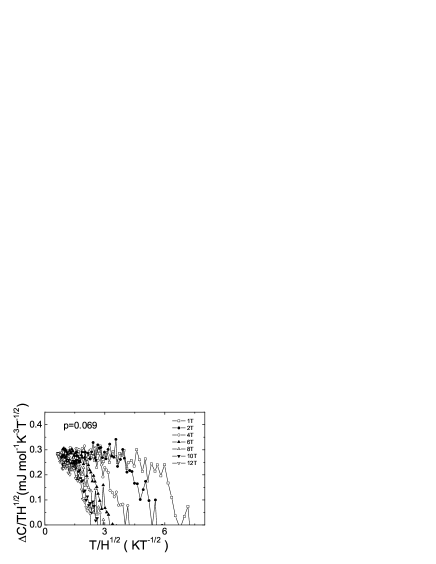
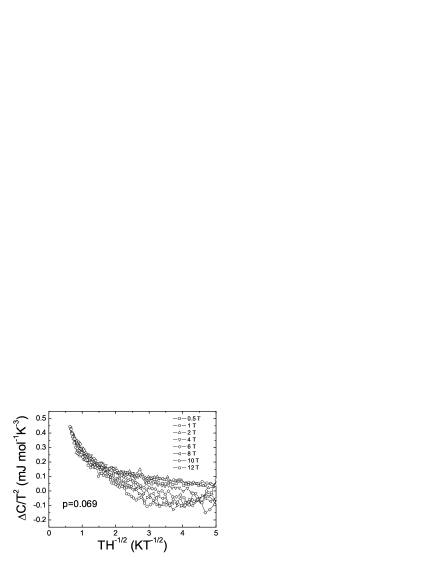
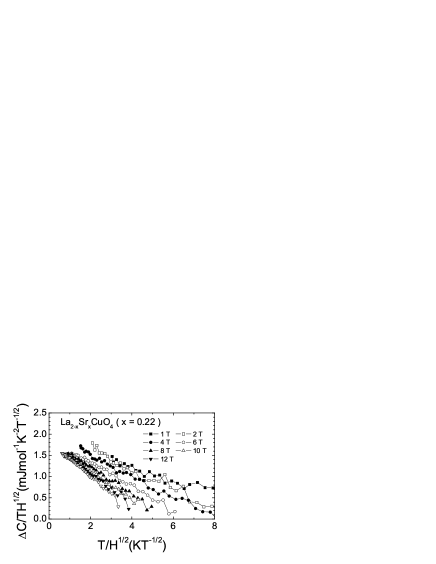
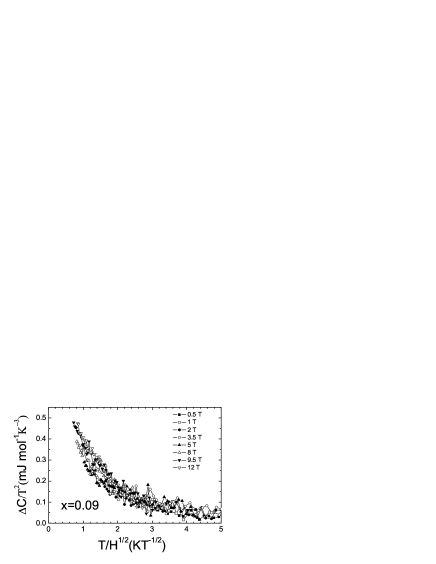
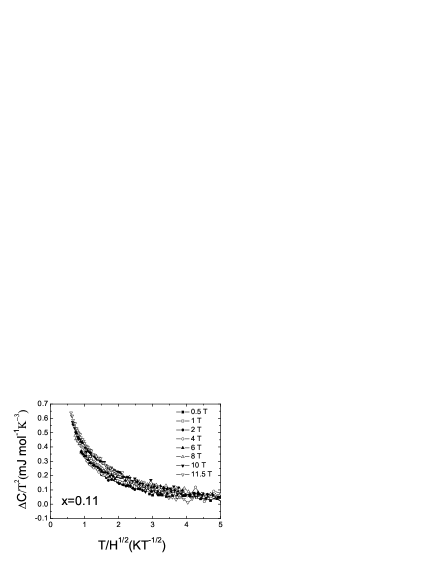
For the underdoped sample, we used the Simon-Lee scaling law to scale our data. The results of vs. are shown in Fig.16. The data fan out showing a poor scaling quality. Clearly the data cannot be scaled using the Simon-Lee scaling law except for at very low temperatures. We plot also the data of vs. in Fig.17, one can again see the poor scaling in wide temperature region. The Simon-Lee scaling has been applied to all samples investigated in this work (p= 0.069, 0.075, 0.09, 0.11, 0.15, 0.22). It is easy to find that the scaling quality becomes better and better when the doping concentration is increased from 0.069 to 0.15. One can even see the gradual change among these underdoped samples (p=0.069, 0.075, 0.09, 0.11): the scaling curves fan out like that in Fig.17 for samples with , but the scaling pattern becomes narrower towards higher doping. The scaling behavior are shown in Figs. 18-20 for samples with , and . A clear trend for a better scaling at a higher doping can be easily seen here.
There are several possibilities for the failure of using Simon-Lee scaling law in underdoped region. One possibility is due to the impurity scattering effect as suggested by Kbert et al.Hirschfeld . Thus we use the dirty limit formula to fit the data at zero K, where . For the simplicity we show here only the fit to the data of the sample . It is found that the data can also be roughly fitted by the relation with impurity scattering (as shown by the dashed line in Fig.15). The obtained results for the sample with are: , mJ/mol , . Thus it seems that one cannot rule out the possibility of impurity scattering to play a dominant role in the field induced change of in very underdoped sample. However this speculation cannot interpret the nice dependence of the field induced DOS at zero K as shown in Fig.15. Worthy of noting is that the dirty limit formula of Kbert et al.Hirschfeld is more flexible to fit to the data than the simple relation. One needs to seek an alternative way to clarify this discrepancy.
The second possibility is the core size effect as appearing in the overdoped sample. We then try to scale the data by using eq.8 and leaving both and as free fitting parameters. Unfortunately no good scaling can be found by choosing any values for and . This is in consistent with the fact that an unreasonable negative value for is obtained if we fit the zero temperature data in Fig.15 to the first term of eq.7. Both indicate that the failure of Simon-Lee scaling law here is not due to the core size effect. One may argue that the data is scalable with only a very narrow scaling region of , for example, from Fig.16-18, the scalable region is about . This is of course possible since we don’t know the precise value for many parameters. However we can have a rough estimation to check whether this is reasonable. Provided the scalable region is , inputting , one has =64 T which seems too big for this very underdoped sample.
Another possible reason for the failure of the scaling law is that the sample is in the underdoped region with a pseudogap in the normal state. When the sample is in the mixed state, some competing or coexisting order such as short range antiferromagnetic orderLake ; Kang ; ZhangSC ; Arovas ; ZhuJX ; ChenY ; Franz2 , or the SDW orderSachdev , or a d-density wave (DDW) orderDDW is enhanced, and this newly generated or enhanced order will certainly give contribution to the total specific heat. For example, for 2D AF correlation, it is known that . Therefore qualitatively the failure of the Simon-Lee scaling law in underdoped region can be understood in the following way. By increasing the magnetic field, a second order is generated or enhanced within the vortex core and nearby regions (about 100). On one hand this region is gapped leading to the decrease of the total DOS at fermi level simply by reducing the region where the supercurrent can flow. On the other hand the newly generated AF or SDW or DDW region will contribute a new term to the total specific heat due to spin or other type excitation. The relevant competing order under a magnetic field, according to both neutron scatteringLake ; Kang and NMR measurementNMR , may be the AF order. STM measurement by Hoffman et al.Hoffman indicates a checkerboard like modulation with periodicity of of the LDOS. This was regarded as the direct observation of the strong electronic correlation with the underlying competing order which was predicted by many theoretical workArovas ; ZhuJX ; ChenY ; Franz2 ; Zaanen ; Low ; Sachdev2 ; ZhangSC2 . This qualitative picture calls for further detailed analysis and evidence from other experiments. Since the heat capacity from the newly generated or enhanced second order has a temperature dependence of with , at zero temperature the specific heat from this term is zero, thus the law from the Doppler shift of the d-wave superconductivity is restored. This may be the reason for that the zero-temperature data follows the law but the data at finite temperatures do not satisfy the Simon-Lee scaling very well.
III.5 The residual linear term
.
crystals. It is clear that the minimum value is found in the region around p =0.11 to 0.125 .
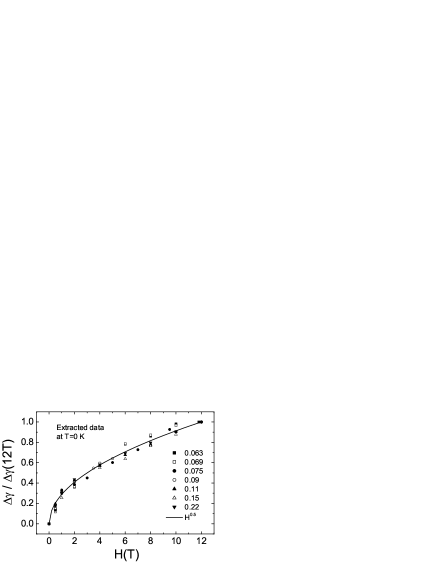
Almost in all cuprate superconductors, a residual linear term of electronic specific heat has been observed in the low temperature limit 0, even in the best samples up to date. In single crystals, Moler et al.Moler found that is larger for the twinned samples than the detwinned ones. Meanwhile they further found that increases when the sample becomes more underdoped. Clearly one can conclude that is related to the impurities or disorders in the samples. While quite surprisingly, for many samples with quite different values, it is found that the zero temperature data can be expressed as , showing evidence for d-wave pairing. This may suggest that is not mainly induced by the impurity scattering, since otherwise the field induced extra DOS should not follow the relation so well. In Fig.21, we present the field dependence of normalized to the value for each sample at about 12 T. Meanwhile we show the law by the solid line. One can see that for almost all samples, the field induced extra DOS at zero K follows the relation reasonably well despite the value highly disperses. This feature was also discovered by Chen et al.Chen on three typical samples ( and ). Nohara et al.Nohara measured three single crystals (x = 0.10, 0.16 and 0.19) and empirically found that the optimally doped sample (x = 0.16) has the lowest value of (=2.8, 1.5 and 2.2 for x=0.10, 0.16 and 0.19 respectively obtained from Fig.1 of Ref.Nohara ). Chen et al.Chen found the similar behavior among three samples with and (=1.49, 0.7 and 1.41 respectively). This raises the question of the origin of this residual linear term and its correlation with the field induced quasiparticle DOS. As mentioned before, if the field induced DOS is related to the impurity scattering, another relationHirschfeld is expected. This is some time contradicting to the experimental result (see dotted line in the main panel of Fig.5). In addition, the dependence of the field induced change of is certainly not obtained by accident, since it is found on different samples from different groups, even on poly-crystalline samplesChen . From the point of view of chemistry it is not true that the optimally doped sample is the cleanest one since in most cases the underdoped samples can be more easily grown with high quality. In this sense the residual linear term may be related to some other properties rather than the impurity scattering. In Fig.22 the values for different single crystals measured in our experiment from underdoped to overdoped are shown. The value of is obtained by fitting zero field data to eq.2 (see Table-I). It is clear that the minimum is found in the region around 0.11 or 0.125. The value for found from our data are more close to the data of Nohara et al.Nohara on single crystals, but clearly higher than that obtained on polycrystalline smplesChen . So far we don’t know the reason for this discrepancy. For our extremely underdoped sample (x = 0.063) investigated here, although the data at finite temperatures cannot be treated with the Simon-Lee scaling law, the data in the low temperature limit can be however still nicely expressed by , even the absolute increase of by field is much smaller than . Therefore it is reasonable to conclude that the field induced part is mainly contributed by the Doppler shift effect on the supercurrent outside the vortex cores, while the residual linear term is mainly contributed by some small normal regions which weakly depends on the magnetic field. Similar explanations to the origin of have been suggested for many times in the pastPhillips2 . This may be understood in the following way. In underdoped single crystals, scanning-tunneling-microscopic (STM) measurement indeed reveal a mixture of superconducting regions with sharp quasiparticle coherent peaks on the tunnelling spectrum, and the non-superconducting regions with pseudogap-like tunneling spectrumSTM . In the overdoped side, the tiny normal cores as proposed in the Swiss cheese modelUemura2 , or the mesosscopic normal regions suggested by Fukuzumi et al.Fukuzumi and Wen et al.Wen will contribute a residual term which does not show an apparent increase with the field. As proposed by Fukuzumi et al.Fukuzumi that the dome-like electronic phase diagram may be formed by the mixture of three phases: anti-ferromagnetic phase in the extremely underdoped region, a d-wave superconducting region with the robust superconductivity near the optimal doping point and a non-superconducting Fermi liquid in the overdoped region. According to this simple picture the should increase in the underdoped and overdoped region, which is just the case as shown by the data in Fig.22. Therefore we would argue that the residual linear term may be mainly contributed by some non-superconducting regions due to phase separation, either chemical or electronic in origin. This interesting argument needs certainly to be further checked with data obtained by different techniques on different systems.
III.6 Field induced reduction of specific heat in high temperature region
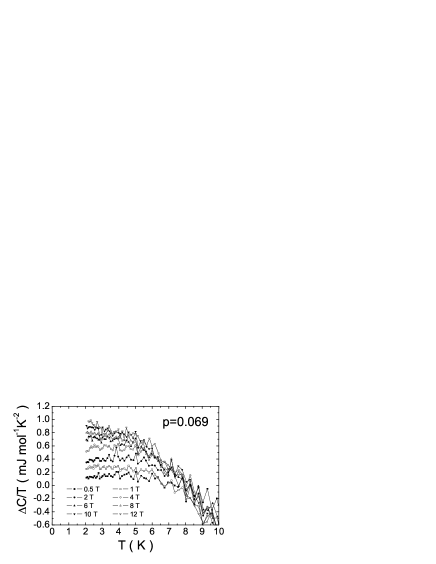
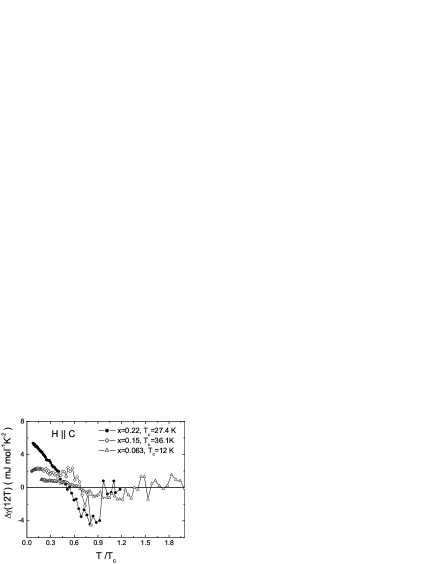
In above analysis, we concentrate on the data below 10 K ( below 6 K for the very underdoped sample). This is also the temperature region that most of the low temperature specific heat data was reported in the literatures. Now we report another phenomenon: field induced reduction of specific heat in the mixed state. In Fig.23 we present the temperature dependence of the field (12T) induced change of for three typical samples analyzed above, here . Although the data are strongly scattered one can still see that: (1) The field induced change becomes negative at about ; (2) The curves have a similar shape: is positive in low temperature region, then it becomes negative and finally comes back to zero in high temperature region (near for optimal and overdoped sample). For the overdoped sample, the keeps negative above until at which suddenly goes back to zero. For the optimally doped one, the is negative above about up to the highest temperature we measured here (30 K). However for the underdoped sample, it shows that the keeps negative until . Similar data were obtained by Fisher et al.Fisher on samples with . Our data near is more scattered since our setup can only measure samples with maximum mass of 50 mg. This feature, namely the negative in high temperature region is a consequence of entropy consideration, which has been observed in all types of superconductors. In low temperature region, when a magnetic field is applied, vortices will be generated leading to higher DOS near Fermi surface, so that is positive. When the temperature is increased, to satisfy the field independent entropy above , in a certain region below , should be negative. The most interesting point is for the underdoped sample here, even above one clearly sees a magnetic field induced change of entropy. This implies an abnormal normal state which is far from a conventional metal. For a conventional s-wave superconductor, the field induced change of can be negative near . It is difficult to understand the field induced reduction of specific heat well below , since the normal core region always gives rise to a higher DOS of quasiparticle. Outside the vortex core the DOS is almost negligible. However this field induced reduction of specific heat well below is found to be a general feature of all LSCO crystals we investigated so far. This may be related to the intrinsic properties of cuprate superconductors. In a d-wave superconductor, theoretically it is predicted that there is a ZBCP within the vortex core which should also contribute a quite high DOSWangYong ; Franz in the mixed state. Besides, a high DOS will be generated by the Doppler shift effect of the supercurrent surrounding the vortex core. Normally the sum of these two terms are larger than the zero-field term , leading to a field induced enhancement of DOS in low temperature region. When the temperature is high, the Doppler shift effect will be smeared out by the strong thermal excitation and finally becomes negative. As far as we know, no quantitative theoretical expression about has been reported so far for a d-wave superconductor in wide temperature region. We cannot have a quantitative understanding to our data. However, this field induced reduction of specific heat well below may be understood as due to the anomalous feature of vortex core state, i.e., a gapped vortex core as seen by the STM.Pan , or based on the assumption that the contributions from the core region is much smaller than the outside region where either the Doppler shift or the strong thermal excitation dominates. Actually the Simon-Lee scaling law becomes a relation in high temperature region. In this case the quasiparticle excitation outside the vortex core is almost the same () with or without applying a magnetic field. However since the vortex core region is gapped or contributes negligible part to the total DOS, one needs to take the core region away from the total area in calculating , naturally leading to a negative value of .
IV Discussion
In low temperature region, our analysis indicates that the field induced quasiparticle DOS can be well described by Volovik’s theory or Simon-Lee scaling law although a correction due to the core size effect is needed for the overdoped sample. This means that the prerequisite for the theory, i.e., the pairing symmetry is well satisfied. Therefore it naturally rules out the presence of a second order parameter like or either due to overdopingYehNC or due to the field effectLaughlin in all samples investigated here. Meanwhile, for the overdoped sample, another interesting phenomenon is that the vortex core region contributes very little (at least much smaller than that induced by the Doppler shift if the super-current would flow in the same area) to the total DOS. We have also tried to analyze the data of the optimally doped and underdoped sample in the way as that for overdoped one, for example to fit the data in Fig.11 and Fig.15 to the first term in eq.7. It turns out however that the correction term derived is small and negative which is unreasonable. For the optimally doped sample, it is quite easy to understand since the vortex core becomes very small. However for the underdoped sample, it is quite hard to understand since the core size tends to grow up tooWen2003EPL . The negligible contribution from the vortex core region may suggest that the ZBCP is absent within the cores, even in the overdoped region. This suggestion inferred from the specific heat measurement about the ZBCP within the vortex core is consistent with the tunnelling resultsMaggio ; Renner ; Pan ; Hoogenboom ; Dagan and certainly clears up the concerns about the surface conditions in the STM measurement. Recent results from NMR also show the absence of a ZBCP inside the vortex coreMitrovic . In this sense our data together with the earlier NMR data present a bulk evidence for an anomalous vortex core. Interestingly it is widely perceived that the normal state in overdoped region shows a Fermi liquid behavior even when the superconductivity is completely suppressedProust . If this is the case the mean-field frame of BdG theory based on the conventional d-wave superconductivity seems not enough to interpret the anomalous vortex core state in HTS. For the underdoped sample, the Simon-Lee scaling fails except for in very low temperature region. This is interpreted as due to the presence of a second (gapped) order like AF or SDW or DDW within and nearby the vortex core. However one needs more theoretical and experimental efforts to show the justice of this argument.
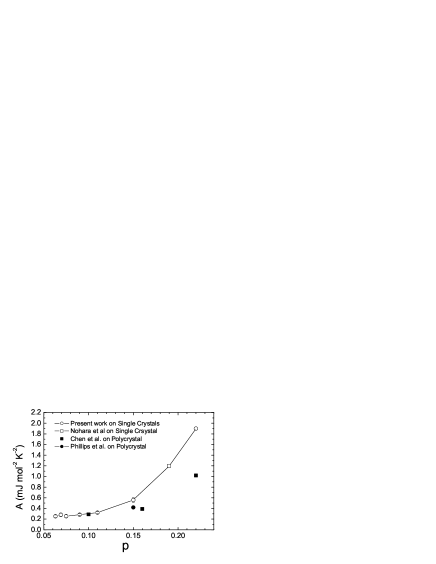
By fitting the field induced extra DOS at zero temperature to the relation , we obtained the pre-factor in wide doping regime, where Hussey . The results are presented in Fig.24. It is seen that the A-value increases with the doping concentration monotonously. This can be understood in the following way: by increasing doping the normal state value will increaseLoram , the will drop down (at least it is the case in the overdoped region). Therefore A-value will increase monotonously in the overdoped side. One can see from the data that the A-value keeps almost constant in the extremely underdoped region, which means that and should both decrease with underdoping. This indicates that the becomes smaller and the coherence length becomes larger towards more underdoping. This is consistent with the recent conclusion drawn by Wen et al.Wen2003EPL by analyzing the data about the low temperature flux dynamics. This conclusion about the coherence length calls for a direct check to the vortex core size by using scanning-tunnelling-microscopy in the future.
V Concluding Remarks
In conclusion, the field induced change of the electronic specific in mixed state of a series single crystals has been measured and extensively analyzed. It is found that the field induced DOS of the optimally doped sample fits the predicted Simon-Lee scaling law for a d-wave superconductor very well, while deviations have been found for the overdoped sample. However, it is reconciled for the overdoped sample if one considers the core size effect provided the contribution from the inner vortex core is small comparing to that due to the Doppler shift in the same area. The Simon-Lee scaling law is applicable in the underdoped region only in very low temperature region. We attribute this to the appearance of a second competing order (like AF or SDW or DDW) within and nearby the vortex core. The negligible contribution from the vortex core region may suggest the absence of the ZBCP in the vortex core, even in the overdoped region, although it is expected by the Bogoliubov de-Gennes theory for a d-wave superconductor. Finally we present the doping dependence of the residual linear term commonly observed in cuprate superconductors. It is argued that this linear term may be related to inhomogeneity (either electronic or chemical), rather than be simply explained as due to the small scale impurity scattering as usually thought. This conclusion is made because the field induced extra DOS at zero temperature follows the Volovik’s law reasonably well in all doping regime. It is hard to believe that this nice consistency is obtained by accident. Our results generally conclude a d-wave pairing symmetry for the hole doped samples, although some competing orders may co-exist with the superconductivity, and an anomalous feature (missing of the ZBCP) may appear within the vortex core.
VI Acknowledgments
This work is supported by the National Science Foundation of China , the Ministry of Science and Technology of China, the Knowledge Innovation Project of Chinese Academy of Sciences. We thank Xiaogang Wen, Dunghai Lee, Ashvin Vishwanath, Subir Sachdev, Jan Zaanen, C. S. Ting, Pengcheng Dai, Zhengyu Weng, Qianghua Wang, and Zidan Wang for fruitful discussions.
Correspondence should be addressed to hhwen@aphy.iphy.ac.cn
References
- (1) C. C. Tsuei, and J. R. Kirtley, Rev. Mod. Phys. 72, 969 (2000), and references therein.
- (2) C. C. Tsuei, J. R. Kirtley, Z. F. Ren, J. H. Wang, H. Raffy, Z. Z. Li, Nature 387, 481 (1997), and references therein.
- (3) Z.-X. Shen, D. S. Dessau, B. O. Wells, D. M. King, W. E. Spicer, A. J. Arko, D. Marshall, L. W. Lombardo, A. Kapitulnik, P. Dickinson, S. Doniach, J. DiCarlo, T. Loeser, and C. H. Park , Phys. Rev. Lett. 70, 1553 (1993); D. J. Scalapino, Phys. Rep. 250, 330 (1995).
- (4) W. N. Hardy, D. A. Bonn, D. C. Morgan, Ruixing Liang, and Kuan Zhang, Phys. Rev. Lett. 70, 3999 (1993).
- (5) A. G. Sun, D. A. Gajewski, M. B. Maple, and R. C. Dynes, Phys. Rev. Lett. 72, 2267 (1994).
- (6) N.-C. Yeh, C.-T. Chen, G. Hammerl, J. Mannhart, A. Schmehl, C. W. Schneider, R. R. Schulz, S. Tajima, K. Yoshida, D. Garrigus, and M. Strasik, Phys. Rev. Lett. 87, 87003 (2001).
- (7) N. Bulut and D. J. Scalapino, Phys. Rev. Lett. 68, 706 (1992). G.-q. Zheng, H. Ozaki, Y. Kitaoka, P. Kuhns, A. P. Reyes, and W. G. Moulton, Phys. Rev. Lett. 88, 77003(2002).
- (8) K. A. Moler, D. J. Baar, J. S. Urbach, Ruixing Liang, W. N. Hardy, and A. Kapitulnik, Phys. Rev. Lett. 73, 2744 (1994). K. A. Moler, John R. Kirtley, Ruixing Liang, Douglas Bonn, and Walter N. Hardy, Phys. Rev. B 55, 12753 (1997).
- (9) B. Revaz, J.-Y. Genoud, A. Junod, K. Neumaier, A. Erb, and E. Walker, Phys. Rev. Lett. 80, 3364 (1998).
- (10) D. A. Wright, J. P. Emerson, B. F. Woodfield, J. E. Gordon , R. A. Fisher, and N. E. Phillips, Phys. Rev. Lett. 82, 1550 (1999).
- (11) R. A. Fisher, N. E. Phillips, A. Schilling, B. Buffeteau, R. Calemczuk, T. E. Hargreaves, C. Marcenat, K. W. Dennis, R. W. McCallum, A. S. O’Connor, Phys. Rev. B61, 1473 (2000).
- (12) N. E. Phillips, R. A. Fisher, A. Schilling, B. Buffeteau, T. E. Hargreaves, C. Marcenat, R. Calemczuk, A. S. O’Connor, K. W. Dennis and R. W. McCallum, Physica B 259-261, 546 (1999).
- (13) M. Nohara, H. Suzuki, M. Isshiki, N. Mangkorntong, F. Sakai, and H. Takagi, J. Phys. Soc. Jpn. 69, 1602 (2000).
- (14) S. J. Chen, C. F. Chang, H. L. Tsay, H. D. Yang, J.-Y. Lin, Phys. Rev. B 58, R14753 (1998).
- (15) N. B. Kopnin and G. E. Volovik, JETP Lett. 64, 690 (1996).
- (16) G.E. Volovik, JETP Lett. 58, 469 (1993); ibid 65, 491 (1997).
- (17) For a review on the low energy quasiparticles, see N. E. Hussey, Advances in Physics 51, 1685 (2002).
- (18) S. H. Simon, P. A. Lee, Phys. Rev. Lett. 78, 1548 (1997).
- (19) B. Lake, H. M. Rennow, N. B. Christensen, G. Aeppli, K. Lefmann, D. F. McMorrow, P. Vorderwisch, P. Smeibid, N. Mangkorntong, T. Sasagawa, M. Nohara, H. Takagi, T. E. Mason, Nature 415, 299(2002).
- (20) H. J. Kang, Pengcheng Dai, J. W. Lynn, M. Matsuura, J. R. Thompson, Shou-Cheng Zhang, D. N. Argyriouk, Y. Onose, Y. Tokura, Nature 423, 522(2003).
- (21) G. E. Volovik and N. B. Kopnin, Phys. Rev. Lett. 78, 5028(1997).
- (22) Y. Wang, A. H. MacDonald, Phys. Rev. B 52, R3876 (1995).
- (23) M. Franz, Z. Tesanovic, Phys. Rev. Lett. 80, 4763 (1998).
- (24) I. Maggio-Aprile, Ch. Renner, A. Erb, E. Walker, and . Fischer, Phys. Rev. Lett. 75, 2754 (1995).
- (25) Ch. Renner, B. Revaz, K. Kadowaki, I. Maggio-Aprile, and . Fischer, Phys. Rev. Lett. 80, 3606 (1998).
- (26) S. H. Pan, E. W. Hudson, A. K. Gupta, K.-W. Ng, H. Eisaki, S. Uchida, and J. C. Davis, Phys. Rev. Lett. 85, 1536 (2000).
- (27) B. W. Hoogenboom, K. Kadowaki, B. Revaz, M. Li, Ch. Renner, and . Fischer, Phys. Rev. Lett. 87, 267001 (2001).
- (28) Y. Dagan, G. Deutscher, Phys. Rev. Lett. 87, 177004 (2001).
- (29) V. F. Mitrovic, E. E. Sigmund, M. Eschrig, H. N. Bachman, W. P. Halperin, A. P. Reyes, P. Kuhns, W. G. Moulton, Nature 413, 501 (2001).
- (30) C. Kbert, P. J. Hirschfeld, Solid State Comm. 105, 459 (1998). C. Kbert, P. J. Hirschfeld, Phys. Rev. Lett. 80, 4963 (1998).
- (31) I. Vekhter, P. J. Hirschfeld, and E. J. Nicol, Phys. Rev. B 64, 064513 (2001).
- (32) H. H. Wen, H. P. Yang, S. L. Li, X. H. Zeng, A. A. Soukiassian, W. D. Si, and X. X. Xi, Europhys. Lett. 64, 790 (2003).
- (33) Yayu Wang, S. Ono, Y. Onose, G. Gu, Yoichi Ando, Y. Tokura, S. Uchida, and N. P. Ong, Science 299, 86 (2003).
- (34) Y. J. Uemura, et al., Nature 364, 605 (1993); ibid. Physica C282-287, 194 (1997).
- (35) X. F. Sun, Seiki Komiya, J. Takeya, and Yoichi Ando, Phys. Rev. Lett.90, 117004(2003).
- (36) S. L. Li, H. H. Wen, Physica C 316, 293(1999).
- (37) S. C. Zhang, Science 275, 1089(1997).
- (38) D. P. Arovas, et al., Phys. Rev. Lett.79, 2871(1997).
- (39) Jian-Xin Zhu and C. S. Ting, Phys. Rev. Lett.87, 147002(1997).
- (40) Y. Chen and C. S. Ting, Phys. Rev. B65, 180513(R)(2002); ibid 66, 104501(2002).
- (41) M. Franz, et al., Phys. Rev. Lett.88, 257005(2002).
- (42) E. Demler, S. Sachdev and Y. Zhang, Phys. Rev. Lett.87, 067202(2001); Y. Zhang, E. Demler and S. Sachdev, Phys. Rev. B 66, 094501 (2002).
- (43) S. Chakravarty,and H.-Y. Kee, Phys. Rev. B61, 14821(2000). C. Nayak, Phys. Rev. B62, 4880(2000); ibid 62, R6135(2000). S. Chakravarty, R. B. Laughlin, D. K. Morr, and C. Nayak, Phys. Rev. B63, 094503(2001).
- (44) J. E. Hoffman, E. W. Hudson, K. M. Lang, V. Madhavan, H. Eisaki, S. Uchida, J. C. Davis, Science295, 466(2002).
- (45) J. Zaanen, O. Gunnasson, Phys. Rev. B40, 7391(1989). J. Zaanen, Nature404, 714(2000).
- (46) U. Low, V. J. Emery, K. Fabricius, S. A. Kievelson, Phys. Rev. Lett.72, 1918(1994).
- (47) M. Vojta, S. Sachdev, Phys. Rev. Lett.83, 3916(1999). K. Park, S. Sachdev, Phys. Rev. B64, 184510(2001).
- (48) D. P. Arovas, A. J. Berlinsky, C. Kallin, S. C. Zhang, Phys. Rev. Lett.79, 2871(1997).
- (49) N. E. Phillips, et al.,Phys. Rev. Lett.65, 357(1990).
- (50) K. M. Lang, V. Madhavan, J. E. Hoffman, E. W. Hudson, H. Eisaki, S. Uchida, J. C. Davis, Nature 415, 412 (2002).
- (51) Y. J. Uemura, Solid State Commun. 120, 347 (2001).
- (52) Y. Fukuzumi, K. Mizuhashi, K. Takenaka, and S. Uchida, Phys. Rev. Lett. 76, 684 (1996).
- (53) H. H. Wen, W. L. Yang, Z. X. Zhao, Y. M. Ni, Phys. Rev. Lett. 82, 410 (1999); ibid. 85, 2805 (2000).
- (54) R. B. Laughlin, Phys. Rev. Lett. 80, 5188 (1998).
- (55) C. Proust, E. Boaknin, R. W. Hill, L. Taillefer, and A. P. Mackenzie, Phys. Rev. Lett. 89, 147003 (2002).
- (56) J. W. Loram, K. A. Mirza, J. R. Cooper, Phys. Rev. Lett. 71, 1740 (1993).