Epitaxial Frustration in Deposited Packings of Rigid Disks and Spheres
| Boris D. Lubachevsky | Frank H. Stillinger |
|---|---|
| Bell Laboratories | Department of Chemistry |
| Lucent Technologies | Princeton University |
| Murray Hill, NJ 07974 | Princeton, NJ 08544 |
| bdl@bell-labs.com | fhs@princeton.edu |
ABSTRACT
We use numerical simulation to investigate and analyze the way that rigid disks and spheres arrange themselves when compressed next to incommensurate substrates. For disks, a movable set is pressed into a jammed state against an ordered fixed line of larger disks, where the diameter ratio of movable to fixed disks is 0.8. The corresponding diameter ratio for the sphere simulations is 0.7, where the fixed substrate has the structure of a (001) plane of a face-centered cubic array. Results obtained for both disks and spheres exhibit various forms of density-reducing packing frustration next to the incommensurate substrate, including some cases displaying disorder that extends far from the substrate. The disk system calculations strongly suggest that the most efficient (highest density) packings involve configurations that are periodic in the lateral direction parallel to the substrate, with substantial geometric disruption only occurring near the substrate. Some evidence has also emerged suggesting that for the sphere systems a corresponding structure doubly periodic in the lateral directions would yield the highest packing density; however all of the sphere simulations completed thus far produced some residual “bulk” disorder not obviously resulting from substrate mismatch. In view of the fact that the cases studied here represent only a small subset of all that eventually deserve attention, we end with discussion of the directions in which first extensions of the present simulations might profitably be pursued.
1 Introduction
A diverse group of physical processes, both in nature and in human technological activities, involve deposition of various substances on solid substrates. Examples of the former include accretion of low molecular weight materials on interstellar grains at low temperature [1], and on high-altitude air-borne particles in the terrestrial atmosphere [2]. The latter category covers the now-indispensable industrial practices that produce miniaturized integrated circuitry for computer technology [3]. But whether driven by pure scientific curiosity or by economic and societal needs, understanding the subtleties of deposition phenomena in surface physics generally remains a challenging subject. The present paper is intended to contribute in at least a modest way to deepening that understanding.
The specific objective behind our study is clarification of geometric frustration effects in deposition processes that can arise from size discrepancy between particles of the solid substrate, assumed here to be crystalline, and particles of the deposited layer. In order to attain at least a simplified view of such frustration effects, we have chosen to examine the idealized rigid disk (two dimensional) and rigid sphere (three dimensional) models for the operative interparticle interactions. The present investigation is an extension of our previous publication that investigated the statistical geometry of disk and sphere packings, but where the substrate particle sizes were identical to those of the added layer [4]. Now we relax that restriction. The simulation procedure again involves continuous compression of the depositing material, initially in a random fluid state, toward the substrate until jamming occurs. The incommensurate substrate used in the present study is represented as a fixed crystal layer containing no defects (screw dislocations, missing particles, etc.). However, the size mismatch between this layer and the particles forced into contact with it creates stacking disorder in the deposited layer, the types and amounts of which are a focus of the present investigation.
Of course representing real atomic, ionic, or molecular interactions as those operating between rigid disks or spheres is a drastic simplification. Nevertheless, it is a simplification with a long and worthy history. With respect to jammed arrangements of disks and spheres, one can cite a broad array of published papers that involve experimental [5, 6, 7], simulational [4, 8, 9, 10, 11, 12], and analytical [13, 14, 15, 16, 17] techniques. In many of the past studies, care has been exercised to eliminate boundary effects; by contrast here we specifically focus on a special class of those effects.
The following Section 2 presents details of our numerical simulation procedure. These details include choices about system sizes, particle size ratios and epitaxial surface geometries, compression rates, and jamming criteria. Section 3 collects numerical results for the two-dimensional disk calculations emerging from that procedure. Section 4 does the same for the three-dimensional sphere cases. The final Section 5 includes several conclusions based on the results; it also offers discussion and speculation about several features of this class of epitaxial packing phenomena that, in our opinion, deserve future research attention.
2 Simulation Procedure
For both the two and three dimensional applications, the system geometry to be used must present the incommensurate substrate to the movable adsorbing particles, and must provide a means for tightly compressing the collection of those movable particles against that substrate. In order to satisfy these requirements, a rectangular (two dimensions) or rectangular solid (three dimensions) cell is utilized, one face of which is the structurally fixed incommensurate substrate. The opposite face also consists of a structurally fixed array of disks or spheres that are in contact with one another, but it is composed of particles equal in size to those of the movable set; this choice avoids further incommensurability and roughly simulates the effect of an infinite system depth in the direction normal to the substrate surface. The distance between these two faces is variable, and thus permits implementation of the required compaction process. The remaining two faces (for disks) or four faces (for spheres) retain fixed separation, and are treated as periodic boundary conditions.
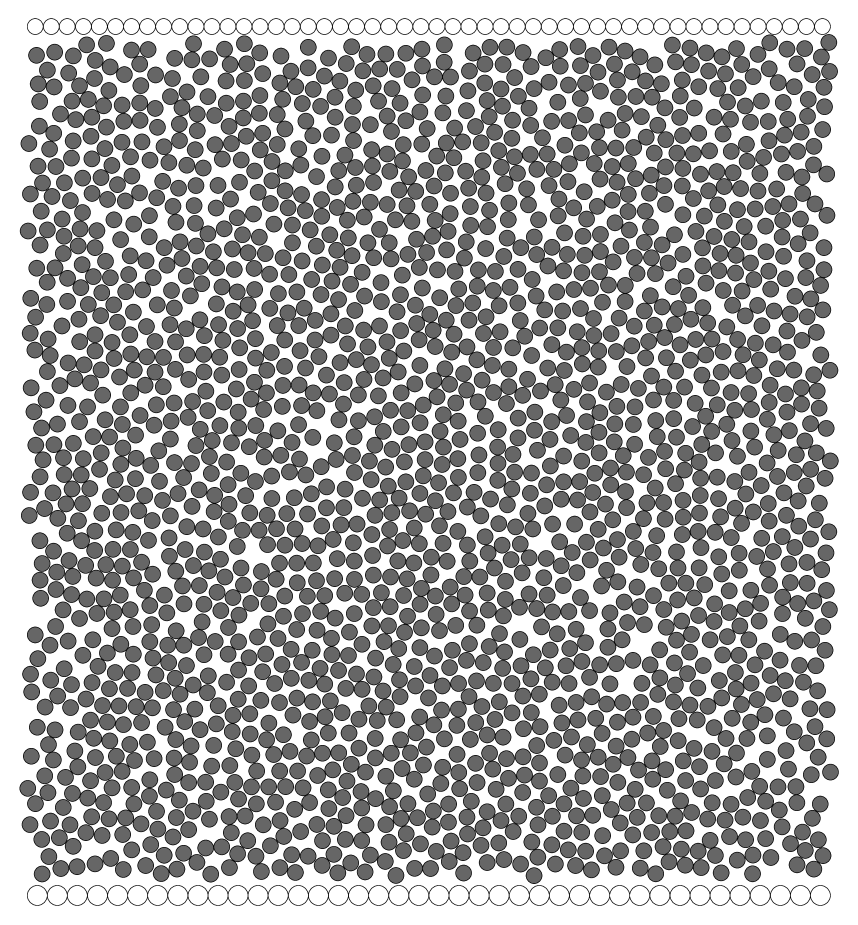
For purposes of illustration, Figure 2.1 provides a view of the initial stage of a disk compression. This example involves a linear arrangement of 40 fixed contacting disks acting as the incommensurate bottom boundary. The diameter of these fixed disks serves as the unit length for the calculations. The remaining disks have diameters equal only to 0.8 times this unit length. These 2050 smaller disks include 50 that form the rigid top layer, and 2000 that are individually free to move. The lateral distance between the left and right periodic boundaries remains equal to 40 length units (i.e. 50 smaller-disk diameters) during the subsequent numerical simulation. If in fact the fixed bottom layer also comprised 50 smaller disks, vertical compression could in principle produce a perfect triangular array consisting of a total of 42 horizontal rows, on account of the choices of movable disk number and lateral boundary separation. Among all possible arrangements of non-overlapping disks, the perfect triangular array (infinitely extended) attains the largest possible covering fraction:
| (1) |
In order to prepare an initial configuration such as that shown in Figure 2.1, we followed a procedure closely related to that employed in our earlier study [4]. This preparation stage first involves growing 2000 disks at a fixed rate from randomly placed points, while allowing for elastic collisions to avoid overlap of pairs of expanding disks. Disk growth is terminated when the target diameter 0.8 is attained. A detailed description of this growth process is available in reference [11]. In the present case, the growing disks are confined to a fixed-size rectangle , subject to periodic boundary conditions in both directions, with , and initially selected so that the 2000 fully-grown disks within the initial area have a covering fraction equal to . This requires choosing at this preparation stage.
Having generated this moderate-density configuration for the 2000 movable disks, it is then necessary to bound them at bottom and top respectively with the structurally-fixed layers of 40 unit-sized substrate disks, and 50 smaller-sized (diameter 0.8) disks. This is done simply by placing those layers directly below (by 0.9 units) and directly above (by 0.8 units) the lower and upper boundaries of the preceding rectangular cell, thus just avoiding any overlaps. Subsequent to this addition, is measured from the centers of those lower and upper disk layers, consequently increasing this dimension by 1.7 units. The resulting distance between the centers of the lower and upper sets of bounding disks at the beginning of the compression phase, as illustrated in Figure 2.1, is thus
| (2) |
The 2000 movable disks (now with fixed diameters) between the structurally rigid layers inherited velocities from the initial setup stage, which were then normalized so as to have mean speed equal to unity. Subsequently, particle motions caused elastic collisions between pairs of movable disks, and between movable disks and the top and bottom layers. Simultaneously, compression toward a jamming limit was effected by moving the upper and lower layers symmetrically toward one another so that the vertical system dimension declines at the following constant rate:
| (3) |
On the basis of prior experience [4], this rate is sufficiently small that any final-stage disorder is expected to result primarily from incommensurabilty at the substrate, not from random jamming processes arising in the interior of the disk system. As a purely mathematical observation, in terms of the time-like progress variable , compression would cause the collision rate to increase, and formally to diverge as the jammed state is approached [4, 11]. However, practical numerical considerations require (a) scaling particle velocities downward at late stages of the compression, and (b) terminating any run after a finite, but large number of collisions, chosen so that in fact the particle system is geometrically very close to its ideally jammed state. Our simulations consisted of series of dynamical “sessions”, each containing a number of collisions equal to an average per particle of ; if 10 successive sessions produced reductions in the covering fraction by less than , the compression to jamming was numerically regarded as complete.
Five distinct examples of the disk-system type just described have been processed. They differed only in the random number seeds used to initiate the runs. In addition to these, five more disk cases were examined in which only 1990 small movable disks (diameter 0.8), rather than 2000, were present. The motivation for reducing the movable set by 10 was that the lower bounding substrate presented 10 fewer “pockets” than those of the upper bounding layer, and it was of interest to see what effects, if any, this modification would produce in the final jammed structures. In order to have the same initial covering fraction with this reduced number of movable disks, the initial cell dimension was correspondingly slightly reduced.
The initial conditions employed for the three-dimensional sphere simulations were analogous to those for the disk examples. The structurally rigid substrate surface, composed of unit-diameter spheres, consisted of a (001) face of a face-centered cubic close-packed array. This amounts to a set of mutually contacting spheres in a simple square planar arrangement. The movable spheres, as well as those comprising the upper bounding layer that is also a simple square planar array, possessed a smaller diameter equal to 0.7 length units. The lower (substrate) square array contained 441 unit spheres in a 2121 pattern. The upper layer square array contained 900 smaller spheres in a 3030 pattern.
Two choices were made for the total numbers of mobile smaller spheres, similarly to the disk cases, but necessarily much larger in magnitude. The specific values selected were 18,000 and 17,541. The former choice in principle could form a perfect close-packed crystal between the bounding layers upon compression, if the lower substrate layer were also composed of 900 small spheres. The latter choice involves 459 fewer small spheres, reflecting the smaller number of square “pockets” in the substrate layer. On account of these much larger particle numbers compared to the disk cases, it was practical to simulate only single examples of each of these two kinds of sphere systems. The initial preparation stage grew the required number of movable spheres from randomly generated points to the final common diameter 0.7, in a rectangular-solid region with vertical length chosen so that the resulting non-overlapping spheres were present at covering fraction . Here, the maximum covering fraction for spheres, attainable in an infinitely extended face-centered cubic packing, is equal to:
| (4) |
Following this growth stage, the lower and upper bounding crystal surfaces were put in place at bottom and top of the initial rectangular-solid cell, thus increasing the vertical dimension by 1.55 units.
Immediately after this sphere-system preparation process, the velocities of the movable particles were renormalized to have mean magnitude unity. The subsequent compression phase of the simulation involved the following rate of height reduction:
| (5) |
As in the case of disks, this compression was presumed to be slow enough to permit kinetic processes prior to jamming to anneal out most disorder arising from bulk-system packing irregularities. Substantially the same kind of termination criterion as used for the disk simulations was invoked to decide numerically when the sphere compression stage was “complete”.
One of the fundamental properties to be determined for each simulated jamming case is the final covering fraction. Such results need to be interpreted in relation to the maximum values in Eq. (1), and in Eq. (4), which refer to optimal packings of infinite extent. By contrast, the present study involves finite systems and emphasizes the effects exerted by boundaries in those finite systems. Several different conventions are possible when defining the covering fraction for a finite disk or sphere sample with boundaries of the type specified above. The most straightforward convention would report the value of:
| (6) |
for the covering fraction at compression time . Here, and respectively denote the total disk area, and total sphere volume, occupied by all particles or portions thereof, lying within the rectangular or rectangular solid system region. This includes the entire area or volume covered by movable particles, but only semicircles or hemispheres for those particles comprising the structurally fixed lower substrate and upper boundary layers. However, for some purposes it is desirable to eliminate the lower and upper bounding-layer particles from consideration, thus focusing attention entirely on the movable set. A rational way to do so would be to replace and with and , and to diminish the cell area or volume by an amount attributable to the boundary layer “half-particles” in their close-packed configurations. Consequently, this alternative choice for the covering fraction definition would have the form:
| (7) |
Here and are the areas and volumes attributable to the boundary layer half-particles in their respective close-packed arrangements. Numerical values utilizing both definitions will be quoted below in discussing our results.
In addition to the covering fractions as an overall measure of the jammed packing geometry, several other more detailed measures have also been evaluated. These include spatial distributions of particle collision rates in the final stage of the jamming process, the stratification of the density of particle centers in the direction normal to the substrate surface, and the distribution of numbers of contacts experienced by particles in the final state. More global features of the final configurations are best conveyed by pictorial presentations of the jammed systems, and representative examples are presented in the following two Sections.
3 Numerical Results, Disks
Table 3.1 reports the final covering fractions and for the ten runs of disk simulations. These runs, designated ”A” through ”J”, have been classified by , the number of mobile disks. The last column in Table 3.1 provides a rough descriptive category for the type of geometric frustration exhibited by the final-state jammed configuration; details of these various frustration patterns appear below.
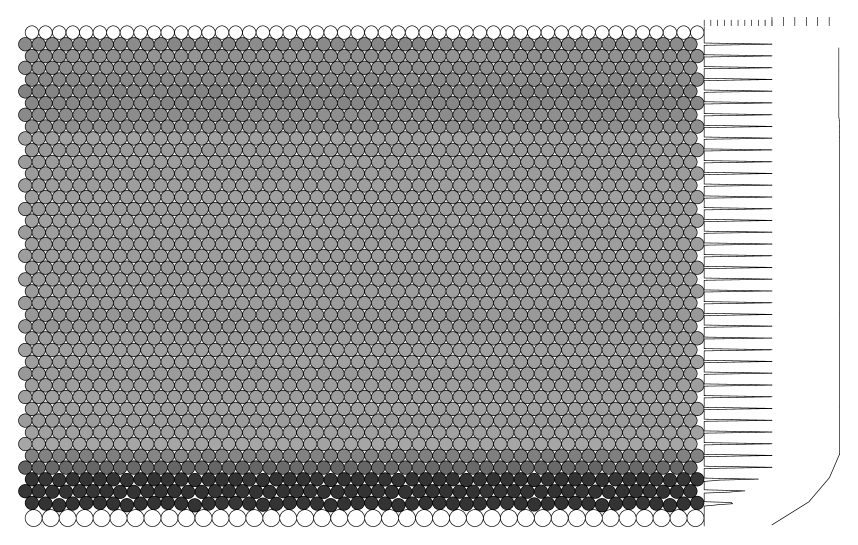
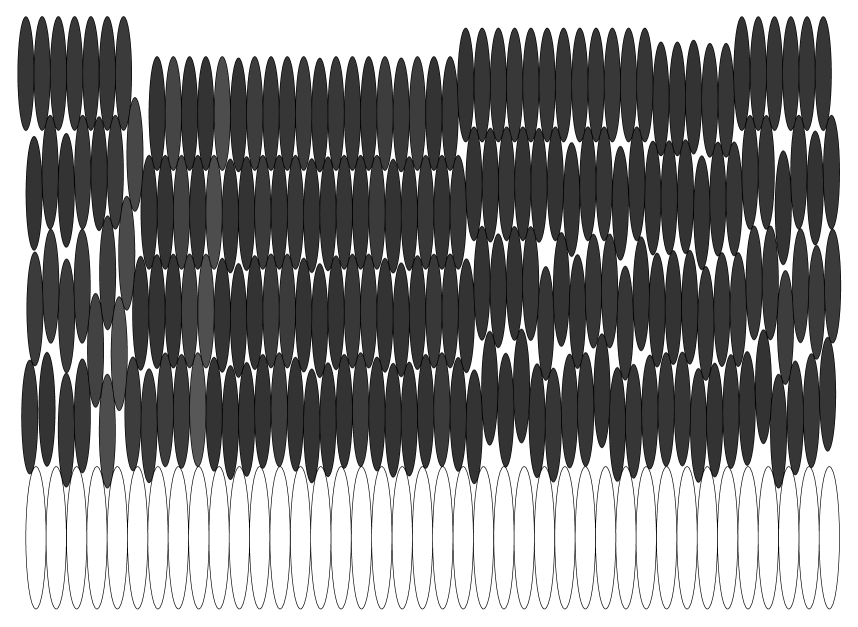
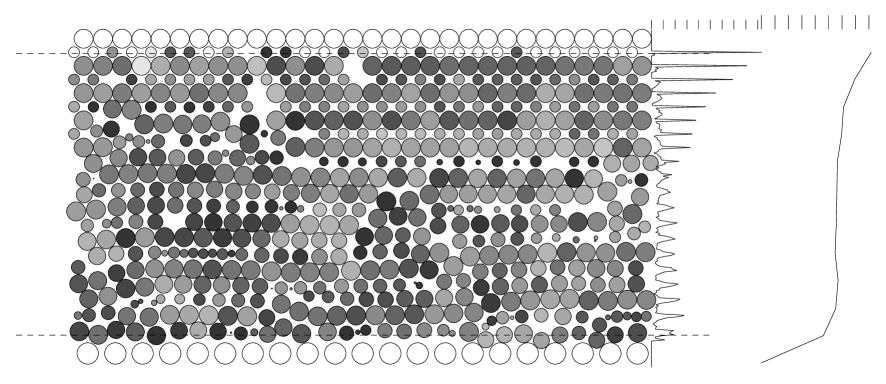
Figure 3.1 shows the final state after compression for case D whose initial configuration appears in Figure 2.1 A pair of simple graphs at the right edge of this picture present additional information about the configuration, as a function of the vertical coordinate, i.e. perpendicular to the structurally fixed bounding layers. The multi-peaked curve just to the right of the picture provides a view of the vertical distribution of mobile particle centers. The individual bins used to accumulate data for this graph have width equal to one-tenth the expected period for an undistorted crystalline arrangement of the smaller disks, namely 0.06928… units. The magnitude of the graph’s peaks can be deduced with the help of the ticks at the graph’s top edge. The -coordinate of the leftmost tick corresponds to 0, i.e., to the value “no particles in the bin”. The ticks follow with horizontal spacing of 10% of 50; note that 50 is the maximum number of particles whose centers can be found at a particular height. Thus, the second tick corresponds to 10%, i.e., to 5 particles in a bin, the third to 20%, i.e., to 10 particles, and so on. It is clear that, for this one example at least, the main disruption of the vertical-direction density distribution is strongly localized in the first few layers next to the larger-disk bottom layer.
The farther-right curve exhibits the vertical variation of contact and near-contact numbers for the movable particles, using vertical bin width equal to twice the ideal crystal spacing, and connecting the results with line segments for ease of visualization. The magnitude of this graph can be deduced with the help of a different set of ticks at the graph’s top edge, where again the leftmost tick corresponds to 0, i.e., to the value “no contact”, and the horizontal spacing between consecutive ticks corresponds to one contact. Thus, the second tick corresponds to one contact, the third to two contacts, and so on. The criterion for contact or near-contact involved identifying neighbors with their surfaces no further separated from the particle of interest than approximately disk diameters. As expected, the values shown tend to be depressed below the maximum possible (6) in layers with substantial geometric disruption.
The 2000 disks that were mobile during the compression phase of case D have been distinguished in Figure 3.1 by shading according to their relative collision rates during the final stages of approach to jamming. The lighter-shaded disks have experienced higher collision rates than the darker-shaded disks. The latter category includes a few “rattlers” (trapped but unjammed disks) with very low collision rates. For consistency, the mutually-contacting fixed particles comprised in the top and bottom layers are unshaded as though they had infinite collision rates. Examination of Figure 3.1 shows that disks near the bottom boundary have exhibited lower collision rates than those at higher elevations. In view of the fact that geometric frustration is concentrated near that bottom layer, the presence of this collision rate distinction should not be surprising. Even excluding the rattlers that are concentrated in the lower layers, the shading distinctions displayed in Figure 3.1 for movable disks span a spread of average collision rates of approximately two orders of magnitude.
N Case Category 2000 A 0.903169 0.903065 localized 2000 B 0.903160 0.903056 localized 2000 C 0.902808 0.902694 delocalized 2000 D 0.903189 0.903085 localized 2000 E 0.894369 0.894021 delocalized 1990 F 0.898742 0.898514 delocalized 1990 G 0.898783 0.898556 delocalized 1990 H 0.898790 0.898563 delocalized 1990 I 0.898648 0.898417 delocalized 1990 J 0.898861 0.898636 delocalized
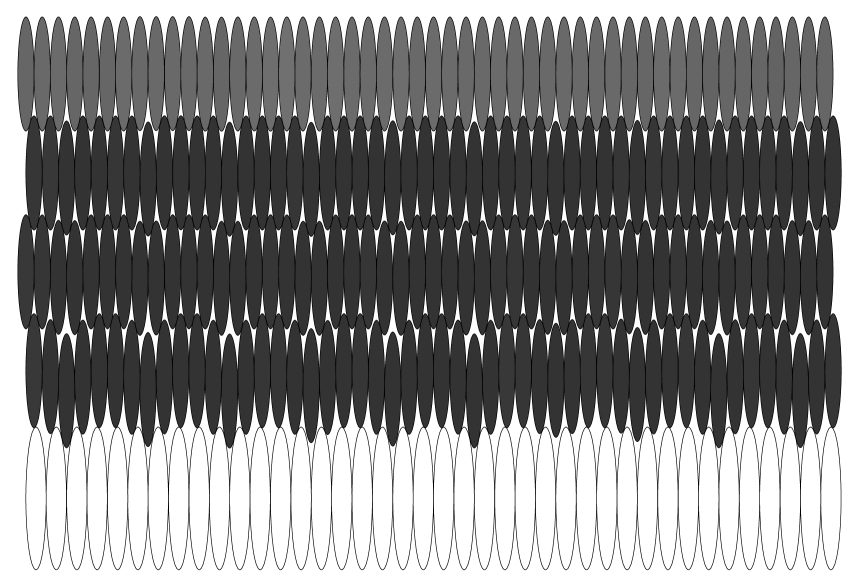
In order to clarify the detailed character of the frustrating size mismatch, Figure 3.2 shows a vertically expanded view of the disrupted first few layers, from case D in Figure 3.1 just above the large-disk lower bounding layer. The affine transformation used to create this view has stretched the vertical coordinate by a factor 7. The most important feature emphasized in this manner is that the epitaxial disruption tends to produce a horizontal periodicity of four distance units, in which members of the lowest small-disk layer alternate between fitting well down into the large-disk pockets, and being forced upward in varying degrees toward sitting atop large disks. This near-periodicity (length 4 is equivalent to 5 small-disk diameters) has the size ratio as its obvious source. Figure 3.2 makes it clear that the average amplitude of vertical displacement for this periodic pattern is relatively large for this first small-disk layer, but decreases rapidly with succeeding layers progressing upward. This feature is consistent with the collision rate differences noted above. Layers subject to a spatially oscillatory vertical deformation have a larger contour length than those that are not deformed (and are thus horizontally straight). As a result, their disks lie farther apart on average, so collisions with lateral neighbors in these deformed layers would be less frequent than in a perfectly aligned layer.
Table 3.1 shows that the case D configuration illustrated in Figures 3.1 and 3.2 nominally possesses the largest covering fraction of all five cases considered with 2000 mobile disks. Two other cases, A and B have slightly smaller, but similarly large covering fractions. Not surprisingly, examination of their final configurations shows that they also contain very nearly the same pattern of epitaxial frustration, mostly localized to the bottom few layers, in a horizontally nearly periodic fashion. The last column of Table 3.1 acknowledges this localization property for these three cases. The binned distributions of vertical-direction densities, and of contact and near-contact numbers, and the shading patterns for collision rates, are visually very similar to those shown in Figure 3.1, and so need not be separately presented pictorially. In fact, it is reasonable to suppose that A,B, and D are all converging toward exactly the same final jammed structure, but have not quite attained it on account of finite computing-time constraints.
The consistently high densities observed for cases A, B, and D, each exhibiting localized near-periodicity of disruption, suggests that the highest attainable density (for the given particle number, particle diameter, and ) might involve strict periodicity in the horizontal direction with period 4. Note that the setup of our simulations adapts easily to enforcement of such horizontal periodicity. We simply reduce the configuration sizes tenfold: The number of movable particles becomes 200, the horizontal dimension becomes equal to the horizontal period 4, and the numbers of particles in the bottom and top rigid layers become 4 and 5 respectively. This strategy is equivalent to constraining a 2000-particle simulation to a periodic subspace of its full configuration space, with a consequent substantial computational simplification and speedup.
In general, a reduction in the configuration space would decrease or leave unchanged the maximum attainable density. However, the evidence presented by cases A-E indicates that for the unconstrained 2000-particle system a large number of sub-optimal jammed configurations exists, making it unsure that random search would automatically discover an optimal perfectly periodic structure. In fact, we have run a few reduced-size 200-particle simulations as described, and the final configurations were always the same, with patterns just as suspected from examination of cases A, B, and D. Besides being strictly periodic with a 4-unit period, this suspected optimum packing apparently also possesses a mirror symmetry with respect to vertical axes. These vertical mirror-symmetry axes have a spacing of 2 units (i.e. one-half period) in the horizontal () direction. The values for the two covering fraction definitions, for these ideal period-4 jammed configurations, were found to be 0.903250 and 0.903148. These magnitudes slightly exceed the Table 3.1 entries for A, B, and D as initially suspected.
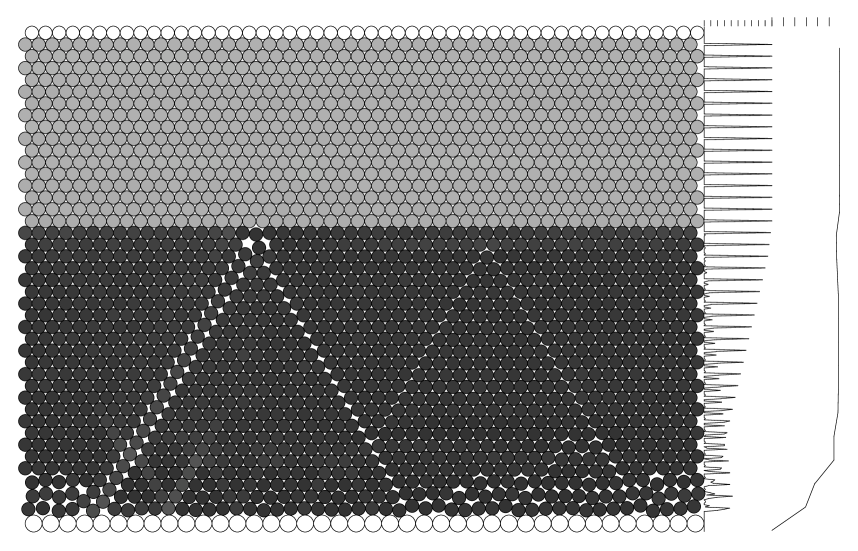
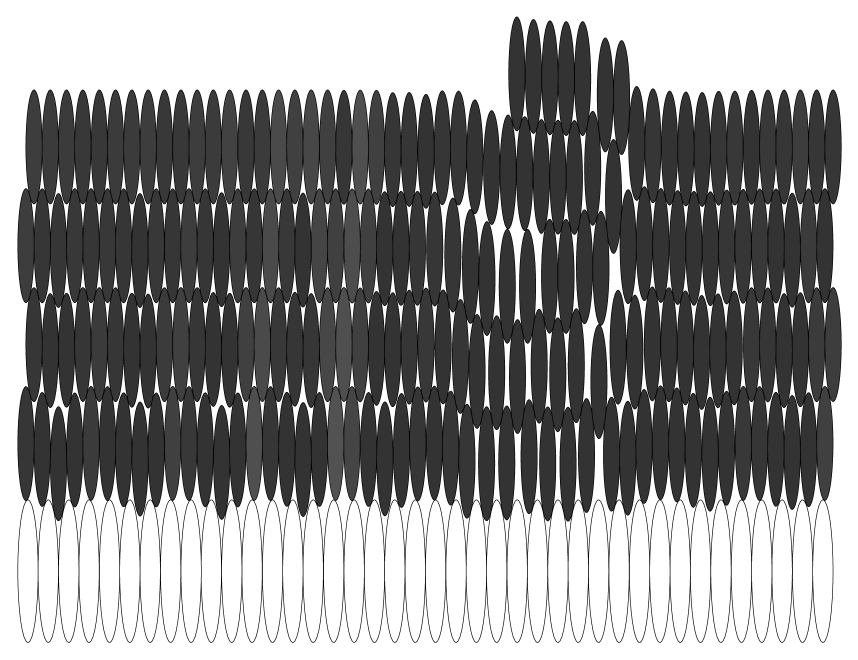
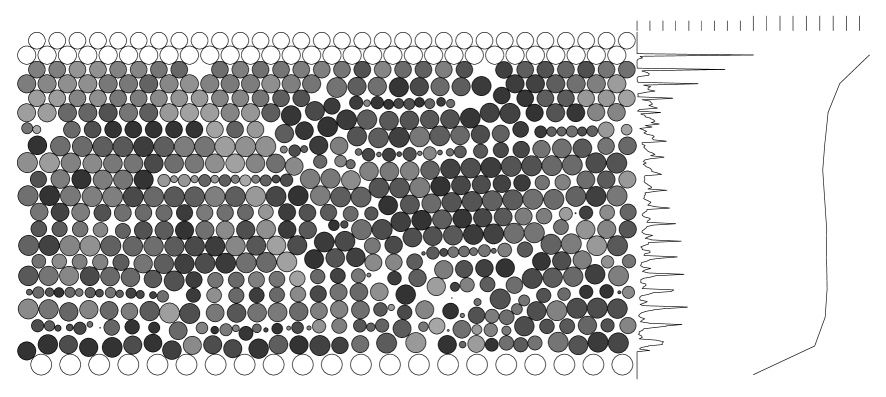
The remaining two 2000-mobile-disk jammed configurations listed in Table 3.1 (cases C and E) have significantly lower covering fractions. Figure 3.3 presents the final configuration obtained for the latter member of this pair. This view exhibits two linear mismatch seams in an inverted “V” arrangement, showing poor alignment with neighboring diagonal lines of particles (and thus showing gaps), extending more than halfway from bottom to top. The vertex of this “V” displays two relatively large pentagonal holes. The same collision rate shading rule has been used in Figure 3.3 as in the prior Figure 3.1. The vertical density distribution, and the contact and near-contact distribution, have again been provided at the right margin. In this case the former shows peak splitting due to the presence of the inverted “V”, and the latter a more complex pattern than before. Figure 3.2 shows the bottom few layers for this configuration E, with factor-7 vertical stretching to emphasize the geometric frustration details. The two cases C and E have been designated as “delocalized” in the last column of Table 3.1, owing to the fact that for both, disruption of the perfect triangular packing of disks has penetrated far above the bottom layer. This longer-range disruption explains the lower densities obtained for this pair of cases.
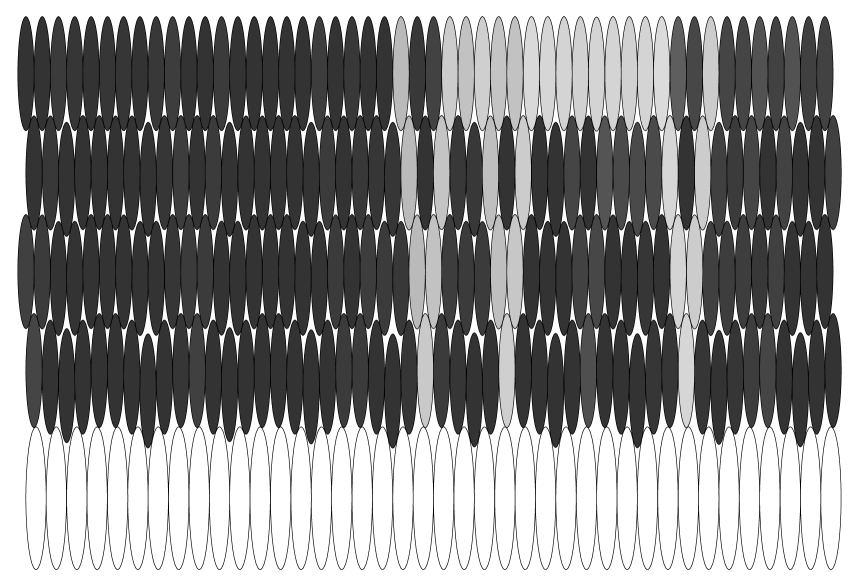
Table 3.1, last column, indicates that each of the five cases F-J with 1990 disks is “delocalized”. All of these have relatively low covering fractions and . Figure 3.5 presents the final configuration for case J. Figure 3.6 shows the vertically stretched version for its bottom few layers. The collision-rate shading pattern and the plots for vertical-density, as well as contact and near-contact numbers, in the first of these two Figures make it very evident that geometric frustration pervades virtually the entire vertical dimension of the jammed final state. However, the specific disruption patterns exhibited by these cases F to J are diverse, generally not closely resembling one another. This observation suggests that the 1990-disk system has a significantly larger number of distinct accessible jammed states than does the 2000-disk system, the majority of which incorporate delocalized disruption. To illustrate this diversity, Figures 3.7 and 3.8 present the final configuration and its stretched lower portion for case H to be compared with J, Figures 3.5 and 3.6. Evidently, removal of 10 mobile disks from the initially-examined 2000 can produce profound changes in the final geometric patterns.


In contrast to the 2000-disk cases, none of the final configurations for 1990-disk cases F to J looks even close to periodic in the horizontal direction. However, this does not preclude a search for horizontal period-4 solutions. All of the conditions for such a restricted configuration space search would be applied as before, except that 199 mobile disks would be involved instead of 200. One possible outcome is that the final configuration would be the same as for 200 mobile disks, but with a single monovacancy (missing disk) located somewhere within the structure, and with a corresponding reduction in density.
Perhaps surprisingly, a modest search of the type just described in fact discovered a period-4 packing applicable to any multiple of 199 disks, in particular to 1990. Its density is clearly higher than those of cases F-J reported in Table 3.1, specifically , and , and it is also higher than that of the configurations of 200 disks with a monovacancy. However, the found 199-particle density is noticeably lower than the corresponding 200-particle highest density mentioned above. Figure 3.9 displays the configuration, periodically replicated 10-fold to produce a 1990-particle example. In contrast to the previous 200-disk periodic structure, the bottom layer of movable particles consists in each period of only four individuals rather than five, each buried in a pocket provided by the fixed larger disks. This accounts for the missing particle, rather than by monovacancy formation. The subsequent layers proceeding vertically contain five disks, but in a wavy pattern to contact the four below. In a fashion similar to that of the 200-particle periodic case, the amplitude of waviness diminishes with altitude, and is virtually gone by the fifth layer. And like the 200-particle periodic case, the suspected optimum packing for 199 particles apparently also possesses mirror symmetry with respect to vertical axes separated from one another by one-half period (i.e. 2 units in the direction).
Based on this last finding, we speculate that the densest packing in the case of 1990 mobile particles is periodic in the horizontal direction with period 4, and indeed is the structure illustrated in Figure 3.9. It should be noted in passing that this structure was obtained only after 15 unsuccessful attempts to create a suitably high density result. Each of the 15 preceding unsuccessful attempts produced a configuration identifiable as a monovacancy-containing modification of a 200-particle structure, as described above. This is consistent with the earlier remark that apparently a substantially greater diversity of jammed structures exist, most of relatively low density, in the 1990-particle system in comparison to the 2000-particle system.
4 Numerical Results, Spheres
The behavior of rigid disks in epitaxial jamming circumstances, described in the preceding Section 3, is already complex and challenging. The analogous situation for spheres can be expected to be even more so. In part this arises from the fact that, even disregarding boundary effects, spheres possess a larger relative number and greater geometric diversity of packing types [11, 18, 19]. But it also stems from the greater number of periodic substrate structures that could be presented to the movable sphere set. The choices described in Section 2 above to limit the sphere simulations to square arrays for bottom and top rigid layers, and to use slow compression, were motivated by the need to keep the analysis as tightly focused as possible.
The final densities for the two sphere cases considered are the following:
| (8) |
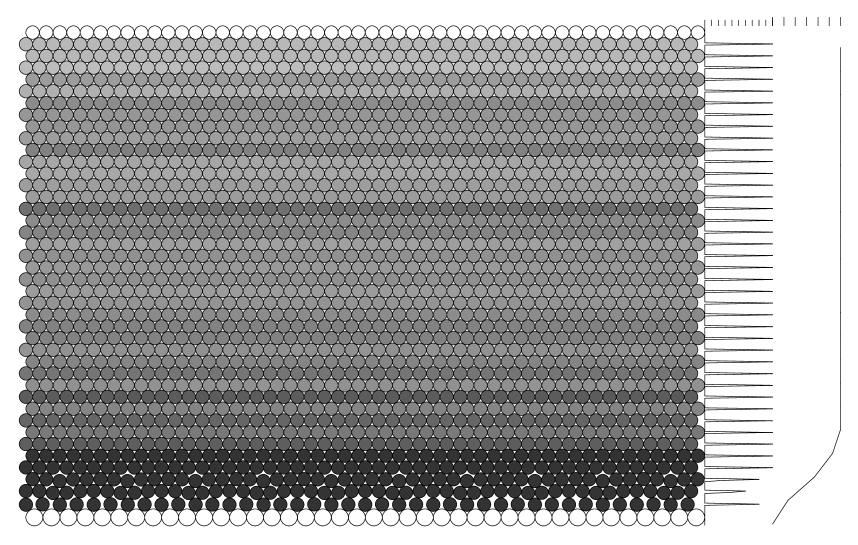
In spite of the use of slow compression, the final jammed configurations for both of these cases exhibit substantial disorder pervading nearly the entire interval between bottom and top rigid layers. Figures 4.1 and 4.2 present typical planar slices for the two cases. These figures include collision-rate shading as in the prior disk cases. They also present -direction density histograms, and binned contact and near-contact numbers for all movable spheres, at the right edges. The two sets of ticks at the top edges of these two graphs allow one to deduce the magnitude of the values in the graphs. The arrangement of the ticks is analogous to that in Figure 3.1 and it was described in Section 3 above. In particular, the spacing between consecutive ticks for the -direction density histogram is 10% of the maximum number of particle centers that may occur at a given under the planar square arrangement, i.e., 10% of . Thus, the second tick corresponds to 10%, i.e., to 90 particles in a bin, the third to 20%, i.e., to 180 particles, and so on.
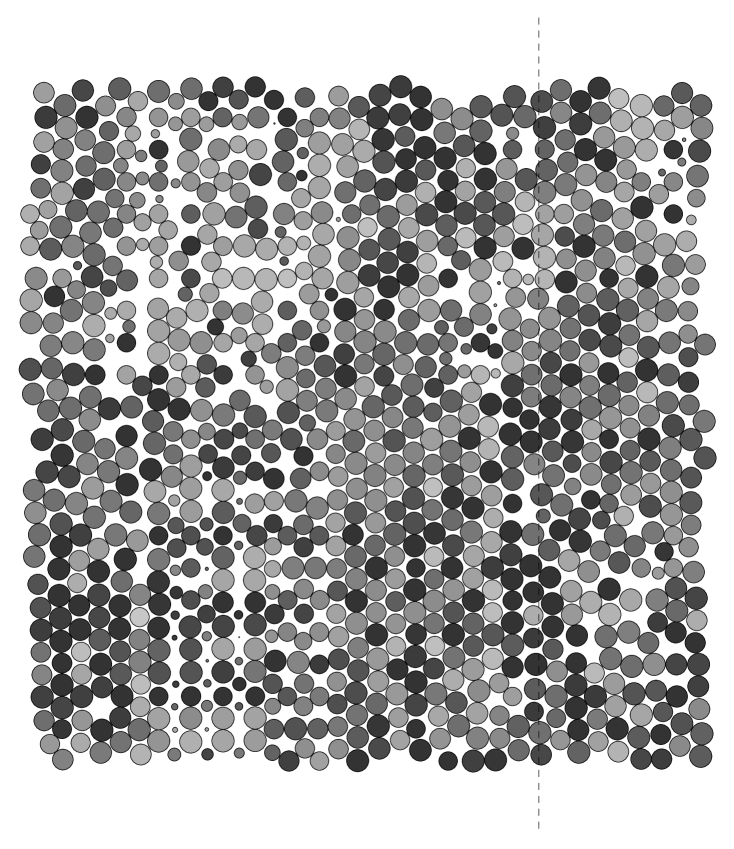
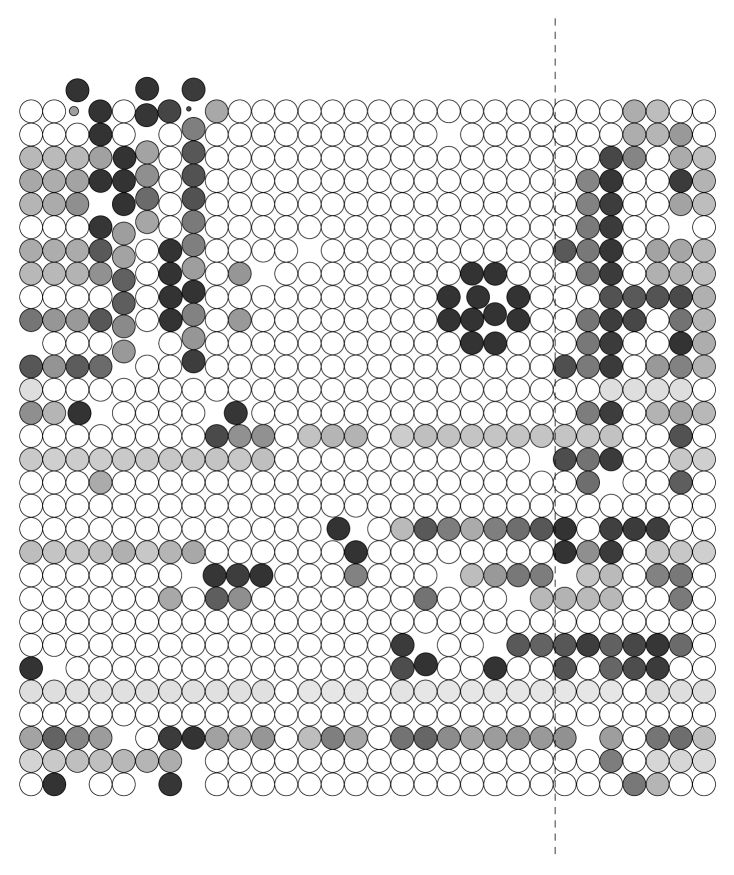
Figures 4.3 and 4.4 illustrate further aspects of the 18000-sphere case by showing a pair of horizontal slices (i.e. at fixed altitudes ). The former involves a slice near the bottom substrate layer of rigidly fixed incommensurate spheres, while the latter shows the result for a slice near the top layer of rigidly fixed small (commensurate) spheres. The positions of these slices are indicated by dashed lines in Figure 4.1. These views confirm an attribute suggested by the prior Figure 4.1. that the extent of configurational disorder diminishes somewhat from bottom to top. This is reasonably clear from Figures 4.3 and 4.4 not only by the relative extents of square packing order, but also by the diagnostic shading of the particle images, which we saw in the disk case correlates with disorder. Although we do not show them, similar fixed- slices for the 17541-movable-sphere case present the same qualitative scenario.
In view of the observations in the preceding Section 3 that disk simulations tend to generate periodic or near-periodic patterns in contact with the incommensurate bottom layer, it is natural to look for a similar behavior with spheres. Given the radius ratio 0.7, and the square (001) geometry of the fixed bottom layer, the sphere analog would be a horizontally doubly-periodic pattern with size units (i.e. diameters of the smaller movable spheres). However, examination of the generated configurations by means of graphical presentations such as those in Figures 4.3 and 4.4 reveals no obvious tendency toward such doubly-periodic patterns. This may be due to the significantly larger number of movable particles that would have to be involved, as well as due to the disruptive influence of spontaneously formed disordered structures within the bulk of the compressed layer. Failure to observe horizontal double periodicity in our limited search for the 18000 and 17541-sphere systems thus should not be interpreted as evidence against the existence of such a possibility, but merely that it is improbable.
Motivated by analogous success in finding high-density periodic patterns for the disk systems, we have performed several additional sphere runs where the system geometry was periodically restricted in each of the and directions by a factor of 3. Thus, for a relevant doubly-periodic subset of the 18000 sphere system we considered configurations of only 2000 mobile spheres, while for the 17541 sphere system we examined configurations of 1949 mobile spheres. In both of these searches was restricted to 7 units, so that the rigid top layer involved small spheres, and the rigid bottom layer consisted of large spheres. As was the case for disks, the highest densities obtained in these restricted circumstances exceeded the corresponding values for the unrestricted systems. This provides at least weak circumstantial evidence that the highest possible densities require double periodicity. However, we hasten to point out that no easily described regular patterns emerged. On the contrary, we observed that the final configurations for these smaller systems contained many structural irregularities, and to that extent were not directly analogous to the disk cases. Finding structurally “perfect” doubly periodic patterns by this approach, if they exist, presumably would require a substantially larger number of search attempts, and would exceed the scope and available resources of the present investigation.
5 Conclusions and Discussion
Computer simulation has been applied to the study of selected aspects of epitaxial frustration phenomena for systems of hard disks and hard spheres forced into jamming contact with rigid ordered layers that are composed of larger disks and spheres, respectively. In order to keep this inquiry within reasonable limits, single rational size ratios were selected (0.8 for disks, 0.7 for spheres). Furthermore, only structurally perfect arrays served as substrates: a linear array for disks, and a (001) layer from a face-centered cubic close packed array for spheres. Jamming was produced by slow vertical compression onto the incommensurate substrate, by means of constant slow-speed approach of the incommensurate lower and commensurate upper boundary layers. Periodic boundary conditions applied in directions parallel to the boundary layers.
Two sizes of disk systems (2000 and 1990 movable particles) were simulated. Both produced final structures that displayed a diversity of patterns differing in the amount and location of packing disorder. Nevertheless, results indicated that the most “efficient” arrangements of disks (i.e. those exhibiting the highest final density) possessed a pattern periodic in the direction parallel to the substrate, with most of the geometric disturbance of the natural triangular lattice packing of disks localized close to the incommensurate substrate.
The sphere systems investigated, containing 18000 and 17541 movable particles, appeared to settle into more disordered jammed arrangements in comparison with the disk systems. In part this could be attributed to the known bulk properties of the disks and spheres, namely that far more geometrically stable amorphous packings exist for the latter than for the former [11, 18, 19]. A search for high-density doubly-periodic sphere packings experienced limited success; while relatively high densities in fact appeared, the packings displayed considerable disorder beyond what would be expected in the immediate vicinity of the incommensurate substrate layer. Consequently, it remains an attractive prospect for a future investigation to attempt to identify ideal doubly-periodic packings with minimum disorder and maximum attainable density. Success in such an attempt may require use of special initial conditions that strongly diminish the occurrence of sphere packing disorder away from the substrate layer.
The substrate geometries employed in the present study constitute a very small subset of all possibilities that might be considered. These possibilities include substrates that are crystalline alloy structures with two or more distinct particle sizes, stepped substrate surfaces, and substrates containing various point and extended defects. Even amorphous substrates presenting a substantially planar surface to the movable particles deserve attention. All of these extensions present varying degrees of reduced order to the movable particles, and it will be illuminating to determine the characteristic types and the extent of extra packing disorder in the deposited layers that they indeividually produce.
With respect to the more modest goal of extending the present work to a wider range of radius ratios, several points deserve at least brief discussion. In principle, the full range of size ratios from very small to very large could be examined for disks, going well beyond the single ratio 0.8 considered in this paper. Of course, imposition of periodic boundary conditions in the direction parallel to the fixed substrate effectively constrains those ratios to be simple rational numbers. Epitaxial frustration will inevitably arise, except when the movable disks have diameters equal to an integer multiple (1, 2, 3, ….) of those comprising the fixed substrate. When these integer multiples are present, larger movable disks can form a perfect contacting row by settling respectively into every first, second, third, …. pocket presented by the substrate, and this can serve as the bottom row of a perfect triangular crystal arrangement for the remainder of the movable disks.
The range of available size ratios for the three-dimensional case of spheres is a bit more restricted. The movable spheres cannot be so small that they could slip between the fixed spheres that form the substrate layer. In the case of a (001) face-centered cubic structure as used in the simulations reported above, this requires that the movable spheres be no smaller than times the substrate sphere size. For a substrate possessing the close-packed (111) surface structure, the corresponding ratio would be substantially smaller but still positive, specifically . As in the disk case, a discrete set of movable-to-substrate size ratios greater than unity can avoid epitaxial frustration by allowing perfect fit of a first added layer into a subset of pockets provided by the substrate, while serving as the beginning of a structurally perfect crystal of those larger spheres.
Finally, it is appropriate to mention that careful theoretical examination of packing geometry for bulk disk and sphere systems has revealed the importance of distinguishing various definitions of “jamming” [16, 17, 19, 20]. Considering the method used in our simulations, the natural presumption would be that the final disk or sphere states obtained are at least close to the “collectively jammed” state, that is (aside from inclusion of occasional “rattlers”), the initially movable particles have reached a state such that no subset of them can be simultaneously shifted while respecting the non-overlap constraints. The more stringent “strictly jammed” category however may not apply; that would require testing for system instability by deforming the rectangular system boundaries to parallelogram or parallelopiped shape by application of shear parallel to the substrate. As is the case for the other directions of extended investigation, this aspect of the general problem will have to be reserved for the future.
References
- [1] J.M. Greenberg, Surf. Sci. 500, 793-822 (2002).
- [2] M. Kulmala, Science 302, 1000-1001 (2003).
- [3] Semiconductor Growth Technology, edited by E. Krikorian, Volume 323, Proceedings of SPIE (Bellingham, WA, 1982).
- [4] F.H. Stillinger and B.D. Lubachevsky, J. Stat. Phys 73, 497-514 (1993).
- [5] J.D. Bernal, in Liquids: Structure, Properties, Solid Imperfections, edited by T.J. Hughel (Elsevier, Amsterdam, 1965), p. 25.
- [6] G.D. Scott and D.M. Kilgour, Brit. J. Appl. Phys. 2, 863 (1969).
- [7] O. Pouliquen, M. Nicholas, and P.D. Weidmann, Phys. Rev. Lett. 79, 3640 (1997).
- [8] W.M. Visscher and M. Bolsterli, Nature (London) 239, 504 (1972).
- [9] W.S. Jodrey and E.M. Tory, Phys. Rev. A 32, 2347 (1985).
- [10] J. Tobochnik and P.M. Chapin, J. Chem. Phys. 88, 5824 (1988).
- [11] B.D. Lubachevsky and F.H. Stillinger, J. Stat.Phys. 60, 561 (1990).
- [12] S. Torquato, T.M. Truskett, and P.G. Debenedetti, Phys. Rev. Letters 84, 2064 (2000).
- [13] J.G. Berryman, Phys. Rev. A 27, 1053 (1983).
- [14] R. Connelly, Struct. Topology 14, 43 (1988).
- [15] R. Connelly, Struct. Topology 16, 57 (1991).
- [16] S. Torquato and F.H. Stillinger, J. Phys. Chem. B 105, 11849 (2001).
- [17] S. Torquato, A. Donev, and F.H. Stillinger, Int. J. Solids and Structures 40, 7143 (2003).
- [18] B.D. Lubachevsky, F.H. Stillinger, and E.N. Pinson, J. Stat. Phys. 64, 501 (1991).
- [19] A. Donev, S. Torquato, F.H. Stillinger, and R. Connelly, J. Appl. Phys. 95, 989 (2004).
- [20] F.H. Stillinger, H. Sakai, and S. Torquato, Phys. Rev. E 67, 031107 (2003).