The Origin of the Fragile-to-Strong Crossover in Liquid Silica as Expressed by its Potential Energy Landscape
Abstract
The origin of the fragile-to-strong crossover in liquid silica is characterized in terms of properties of the potential energy landscape (PEL). Using the standard BKS model of silica we observe a low-energy cutoff of the PEL. It is shown that this feature of the PEL is responsible for the occurrence of the fragile-to-strong crossover and may also explain the avoidance of the Kauzmann paradox. The number of defects, i.e. deviations from the ideal tetrahedral structure, vanishes for configurations with energies close to this cutoff. This suggests a structural reason for this cutoff.
pacs:
64.70.Pf,65.40.Gr,66.20.+dUnderstanding the properties of liquid silica is of utmost importance due to its enormous technological and scientific relevance. In the Angell C. A. Angell (1991) classification scheme it is a very strong glass, i.e. displaying an Arrhenius temperature dependence of its transport observables like viscosity or diffusivity. Furthermore one may expect that as a typical network-forming system it shares properties with other network-formers like water. Indeed, recently it has been pointed out that anomalies like negative thermal expansion, isobaric heat capacity minima and isothermal compressibility minima occur in water as well as in simulated liquid silicaK. Vollmayr, W. Kob, and K. Binder (1996); I. Saika-Voivod, F. Sciortino, and P. H. Poole (2001a); M. S. Shell, P. G. Debenedetti, and A. Z. Panagiotopoulos (2002).
The experimental oxygen diffusion constant behaves like with cm2/s J. C. Mikkelsen (1984). For a microscopic hopping time of s and a typical length scale of a=2 Å one would expect cm2/s. This discrepancy of some orders of magnitude could be rationalized if for temperatures above the region, which is accessible in most experiments, the diffusivity would show deviations from the Arrhenius behavior. Indeed, from experiments K.-U. Hess, D. B. Dingwell, and E. Rössler (1996) as well as from simulations J. Horbach and W. Kob (1999) this so-called ”fragile-to-strong” crossover (FSC) has been found for silica in a temperature range around K. A similar scenario has been discussed for water C. A. Angell (1983) and BeF2 M. Hemmati, C. T. Moynihan, and C. A. Angell (2001). It has been speculated that the occurrence of a FSC is directly related to the presence of polyamorphism F. W. Starr, F. Sciortino, and H. E. Stanley (1999); I. Saika-Voivod, P. H. Poole, and F. Sciortino (2003).
In recent years the analysis of the potential energy landscape (PEL) became an indispensable tool to elucidate the thermodynamics and dynamics of many different supercooled liquids F. H. Stillinger and T. A. Weber (1982); S. Sastry, P. G. Debenedetti, and F. H. Stillinger (1998); F. Sciortino, W. Kob, and P. Tartaglia (1999); S. Büchner and A. Heuer (1999); A. Scala, F. W. Starr, E. La Nave, F. Sciortino, and H. E. Stanley (2000); P. G. Debenedetti and F. H. Stillinger (2001); D. J. Wales and J. P. K. Doye (2001); S. Sastry (2001); E. La Nave, H. E. Stanley, and F. Sciortino (2002); M. S. Shell and P. G. Debenedetti (2003); B. Doliwa and A. Heuer (2003a); I. Saika-Voivod, P. H. Poole, and F. Sciortino (2001, 2003). The dynamics of the total system is represented as the dynamics of a point in the high-dimensional configurational space. In particular, the thermodynamics can be expressed in terms of the distribution of the inherent structures (minima of the PEL) F. Sciortino, W. Kob, and P. Tartaglia (1999); I. Saika-Voivod, F. Sciortino, and P. H. Poole (2001b). It was also possible to express the long-range dynamics, i.e. the diffusivity, in terms of PEL-characteristics E. La Nave, H. E. Stanley, and F. Sciortino (2002); B. Doliwa and A. Heuer (2003b). Thus the phenomenon of the FSC should be reflected by properties of the PEL. Actually, for liquid silica it has been shown that around the temperature dependence of the average inherent structure energy and, correspondingly, the configurational entropy shows an inflection point I. Saika-Voivod, P. H. Poole, and F. Sciortino (2003). This has direct consequences for the Kauzmann paradoxon. Extrapolating the -dependence for to lower temperatures one would obtain for a finite temperature , the Kauzmann temperature. The inflection point around suggests that for all temperatures. Thus it is speculated that ”the FSC and the Kauzmann paradox are fundamentally interrelated phenomena” I. Saika-Voivod, P. H. Poole, and F. Sciortino (2003). In this work we will show that this is indeed the case and suggest the underlying reason for both properties.
For the modelling of silica we use the standard BKS potential B. W. H. van Beest, G. J. Kramer, and R. A. van Santen (1990). As compared to the standard choice we employ a somewhat larger cutoff-radius of 8.5 Å for the short-range interaction to avoid energy drifts. Simulations are performed in the NVE ensemble with periodic boundary conditions, using a density of g/cm3. The lowest simulated temperature was 2800 K. In recent years the concept of metabasins (MB) has been introduced as an appropriate way of coarse-graining the configuration space F. H. Stillinger (1995); S. Buechner and A. Heuer (2000); T. F. Middleton and D. J. Wales (2001). On a qualitative level, adjacent inherent structures between which the system performs back- and forth jumps are merged together to one MB (see B. Doliwa and A. Heuer (2003a) for a precise definition). The energy of a MB is defined as the energy of the inherent structure with the lowest energy. Whereas for the thermodynamics the distinction between inherent structures and MBs is not relevant, the relation to the dynamics is much simpler in terms of MBs. For a binary Lennard-Jones system it could be shown that the average residence time in a MB but not that in an inherent structure is directly proportional to the inverse diffusion constant B. Doliwa and A. Heuer (2003b).
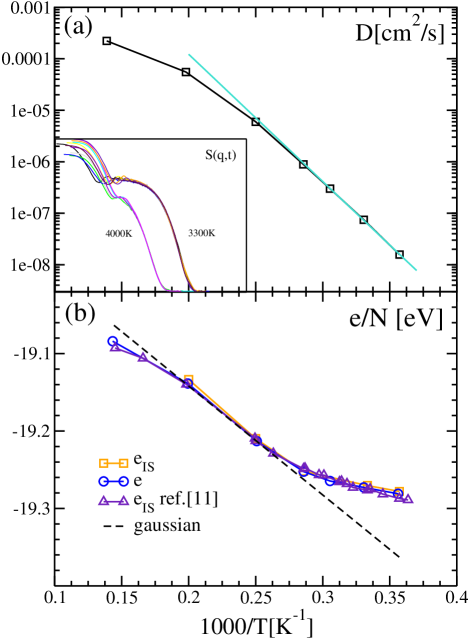
To characterize the PEL it is crucial to analyse rather small systems with periodic boundary conditions B. Doliwa and A. Heuer (2003a); D. J. Wales and J. P. K. Doye (2003). Otherwise, interesting aspects may be simply averaged out, as shown below. For this purpose one may look for the minimum system size without any significant finite size effects. For a binary Lennard-Jones system it could be shown that starting from circa 65 particles no finite-size effects are present for the range of temperatures accessible to computer simulations B. Doliwa and A. Heuer (2003c). For BKS silica it is known that the diffusion constant becomes constant only for system sizes of more than 1000 particles J. Horbach, W. Kob, K. Binder, and C. A. Angell (1996). We have calculated the incoherent scattering function for system sizes ranging from 60 to 1000 at . It turns out that they all have identical non-exponential relaxation behavior in the -regime except for simple scaling (e.g. ); see inset of Fig.1. This is a first hint that the transport behavior is identical for all system sizes in this range. In what follows we report simulations for (denoted as BKS99).
The temperature dependence of the oxygen diffusion constant of BKS99 is shown in Fig.1a. It displays the same FSC as the macroscopic system with Arrhenius behavior below 3500 K and a very similar low-temperature activation energy (4.9 eV). In Fig.1b we show the average energy of MBs and inherent structures . Furthermore we include the inherent structures energies from Ref. I. Saika-Voivod, P. H. Poole, and F. Sciortino (2003) where a much larger BKS silica system () with slightly different cutoff conditions and nearly the same density ( gcm-3) has been simulated. The temperature dependence is nearly identical for all three curves and has a change in slope around . We note in passing that the temperature dependence of the dynamic heterogeneities in real space does not show any anomalies around M. Vogel and S. C. Glotzer (2004).
So far we have reproduced the temperature dependence of the dynamics (FSC) and thermodynamics (inflection in , related to the Kauzmann paradox) for BKS99. Going beyond previous work the main goal of this work is to analyse the relevant observables in terms of energy. From this we will uniquely identify a common origin of the FSC and the inflection in : just around the system approaches the low-energy end of the PEL.
One of the most fundamental energy-dependent quantities is the density of MBs . In a first step we record the distribution of MBs at different temperatures. In case that anharmonicities are small or do not strongly depend on temperature one has with or, equivalently, F. Sciortino, W. Kob, and P. Tartaglia (1999); S. Büchner and A. Heuer (1999). Thus via reweighting it is possible to extract from apart from a proportionality constant. Actually, for K this reweighting breaks down because of anharmonicities. We have estimated the proportionality constant from the condition that for K the configurational entropy is identical to the value of 6.8 J/(mol K), reported in I. Saika-Voivod, P. H. Poole, and F. Sciortino (2003). The resulting energy-distribution is shown in Fig.2. It is possible to fit with a gaussian with eV2, and eV. In analogy to the binary Lennard-Jones system the distribution is gaussian within statistical errors.
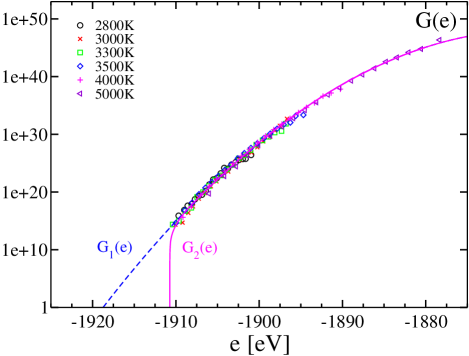
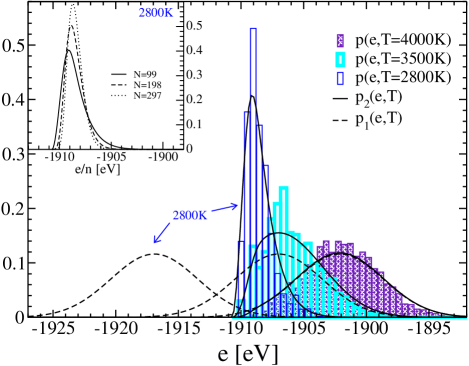
Naturally, during our simulations we find a lowest MB energy, which we denote as ( eV). In principle there are two possible scenarios for this cutoff: (1) The density of states is also Gaussian for . These states, however, are not found due to finite simulation times. The resulting distribution is denoted . (2) The number of states below is much smaller than predicted by the Gaussian extrapolation such that can be basically regarded as a low-energy cutoff of the energy landscape (denoted . To falsify scenario (1) we assume the validity of . In a first step one can compare the average energy with the gaussian prediction F. Sciortino, W. Kob, and P. Tartaglia (1999); S. Büchner and A. Heuer (1999). It is included in Fig.1b. One can clearly see the deviations for K, indicating that the description by a gaussian breaks down at low energies. Actually, the deviations at high temperatures are due to anharmonicities. An even closer analysis can be performed by comparing the whole distribution , obtained from our simulations, with . This comparison is shown in Fig.3. The dramatic difference between =2800 K and =2800 K again shows that the gaussian extrapolation is not valid. Actually, this difference can be also expressed by stating that more than 100 MBs with energies below should have been found during our simulation time of 120 ns at K in case of scenario (1). This quantification, however, is rather involved. Since the discrepancy is already obvious from Fig.3 we defer it to a later publication. In any event, we have to conclude that the appearance of a cutoff is not an artifact but reflects a major depletion of states below as compared to the gaussian distribution. Actually, using the classification scheme recently introduced by Ruocco et al. this result clearly shows that BKS silica is a ”B strong liquid” G. Ruocco, F. Sciortino, F. Zamponi, C. De Micheleand T. Scopigno (2004).
Before validating scenario (2) we slightly smear out the cutoff by introducing the distribution , defined for (see Fig.2). As shown in Fig.3 the estimation reproduces for all temperatures.
This analysis may help to clarify why it is so important to use rather small systems. Based on the assumption that a system of () particles is composed of independent but identical subsets of 99 particles it possible to estimate K); see inset of Fig.3. Whereas for 99 particles the cutoff can be directly seen from the strongly asymmetric shape of , this effect is smeared out for 198 or 297 particles and in the limit of large , would finally approach a delta-function. Thus the presence of the cutoff in any subsystem is no longer visible for larger systems. This line of thought explicitly rationalizes the use of small systems.
Whereas for high temperatures the thermodynamics and the dynamics is not influenced by the cutoff at , a significant impact is expected at low temperatures. As seen from Fig.3 for temperatures below 4000 K the cutoff-population starts to become relevant, resulting in an increasing difference between and . This is exactly the temperature range of the FSC. We suggest that this agreement is not coincidental. As shown for the more fragile binary Lennard-Jones system the increase of the apparent activation energy with decreasing temperature can be related to the fact that the system explores lower regions of the PEL at low temperatures for which the local effective saddles to escape the MB are correspondingly higher B. Doliwa and A. Heuer (2003a). Not surprisingly, the same phenomenon is seen for BKS99 (data not shown). Thus the growing influence of the bottom of the PEL with decreasing temperature stops the increase of the apparent activation energy.
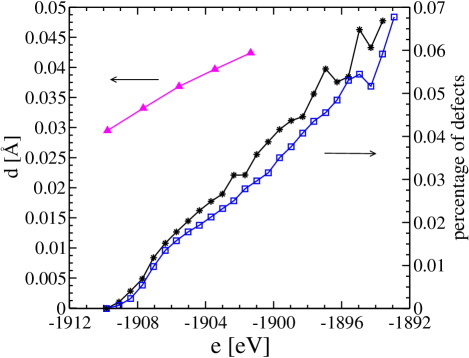
What is the microscopic origin of the low-energy cutoff? One may expect that the energy of a structure is correlated with the number of defects, i.e. silicon atoms with three or five oxygens in the nearest neighbor shell or oxygens with one or three silicon atoms. This is suggested by the significant decrease of the number of defects with decreasing temperature, observed in previous simulations J. Horbach and W. Kob (1999); I. Saika-Voivod, P. H. Poole, and F. Sciortino (2004). In a first step, we compare the occurrence of defects with the results for BKS8000 J. Horbach and W. Kob (1999). It turns out that the number of different defects of the equilibrium configurations at K on average agree within a factor of 1.15 with the numbers, reported in J. Horbach and W. Kob (1999). Thus the properties of defects do not show major finite size effects. In a second step we determine the fraction of these defects (nearest neighbor-shell: Å) for the minimized structures in dependence of energy; see Fig.4. One can clearly see that the fraction of defects varies roughly linearly with energy and approaches zero for configurations around . These configurations, however, are still amorphous. This is checked by calculating the width of the first nearest-neighbor peak of the Si-O partial structure factor for the minimized structures. It is a measure for the degree of disorder in the nearest-neighbor shell. This value only weakly depends on energy; see Fig.4. We may conclude that the reduction of the number of defects is an efficient way to obtain configurations with lower energy. After reaching configurations with no defects at all there emerges a lower energy limit which cannot be crossed without crystallisation. This suggests a structural reason for this cutoff. In particular this excludes the scenario that the cutoff is a trivial consequence of the fact that for a finite number of MBs (or inherent structures) at some temperature the lowest energy configuration becomes thermodynamically relevant. As seen in Fig.2 we indeed estimate an exponentially large number of different states around .
This scenario is very different as compared to the fragile binary Lennard-Jones system where for all simulated temperatures B. Doliwa and A. Heuer (2003b), excluding a PEL cutoff in the accessible energy range. Without network constraints the system can optimize the disordered structure more efficiently to find configurations with even lower energies (see also I. Saika-Voivod, P. H. Poole, and F. Sciortino (2004)).
Is it possible that the FSC for macroscopic BKS is of different nature than for BKS99? One might think that for larger systems it is possible to form more low-energy states due to the smaller number of constraints related to the periodic boundary conditions. Then might extend the gaussian-like behaviour also to lower energies and the temperature dependence of should approach the gaussian limit. Comparison of BKS99 with BKS1332 shows that this effect, if at all, is very small (Fig.1). Therefore macroscopic BKS not only displays the same phenomenology as BKS99 but very likely also follows similar underlying mechanisms.
In summary, for the prototype network former silica we have related the fragile-to-strong crossover as well as the inflection of to the presence of a lower cutoff in the PEL. Since this cutoff is related to structural constraints for disordered structures of a network former, it may be of general nature.
We would like to acknowledge discussions with B. Doliwa and M. Vogel. We thank F. Sciortino and I. Saika-Voivod for sending us the data of Ref.I. Saika-Voivod, P. H. Poole, and F. Sciortino (2003).
References
- C. A. Angell (1991) C. A. Angell, J. Non-Cryst. Solids. 131-133, 13 (1991).
- K. Vollmayr, W. Kob, and K. Binder (1996) K. Vollmayr, W. Kob, and K. Binder, Phys. Rev. B 54, 15808 (1996).
- I. Saika-Voivod, F. Sciortino, and P. H. Poole (2001a) I. Saika-Voivod, F. Sciortino, and P. H. Poole, Phys. Rev. E 63, 011202 (2001a).
- M. S. Shell, P. G. Debenedetti, and A. Z. Panagiotopoulos (2002) M. S. Shell, P. G. Debenedetti, and A. Z. Panagiotopoulos, Phys. Rev. E 66, 011202 (2002).
- J. C. Mikkelsen (1984) J. C. Mikkelsen, Appl. Phys. Lett. 45, 1187 (1984).
- K.-U. Hess, D. B. Dingwell, and E. Rössler (1996) K.-U. Hess, D. B. Dingwell, and E. Rössler, Chem. Geol. 128, 155 (1996).
- J. Horbach and W. Kob (1999) J. Horbach and W. Kob, Phys. Rev. B. 60, 3169 (1999).
- C. A. Angell (1983) C. A. Angell , Annu. Rev. Phys. Chem. 34, 7079 (1983).
- M. Hemmati, C. T. Moynihan, and C. A. Angell (2001) M. Hemmati, C. T. Moynihan, and C. A. Angell, J. Chem. Phys. 115, 6663 (2001).
- F. W. Starr, F. Sciortino, and H. E. Stanley (1999) F. W. Starr, F. Sciortino, and H. E. Stanley, Phys. Rev. E. 60, 6757 (1999).
- I. Saika-Voivod, P. H. Poole, and F. Sciortino (2003) I. Saika-Voivod, P. H. Poole, and F. Sciortino, arXiv:cond-mat/0309481 (2003).
- F. H. Stillinger and T. A. Weber (1982) F. H. Stillinger and T. A. Weber, Phys. Rev. A 25, 978 (1982).
- S. Sastry, P. G. Debenedetti, and F. H. Stillinger (1998) S. Sastry, P. G. Debenedetti, and F. H. Stillinger, Nature 393, 554 (1998).
- F. Sciortino, W. Kob, and P. Tartaglia (1999) F. Sciortino, W. Kob, and P. Tartaglia, Phys. Rev. Lett. 83, 3214 (1999).
- S. Büchner and A. Heuer (1999) S. Büchner and A. Heuer, Phys. Rev. E 60, 6507 (1999).
- A. Scala, F. W. Starr, E. La Nave, F. Sciortino, and H. E. Stanley (2000) A. Scala, F. W. Starr, E. La Nave, F. Sciortino, and H. E. Stanley, Nature 406, 166 (2000).
- P. G. Debenedetti and F. H. Stillinger (2001) P. G. Debenedetti and F. H. Stillinger, Nature 410, 259 (2001).
- D. J. Wales and J. P. K. Doye (2001) D. J. Wales and J. P. K. Doye, Phys. Rev. B. 63, 214204 (2001).
- S. Sastry (2001) S. Sastry, Nature 409, 164 (2001).
- E. La Nave, H. E. Stanley, and F. Sciortino (2002) E. La Nave, H. E. Stanley, and F. Sciortino, Phys. Rev. Lett. 88, 035501 (2002).
- M. S. Shell and P. G. Debenedetti (2003) M. S. Shell and P. G. Debenedetti, J. Chem. Phys. 118 (2003).
- B. Doliwa and A. Heuer (2003a) B. Doliwa and A. Heuer, Phys. Rev. E. 67, 030501 (2003a).
- I. Saika-Voivod, P. H. Poole, and F. Sciortino (2001) I. Saika-Voivod, P. H. Poole, and F. Sciortino, Nature 412, 514 (2001).
- I. Saika-Voivod, F. Sciortino, and P. H. Poole (2001b) I. Saika-Voivod, F. Sciortino, and P. H. Poole, Phys. Rev. E 63, 011202 (2001b).
- B. Doliwa and A. Heuer (2003b) B. Doliwa and A. Heuer, Phys. Rev. E. 67, 031506 (2003b).
- B. W. H. van Beest, G. J. Kramer, and R. A. van Santen (1990) B. W. H. van Beest, G. J. Kramer, and R. A. van Santen, Phys. Rev. Lett. 64, 1955 (1990).
- F. H. Stillinger (1995) F. H. Stillinger, Science 267, 1935 (1995).
- S. Buechner and A. Heuer (2000) S. Buechner and A. Heuer, Phys. Rev. Lett. 84, 2168 (2000).
- T. F. Middleton and D. J. Wales (2001) T. F. Middleton and D. J. Wales, Phys. Rev. B 64, 024205 (2001).
- D. J. Wales and J. P. K. Doye (2003) D. J. Wales and J. P. K. Doye, J. Chem. Phys. 119, 12409 (2003).
- B. Doliwa and A. Heuer (2003c) B. Doliwa and A. Heuer, J. Phys. C: Cond. Mat. 15, S849 (2003c).
- J. Horbach, W. Kob, K. Binder, and C. A. Angell (1996) J. Horbach, W. Kob, K. Binder, and C. A. Angell, Phys. Rev. E. 54, R5897 (1996).
- M. Vogel and S. C. Glotzer (2004) M. Vogel and S. C. Glotzer, arXiv:cond-mat/0402427 (2004).
- G. Ruocco, F. Sciortino, F. Zamponi, C. De Micheleand T. Scopigno (2004) G. Ruocco, F. Sciortino, F. Zamponi, C. De Micheleand T. Scopigno, arXiv:cond-mat/0401449 (2004).
- I. Saika-Voivod, P. H. Poole, and F. Sciortino (2004) I. Saika-Voivod, P. H. Poole, and F. Sciortino, Phil. Mag. 48, 1437 (2004).