Probing ion transport at the nanoscale: Time-domain electrostatic force spectroscopy on glassy electrolytes
Abstract
We have carried out time–domain electrostatic force spectroscopy on two different ion conducting glasses using an atomic force microscope. We compare the electrostatic force spectroscopic data obtained at different temperatures with macroscopic electrical data of the glasses. The overall consistency of the data shows that electrostatic force spectroscopy is capable of probing the ion dynamics and transport in nanoscopic subvolumes of the samples.
pacs:
66.10.Ed, 66.30.Hs, 61.43.Fs, 61.16.ChIon conducting crystals, glasses and polymers are widely used as solid electrolytes in batteries, fuel cells, and chemical sensors. A lot of research work is being carried out in order to find new materials with improved ionic conductivities. One method that is becoming more and more technologically relevant is nanostructuring of materials. It has, for instance, been found that the ionic conductivity of nanocrystalline ionic conductors can be increased by adding nanocrystalline insulators Indris00 . In the case of glasses, a conductivity enhancement can be achieved by the formation of nanocrystallites during partial crystallisation Adams96 . Furthermore, the ionic conductivity of polymer electrolytes can be improved considerably by incorporating nanoparticles, such as Al2O3, TiO2 and ZrO2, into the polymer matrix Scrosati00 .
Up to now, there is no general agreement about the origin of these conductivity enhancement effects. A limiting factor hindering a better theoretical understanding and thus a more systematic preparation of improved materials is the traditional characterization of the ion dynamics by means of macroscopic techniques, such as conductivity spectroscopy, tracer diffusion measurements, and NMR relaxation techniques. In nanostructured solid electrolytes, diffusion pathways in different phases and at interfaces are believed to play an important role for the ion transport Indris00 ; Maier84 . Therefore, an experimental method capable of probing ion transport on nanometer length scales would be highly desirable.
In principle, electrostatic force microscopy and spectroscopy techniques using an atomic force microscope (AFM) are well suited for this purpose. Such techniques have been applied in different research fields to characterize the electrical properties of materials on nanoscopic length scales. Scanning capacitance microscopy Zavyalov99 ; Brezna02 ; Giannazzo02 and scanning kelvin probe microscopy Baikie98 ; Jacobs98 have been applied to semiconductors and semiconductor devices. The electrical properties of nanostructured materials adsorbed on insulating substrates, e.g. carbon nanotubes and DNA molecules adsorbed on silica, have been studied by using electrostatic force microscopy techniques Gil02 ; Moreno03 . Israeloff and coworkers used time–domain electrostatic force spectroscopy in order to characterize dielectric fluctuations in thin polymer films at the glass transition Walther98 ; Russell98 ; Russell00 .
In this letter, we report, for the first time, on the application of electrostatic force spectroscopy for studying ion transport in solid electrolytes. To do this, we chose two ion conducting glasses with well–known macroscopic electrical properties. The chemical compositions of these glasses are 0.25 Na2O 0.75 GeO2 (NG glass) and 0.143 K2O 0.286 CaO 0.571 SiO2 (KCS glass). The activation energies of the dc electrical conductivity, , reflecting the thermally activated long-range alkali ion transport, are 0.74 eV in the case of the NG glass and 1.05 eV in the case of the KCS glass, respectively. This implies that for a given temperature, the Na+ ions in the NG glass are much more mobile than the K+ ions in the KCS glass. Since the structure of both glasses is homogeneous on length scales of 10-30 nm, the differences in the mobility of the alkali ions should also manifest in the nanoscopic electrical properties as probed by electrostatic force spectroscopy.
For the preparation of the KCS and NG glasses special attention was paid to the surface quality. Samples of typically 4x8 mm2 lateral dimensions and 2 mm thickness were cut from the respective bulk glasses. One surface of each sample was first mechanically grinded with sandpaper of 15 micron grain size. Subsequently, a four-step polishing procedure was carried out with diamond suspensions of various grades. The first and second steps were performed on a silk pad with aqueous diamond suspensions of 9 and 6 micron grain size, respectively. Then a polishing with 1 micron grade and finally with a water-free 1/4 micron suspension was conducted on a felt pad. In this way we achieved a scratch- and pit-free surface with an overall roughness of less than 4 nm.
For the electrostatic force spectroscopy we use a commercial, variable temperature AFM operating under ultrahigh vacuum (UHV) conditions (Omicron VT-AFM). The force sensor is a single crystalline, highly doped silicon cantilever with a resonant frequency = 300 kHz and a spring constant = 20 N/m. The apex radius of the sharp conducting tip is 10 nm (non-contact cantilever NCHR from Nanosensors). A schematic diagram of the setup is shown in Fig. 1.
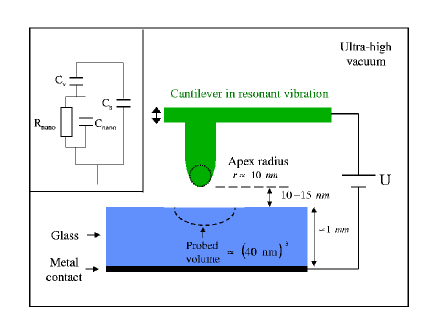
While the tip can be biased with a voltage up to 10 V, the glass samples are attached to a grounded metal contact. The system is operated in the frequency modulation mode (FM mode) Albrecht91 , where the cantilever is oscillated at its resonant frequency. Conservative tip-sample forces will induce a shift in the resonant frequency of the cantilever, which is used as the feedback parameter for the tip-sample distance control. In the case of small cantilever oscillations and long ranged electrostatic interactions, the frequency shift induced by the bias voltage is given by Walther98 :
| (1) |
where denotes the overall capacitance between biased tip and ground. can be modeled by the equivalent circuit illustrated in Fig. 1. The probed nanoscopic subvolume of the sample is represented by a resistor in parallel to a capacitor . The gap between tip and the probed sample volume is modeled by a vacuum capacitor in series to the element. Additionally we introduce a capacitor in parallel to the other elements, which represents all stray capacitances between tip and ground. When the voltage is applied, all capacitors are instantaneously charged. Subsequently, the capacitor is discharged through the resistor . This leads to an increase of the overall capacitance and thus to a decrease of the resonant frequency . The time dependence of is given by:
| (2) |
with . From a microscopic point of view, the discharge of the sample capacitor is due to mobile ions moving in the direction of the electric field, until the field in the probed volume becomes zero. Thus, the time dependent change of the cantilever resonance frequency reflects the time dependent motion of the mobile ions.
An important feature of this measurement technique is the sample volume which is probed with the nanoscopic tip. Detailed finite element simulations using the FEMLAB software yield an approximate probed sample volume of (40 nm)3. Taking into account the number densities of the alkali ions in our glass samples of (Na+) = 1.21 cm-3 (NG glass) and K+) = 7.2 cm-3 (KCS glass) we expect to measure the dynamic behaviour of an ensemble of less than 106 ions, many orders of magnitude below the macroscopic level.
For the time–domain spectroscopic measurements, we apply the following procedure: The tip is approached towards the sample at zero tip voltage. In this case, mainly attractive van der Waals forces are acting between tip and sample surface leading to a negative frequency shift of the cantilever resonance. With an oscillation amplitude of 4 nm, a tip radius of 10 nm and a frequency shift of -20 Hz, the tip-sample distance is typically in the range of 5 to 10 nm. In the FM mode the surface is scanned to ensure that the following spectroscopic measurements are performed on a flat and uniform part of the surface. The tip is then positioned, and the distance-feedback mechanism is disabled. The tip is retracted by 10 nm and then instantaneously biased with = -4 V. The dynamic processes in the probed volume are monitored by measuring the frequency shift as a function of time until the saturation value is reached. Our system is capable to reliably measure saturation times from 0.001 s up to 10 s, covering 4 orders of magnitude. The main complication during these measurements is temperature–induced drift of the tip-sample distance, especially at elevated temperatures. We developed a technique where the temperature drift rate is measured by the AFM, before the voltage is applied. Based on the assumption that the drift rate is constant over a period of a few minutes, we compensate for the drift during electrostatic force measurements.
In the case of the KCS glass, the time dependence of was measured at different temperatures in a range from 376 K to 570 K. Fig. 2 shows selected relaxation curves.

These curves were normalized to their respective saturation frequency shift values (which were in the range -200 Hz 20 Hz) for a better comparison of the relevant time scales. The relaxation curves were fitted with a stretched exponential function of the form Walther98 :
| (3) |
Here, denotes the frequency shift due to fast relaxation processes (vibrational and electronic polarization). The same type of measurement was also performed on the NG glass sample in a temperature range from 253 K to 296 K. The stretch factors are = 0.65 0.05 for the KCS glass and = 0.55 0.05 for the NG glass, respectively. In Fig. 3 we plot the logarithm of the relaxation time versus the inverse temperature.
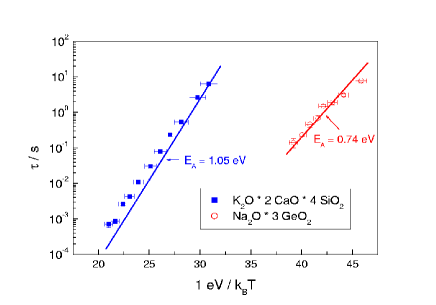
The data of both samples follow, to a good approximation, an Arrhenius law. This is expected since the resistance is determined by the thermally activated ion tranport in the probed subvolume.
The solid lines in Fig. 3 represent the macroscopic relaxation times , which we calculated from the macroscopic resistances and capacitances of the samples. Clearly, there is good agreement between the relaxation times und and their respective temperature dependences. This shows that the same dynamic processes are probed by electrostatic force spectroscopy and by macroscopic electrical spectroscopy, namely the dynamics and transport of the mobile ions. However, a quantitative comparison between and is difficult for two reasons. First, the values of are influenced by the vacuum capacitor . Second, the description of the electrical properties of the nanoscopic sample volume by a parallel RC element is an approximation. The more complex electrical properties of both glass samples lead to a stretched exponential relaxation of the experimental data as compared to the simple exponential time dependence of in Eq. (2).
In conclusion, we have shown that electrostatic force spectroscopy can be used to probe the ion dynamics and transport in nanoscopic subvolumes of solid electrolytes. We note that the high sensitivity of this method opens up the possibility to study discrete dynamic events, i.e. hopping motions of single ions between neighboring potential minima. Furthermore, we emphasize that electrostatic force spectroscopy should be a very powerful method for studying the dynamics in nanostructured solid electrolytes and other nanostructured materials.
References
- (1) S. Indris, P. Heitjans, H. E. Roman, A. Bunde, Phys. Rev. Lett. 84 (2000) 2889–2892.
- (2) St. Adams, K. Hariharan, J. Maier, Solid State Ionics 86-88 (1996) 503–509.
- (3) B. Scrosati, F. Croce, L. Persi, J. Electrochem. Soc. 147 (2000) 1718–1721.
- (4) J. Maier, Ber. Bunsenges. Phys. Chem. 88 (1984) 1057–1062.
- (5) V. V. Zavyalov, J. S. McMurray, C. C. Williams, Rev. Sci. Instrum. 70 (1999) 158–164.
- (6) W. Brezna, S. Harasek, E. Bartagnolli, E. Gornik, J. Smoliner, H. Enichlmair, J. Appl. Phys. 92 (2002) 2144–2148.
- (7) F. Giannazzo, S. Mirabella, D. De Savador, E. Naplitani, V. Raineri, A. Carnera, A. V. Drigo, A. Terasi, F. Priolo, Phys. Rev. B 66 (2002) 161310.
- (8) I. D. Baikie, P. J. Estrup, Rev. Sci. Instrum. 69 (1998) 3902–3907.
- (9) H. O. Jacobs, P. Leuchtmann, O. J. Homan, A. Stemmer, J. Appl. Phys. 84 (1998) 1168–1173.
- (10) A. Gil, P. J. Pablo, J. Colchero, J. Gomez-Herrero, A. M. Baro, Nanotechnology 13 (2002) 309–313.
- (11) F. Moreno-Herrero, P. Herrero, F. Moreno, J. Colchero, C. Gomez-Navarro, J. Gomez-Herrero, A. M. Baro, Nanotechnology 14 (2003) 128–133.
- (12) L. E. Walther, N. E. Israeloff, E. Vidal Russel, H. Alvarez Gomariz, Phys. Rev. B 57 (1998) R15112–R15115.
- (13) E. Vidal Russell, N. E. Israeloff, L. E. Walther, H. Alvarez Gomariz, Phys. Rev. Lett. 81 (1998) 1461–1464.
- (14) E. Vidal Russell, N. E. Israeloff, Nature 408 (2000) 695–698.
- (15) T. R. Albrecht, P. Grütter, D. Horne, D. Rugar, J. Appl. Phys. 69 (1991) 668–673.
- (16) S. Gomez-Monivas, L. S. Froufe-Perez, A. J. Caamano, J. J. Saenz, Appl. Phys. Lett. 79 (2001) 4048–4050.