Self-affine surface morphology of plastically deformed metals
Abstract
We analyze the surface morphology of metals after plastic deformation over a range of scales from 10 nm to 2 mm, using a combination of atomic force microscopy and scanning white-light interferometry. We demonstrate that an initially smooth surface during deformation develops self-affine roughness over almost four orders of magnitude in scale. The Hurst exponent of one-dimensional surface profiles is initially found to decrease with increasing strain and then stabilizes at . By analyzing their statistical properties we show that the one-dimensional surface profiles can be mathematically modelled as graphs of a fractional Brownian motion. Our findings can be understood in terms of a fractal distribution of plastic strain within the deformed samples.
pacs:
62.20.Fe,68.35.-p,89.75.-kAccording to the traditional paradigm implicit in continuum models of plasticity, plastic deformation under homogeneous loads and in the absence of so-called plastic instabilities is expected to proceed in a smooth and spatially homogeneous manner. Fluctuations, if any, are supposed to average out above the scale of a “representative volume element” which is tacitly assumed to be small in comparison with macroscopic dimensions (or, indeed, in comparison with the scale of any problem to which continuum modelling is applied). Recently for crystalline systems deforming by dislocation glide this paradigm has been challenged both from the theoretical and experimental side MIG01A ; MIG01B ; WEI01 ; ZAI01 ; MIG02 ; WEI03 . Weiss et. al. demonstrated that dislocation glide in single-glide oriented ice single crystals proceeds in a temporally intermittent manner, i.e., plastic flow is characterized by a sequence of large “deformation bursts” MIG01A ; WEI01 . Acoustic emission due to these bursts was monitored and it was demonstrated that there is no characteristic burst magnitude. Instead the energy releases were found to obey a scale-free power-law distribution over more than six orders of magnitude in energy MIG01A . Simulations of dislocation dynamics in single-glide single crystals showed qualitatively similar behavior MIG01A ; MIG01B . These findings were interpreted as dynamical critical phenomena in a slowly driven non-equilibrium system ZAI01 ; MIG02 , and it has been argued that the dislocation system in a plastically deforming crystal is always close to a critical point (“yielding transition”, ZAI01 ).
Temporal intermittency of plastic flow goes along with spatial heterogeneity. This has been long known to metallurgists who observed pronounced surface traces (“slip lines”) resulting from the collective motion of many dislocations. By monitoring the evolution of surface features it is therefore possible to study collective behavior in plastic flow. However, most investigations (for an overview, see NEU83 ) have focused on the evolution of single slip lines or slip line bundles, i.e., the motion of isolated dislocation groups. Long-range correlations within the slip pattern have only occasionally been studied. Konstantinidis and Aifantis KON02 used a wavelet transform to investigate the slip pattern of a Fe3Al single crystal on multiple scales between 0.1 and 50 micrometers but did not quantitatively analyze their data in view of scale-invariant behavior. Kleiser and Bocek KLE86 report a self-similar pattern of slip lines in Cu single crystals on scales between 0.06 and 2 micrometers and determine a fractal dimension for the set of intersection points between the slip lines and a line normal to the slip direction.
Recently, Weiss and Marsan WEI03 investigated the three-dimensional patterning of slip on macroscopic scales. By recording acoustic emission with multiple transducers and using spatial triangulation, they determined the 3D distribution of slip bursts in the volume of an ice single crystal. This investigation demonstrated that the slip burst pattern on macroscopic scales (0.6 mm to 10 mm) exhibits features of a fractal set with correlation dimension . However, due to the limited spatial resolution of the technique no information about the slip distribution on smaller scales could be obtained.
In the present study we pursue a slightly different approach for assessing spatial correlations in plastic deformation from the nanoscopic to the macroscopic scale. Instead of directly studying the distribution of plastic strain in the bulk or on the surface of the sample, we monitor the evolution of the surface profile. Provided that the initial surface is sufficiently smooth, the evolution of a one-dimensional profile can be directly related to the plastic distortion at the surface: If we define a local coordinate system such that the direction corresponds to the direction of the profile and the direction to the surface normal, then the derivative of the profile equals the component of the plastic distortion tensor. Long-range correlations in the plastic strain pattern can be detected since they give rise to characteristic modifications of the surface morphology - more specifically speaking, power-law correlations in the spatial distribution of plastic strain lead to the emergence of self-affine surface profiles with a Hurst exponent as will be discussed below.
A self-affine profile is characterized by the property that the statistical properties of the profile remain unchanged under the scaling transformation . The roughness exponent or Hurst exponent can be related to a fractal dimension (“box dimension”) of the profile through MAN85 . Self-affine behavior is abundant in natural surfaces, a most prominent example in materials physics are fracture surfaces whose large-scale roughness can be characterized by a universal (material-independent) exponent BOU97 . In the present letter we report for the first time an analysis of the surface structure of plastically deformed metal samples in terms of self-affine properties. We applied a combination of atomic force microscopy (AFM) and scanning white-light interferometry (SWLI) to quantitatively characterize the surface morphology over a range of scales between 10 nm and 2 mm. Polycrystalline copper samples of 99.9 % nominal purity and an average grain size of 40 m were electropolished to a typical rms roughness of 44 nm as determined by SWLI over a surface area of m m. Two complementary methods were used for surface imaging: (i) AFM scans (512 512 pixels) were taken over areas of m m and m m using a PicoSPM (Molecular Imaging) at the constant deflection mode with a medium range scanner and a cantilever (Mikromasch, Ultrasharp) with a nominal spring constant of 1.75 N/m and tip curvature radius 10 nm; the rms vertical noise amplitude was less than 0.05 nm; (ii) SWLI (New View 100, Zygo) scans were performed over areas of m m with a lateral resolution of 0.6 m and a vertical resolution of 0.5 nm. From the scans, typically 4-5 surface profiles were taken in the direction of the specimen axis and 2-3 profiles normal to that direction.
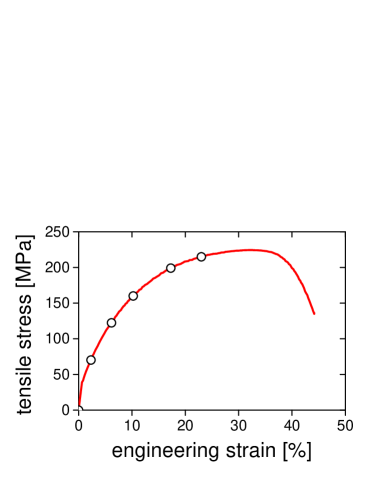
After characterizing the initial surface, the samples were deformed in tension on a standard tensile-testing machine (Instron series 3360). Testing was done at room temperature with an imposed strain rate s-1. At total (engineering) strains and (see Figure 1), the sample was unloaded and AFM and SWLI scans were taken in a similar manner as before deformation. The sequence of surface morphology investigations was ended at the onset of macroscopic deformation localization (necking).

Typical surface profiles are shown in Figure 2 representing a “long” AFM profile obtained from a m m scan together with a SWLI profile. To investigate a possible self-affine structure, mean height differences were evaluated as a function of for each of the AFM and SWLI profiles by averaging over all pairs within the profile. Self-affine behavior implies that
| (1) |
Hence, double-logarithmic plots of vs. should exhibit a linear scaling regime with slope . Such ’roughness plots’ are shown in Figure 3. Typical plots exhibit linear scaling regimes extending between 0.05 and 5 m for the AFM and between 0.5 and 100 m for the SWLI profiles. Hurst exponents deduced from the slope of the scaling regimes are similar for AFM and SWLI profiles, and also the absolute values of are similar across the region of overlap of the roughness plots. Hence, we observe continuous scaling over almost four orders of magnitude. Surface profiles taken in the direction normal to the tensile axis exhibit scaling with similar exponents, although the length of the self-affine scaling regimes is reduced.
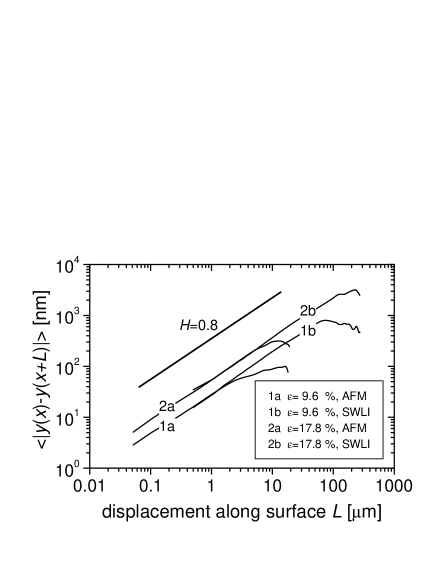
Roughness plots obtained from the “short” AFM profiles deduced from m m scans show a crossover to a strain-independent apparent Hurst exponent below 50-100 nm.
Hurst exponents and fractal dimensions determined from the roughness plots are compiled in Figure 4. The error bars reflect the scatter of exponents obtained from different profiles taken at the same strain. It can be seen that the exponents initially decrease with increasing strain and then stabilize above at a value of .

It is important to note that the initial value of does not reflect any self-affine surface roughness but simply stems from large-scale gradients on an almost smooth surface. The same is true for the steepening of roughness plots obtained from the “short” AFM profiles on very small scales: Below 50 nm, the apparent Hurst exponent increases towards as one essentially observes the smooth initial surface in between the deformation-induced surface steps.
To further investigate the statistical surface properties in the different scale regimes, probability distributions of surface height differences have been determined for the profiles taken at . m was taken as a reference and all height differences were normalized by the variance nm of the corresponding height difference distribution. Within the scaling regime ( nm, m), probability distributions corresponding to
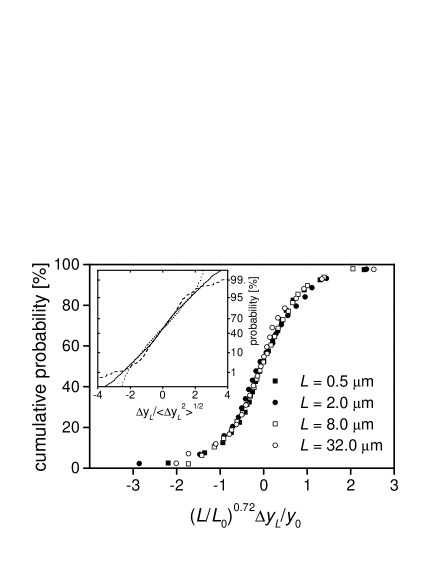
different values of can be collapsed by re-scaling with (see Figure 5):
| (2) |
To assess the shape of the probability distributions, cumulative distributions normalized to unit variance have been represented on a probability scale (i.e., the error function appears as a straight line). The insert of Figure 5 shows the cumulative distribution for m (full line) as well as two distributions for values outwith the scaling regime, namely for nm (dashed line) and m (dotted line). Whereas distributions throughout the self-affine scaling regime are well approximated by Gaussian statistics, the tails of distributions outwith the scaling regime exhibit characteristic deviations from Gaussian behavior. On scales below the surface morphology is characterized by flat regions separated by huge slip steps at locations where slip events have occurred. This leads to a leptokurtic distribution with heavy tails. On scales above , on the other hand, the surface flattens and large height fluctuations are suppressed since the macroscopic slope of the SWLI profiles is by definition set to zero. This gives rise to platykurtic distributions with truncated tails.
The fact that the statistics is Gaussian throughout the scaling regime implies that the surface profiles can be mathematically interpreted as graphs of fractional Brownian motions. This allows us to draw conclusions on the underlying plastic strain pattern since the increments of a fractional Brownian motion exhibit long-range correlations given by ENR04
| (3) |
Since equals the component of the plastic distortion tensor at the surface, our observations yield strong evidence for power-law correlations in the distribution of plastic strain. From the correlation integral
| (4) |
we deduce a correlation dimension for the one-dimensional strain pattern underlying the surface profile. The value is consistent with the fractal dimension of slip line patterns reported by Kleiser and Bocek KLE86 . A dimension of 0.5 for a one-dimensional strain pattern is also consistent with the dimension for the three-dimensional pattern of slip events measured by Weiss and Marsan WEI03 . These investigations were performed on single crystals; due to experimental limitations the scaling regimes cover only about one order of magnitude. Our results demonstrate that the strain pattern in polycrystals exhibits an analogous self-similar behavior which by combining different experimental techniques can be traced over almost four orders of magnitude in scale.
More investigations are required to decide whether the Hurst exponent which we determine for deformed metal surfaces is universal, i.e. independent of material and deformation conditions. Further investigations are also needed to establish the nature of the boundaries of the self-affine scaling regime. The lower bound of the scaling regime can be related to the spacing between individual ’slip events’ between which the surface remains unchanged by the deformation. The upper boundary of the scaling regime, which defines the correlation length of the self-affine surface pattern, is of the same order of magnitude as the grain size (40 microns). One may reasonably conjecture that the range of correlations in the dislocation dynamics, and therefore in the slip pattern, is limited by the grain size. However, further experimental work (preferably on single crystals) is required to decide whether this is indeed the physical mechanism which determines the correlation length.
From the theoretical side, the fact that the Hurst exponent of deformed metal surfaces is quite similar to that of fracture surfaces raises the fundamental question whether there is a universal mechanism underlying both observations, or whether the similarity of exponents is incidental. Crystal plasticity is a bulk phenomenon which only indirectly affects the surface, whereas fracture is directly governed by surface and interface properties. However, this does not preclude the possibility of a common theoretical treatment within the framework of non-equilibrium critical phenomena.
In view of plasticity models using coarse-grained strain variables, our results indicate that strain fluctuations may average out rather slowly. The strain fluctuation on scale can be estimated as . At the lower end of the self-affine scaling regime ( nm), fluctuations are of the same order of magnitude as the average strain. Within the scaling regime, strain fluctuations decrease like if averaged over the length ; for we find that the residual strain fluctuations at the upper end of the scaling regime (m) are still about 15 % of the average strain. This observation explains why it is possible to detect significant strain fluctuations even on macroscopic scales DIE56 ; ZAI96 .
Acknowledgments
Financial support by the European Commission under RTN/DEFINO HPRN-CT 2002-00198 and of EPSRC under Grant Nos. GR/S20406/01 and GR/R43181/01 is gratefully acknowledged.
References
- (1) M.-C. Miguel, A. Vespignani, S. Zapperi, J. Weiss and J. R. Grasso, Nature 410, 667 (2001).
- (2) M.-C. Miguel, A. Vespignani, S. Zapperi, J. Weiss and J. R. Grasso, Mater. Sci. Engng. A 309-310, 324 (2001).
- (3) J. Weiss, J. R. Grasso, M.-C. Miguel, A. Vespignani and S. Zapperi, Mater. Sci. Engng. A 309-310, 360 (2001).
- (4) M. Zaiser, Mater. Sci. Engng. A 309-310, 304 (2001).
- (5) M.-C. Miguel, A.Vespignani, M.Zaiser and S. Zapperi, Phys. Rev. Letters 89, 165501 (2002).
- (6) J.Weiss and D.Marsan, Science 299, 89 (2003).
- (7) H. Neuhauser, Slip-line formation and collective dislocation motion, in Dislocations in Solids, edited by F.R.N. Nabarro (North-Holland, Amsterdam, 1983), p. 319.
- (8) A.A. Konstantinidis and E.C. Aifantis, J. Engng. Mater. Technol. 124, 358 (2002).
- (9) T. Kleiser and M. Bocek, Z. Metallkde. 77, 582 (1986).
- (10) B. Mandelbrot, Phys. Scripta 32, 257 (1985).
- (11) E. Bouchaud, J. Phys: Cond. Mat. 9, 4319 (1997).
- (12) N. Enriquez, Stochast. Proc. Appl. 109, 203 (2004).
- (13) J. Diehl, Z. Metallkde. 47, 331; 411 (1956).
- (14) M. Zaiser and P. Hähner, Phil. Mag. Letters 73, 369 (1996).