In-Plane Spectral Weight Shift of Charge Carriers in YBa2Cu3O6.9
The temperature dependent redistribution of the spectral weight of the plane derived conduction band of the high temperature superconductor (Tc = 92.7 K) was studied with wide-band (from 0.01 to 5.6 eV) spectroscopic ellipsometry. A superconductivity - induced transfer of the spectral weight involving a high energy scale in excess of 1 eV was observed. Correspondingly, the charge carrier spectral weight was shown to decrease in the superconducting state. The ellipsometric data also provide detailed information about the evolution of the optical self-energy in the normal and superconducting states.
The mechanism of high-temperature superconductivity (HTSC) is one of the main unsolved problems in condensed matter physics. An influential class of theories predicts that HTSC arises from an unconventional pairing mechanism driven by a reduction of the kinetic energy of the charge carriers in the superconducting (SC) state (?, ?, ?). This contrasts with the conventional Bardeen-Cooper-Shrieffer (BCS) model, where correlations of the charge carriers below the SC transition temperature, , bring about an increase in their kinetic energy (?, ?), which is over-compensated by a reduction of the potential energy due to the phonon-mediated attraction. Within a nearest-neighbor tight-binding model, measurements of the optical conductivity can provide experimental access to the kinetic energy via the sum rule for the spectral weight SW, where is the in-plane lattice constant and the unit cell volume (?, ?, ?, ?). The upper integration limit, , needs to be high enough to include all transitions within the conduction band but sufficiently low to exclude the interband transitions. Precise optical data may thus enable one to address the issue of a kinetic energy - driven HTSC pairing mechanism. In fact, optical measurements have ruled out a lowering of the kinetic energy along the axis (perpendicular to the highly conducting CuO2 planes) as the sole mechanism of HTSC (?), but have also shown that it can contribute significantly to the superconducting condensation energy of multilayer copper oxides (?, ?). Recently, experimental evidence for an alternative mechanism driven by a reduction of the in-plane kinetic energy (?) has been reported (?, ?). The comprehensive data set presented here, however, demonstrates that this scenario is not viable.
We performed direct ellipsometric measurements of the complex dielectric function, , over a range of photon energies extending from the far infrared ( eV) into the ultraviolet ( eV) (?). We focus here on the -axis component of of a detwinned crystal at optimum doping ( K) (?). In agreement with previous reports (?, ?, ?, ?), we observed a SC-induced transfer of SW involving an unusually high energy scale in excess of 1 eV. However, our data provide evidence for a SC-induced decrease of the intraband SW and are thus at variance with models of in-plane kinetic energy - driven pairing. Additional data along the axis of the same crystal and for slightly underdoped ( K) supporting these conclusions are presented in the supporting online text and figures.
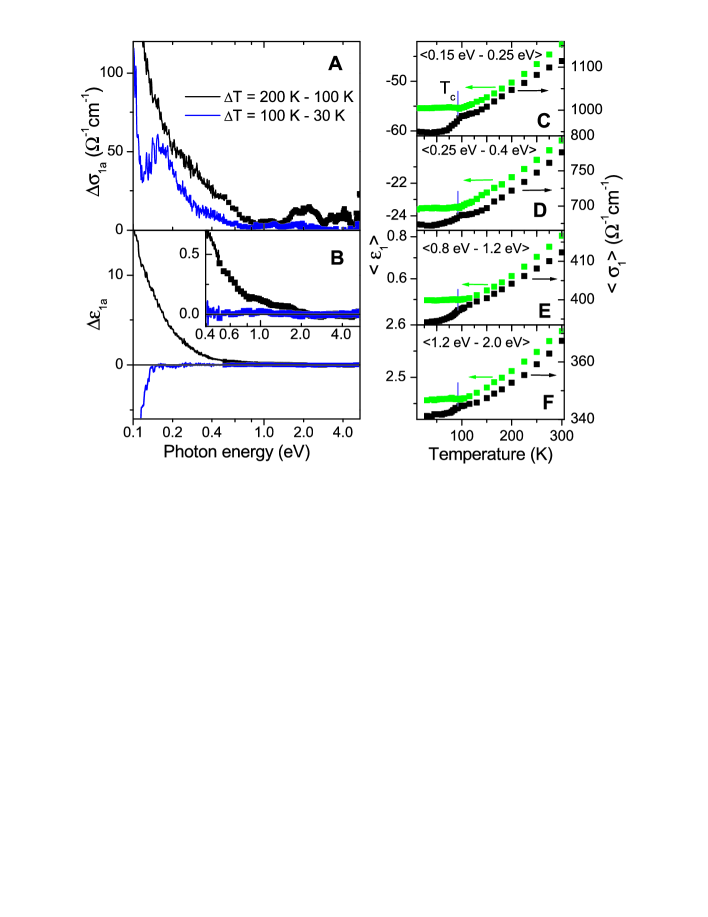
Figure, 1A and B, shows the difference spectra and for the normal and SC states (the measured spectra are displayed in Fig. S1). Figure 2,C to F, details the temperature dependence of and , averaged over different representative photon energy ranges.
First we discuss the -dependent changes in the normal state. The most important observation is the smooth evolution of and over an energy range of at least 0.1 to 1.5 eV. The additional features in and above 1.5 eV arise from the -dependent evolution of the interband transitions (?, ?). Apparently, the response below 1.5 eV is featureless and centered at very low frequency below 50 meV. It can hence be ascribed to a Drude peak [due to transitions within the conduction band or a narrowly spaced set of conduction bands (?)] whose tail at high energy is significantly enhanced by inelastic interaction of the charge carriers. A narrowing of the broad Drude peak at low accounts for the characteristic -dependent SW shift from high to low energies, while it leaves the intraband SW unaffected (?). SW is removed from the high energy tail, which involves a surprisingly large energy scale of more than 1.5 eV, and transferred to the “head” near the origin. As a consequence, curves at different temperatures intersect; for instance around meV for curves at 200 and 100 K [inset of Fig. S1A]. Furthermore, as detailed in the online material, the integration of above the intersection point yields a SW loss that is well balanced by the estimated SW gain below the intersection point, so that the total SW is conserved within the experimental error.
The -dependence of affords an independent and complementary way to analyze the SW shift from high to low energies. Figure 1 shows that and follow the same -dependence in the normal state; that is, a concomitant decrease of both quantities with decreasing is observed at every energy over a wide range from 0.05 to 1.5 eV. A simple analysis of these data based on the Kramers-Kronig (KK) relation (?) confirms that the SW lost at high energies is transferred to energies below 0.1 eV. We note that the blue-shift of the zero-crossing of , , [inset of Fig. S1B] can be explained by the narrowing of the broad Drude-peak alone, without invoking a change of the total intraband SW.
We now turn to the central issue, the evolution of the SW in the SC state. It can be seen in Fig. 1 that the -dependent decrease of in the high energy range becomes even more pronounced in the SC state. The data of Fig. 1,E and F, thus confirm previous reports of an anomalous SC-induced SW decrease at high energies (?, ?). Figure 1, C and D, however, shows that this trend continues down to at least 0.15 eV, and Fig. 1A reveals that the difference spectra do not differ substantially between normal and SC states in the energy range between 0.15 and 1.5 eV. In both cases, exhibits a continuous decrease towards high energy, which levels off near 1.5 eV. As discussed above, this behavior is characteristic of the narrowing of a broad intraband response. Significant differences between the responses in the normal and SC states are observed only below eV, where the SC-induced changes are dominated by formation of the SC condensate. The latter effect has been extensively discussed in the literature (?, ?).
Next we discuss the evolution of the real part of the dielectric function, , in the SC state, which again provides complementary information about the SW redistribution. For the normal state, we have shown that the transfer of SW from high to low energies gives rise to a decrease of , as dictated by the KK relation between and . Figure 1 shows that this trend suddenly ceases in the SC state, where does not exhibit a SC-induced anomaly mirroring the one of . Whereas decreases precipitously below , remains virtually -independent. This trend holds not only near 0.9 eV but persists over a wide energy range from 1.5 eV down to at least 0.15 eV. The KK relation necessarily implies that the SW loss between 0.15 and 1.5 eV needs to be balanced by a corresponding SW gain below 0.15 eV and above 1.5 eV (?, ?). In addition to the SW transfer to low energies due to the narrowing of the charge carrier response, as discussed above, the SC-induced SW change must therefore involve the shift of a significant amount of SW from low energy () to energies well in excess of . In contrast to the situation in the normal state, where the total charge carrier SW is conserved within the experimental uncertainty, this additional SC-induced shift of SW to high energies gives rise to a decrease of the total charge carrier SW. We emphasize that this is a model-independent conclusion based solely on the KK relation (?, ?) between and , both of which are directly measured by ellipsometry.
The related SW changes can be quantified using the extended Drude formalism where the real and imaginary parts of the optical self-energy, , are represented by a frequency dependent mass-renormalization factor, , and scattering rate, , respectively (?). The renormalized plasma frequency,
and the scattering rate,
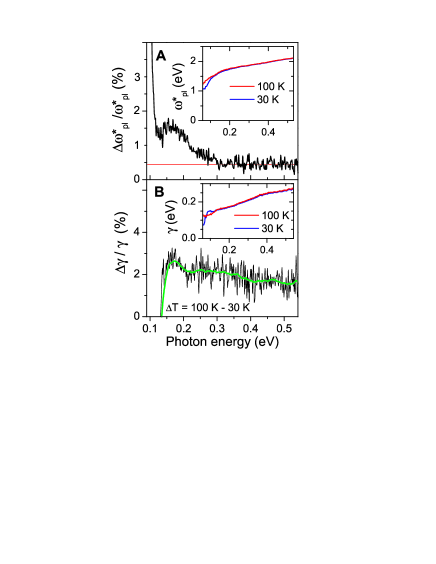
can be derived from the ellipsometric data. The value of is extracted from the high energy part of the spectra (?). The normalized difference between normal and SC states, , is displayed in Fig. 2A (?). Most notably, saturates above 0.3 eV at a finite value of 0.5 % (thin red line). This finite asymptotic value of above 0.3 eV cannot be ascribed to an anomaly of the mass-renormalization factor , which should decrease to zero as a function of increasing energy. Instead, the asymptotic value of is indicative of a SC-induced change in the bare plasma frequency, . With eV, as derived from [inset of Fig. 2A] around 0.45 eV, and SW we thus obtain a SC-induced loss of the intraband SW of eV2.
Figure 2B shows the normalized difference , with and derived directly from the data (?). The anomaly of the scattering rate evidently extends to very high energy, exhibiting a slow but steady decrease with increasing energy. In contrast, the SC-induced anomaly in the mass renormalization factor decreases rapidly and essentially vanishes above 0.3 eV. This decrease of with an energy scale of 0.3 eV provides an upper limit for the spectrum of excitations strongly coupled to the charge carriers. The observed self-energy effects are in fact well reproduced by models where the charge carriers are coupled to bosonic modes (such as spin fluctuations or phonons) with a cut-off energy of about 0.1 eV.
This analysis confirms our conclusion that the charge carrier response not only exhibits an anomalous narrowing but also loses SW in the SC state. In the framework of a nearest-neighbor tight-binding model, the observed SW loss corresponds to an increase of the kinetic energy in the SC state. Although this trend is in line with the standard BCS theory, as discussed in the introduction, an analysis becomes more difficult beyond this simple approach (?, ?). For instance, correlation effects due to the strong on-site repulsion of the charge carriers on the Cu ions strongly influence the electronic structure. Within the Hubbard model, a single-band picture becomes inadequate, and the integration should include all Hubbard bands; that is, (?, ?). Changes of the intraband SW unrelated to the kinetic energy may also be associated with structural anomalies known to occur below in a number of high-temperature superconductors, including (?). Although the expected SW changes due to the dependence of the lattice parameters are negligible, changes in the relative position of certain ions, such as the apical oxygen ions, may have a significant impact. Finally, the SC-induced broad band SW transfer may be closely related to the so-called pseudogap phenomenon, which has been reported to exist in the cuprate HTSCs even at optimal doping. Within this approach, possible perturbation of the momentum-distribution function over the conduction band due to the coupling of charge carriers to spin fluctuations may contribute to the observed effect. More systematic experimental and theoretical work is needed in order to address these possibilities.
Our broad-band (0.01 to 5.6 eV) ellipsometric measurements
on and
suggest a sizable SC-induced decrease of the total
intraband SW. In the context of the nearest-neighbor tight-binding
model, this effect implies an increase of the kinetic energy in the SC
state, which is in line with the standard BCS theory. We, however, argue
that a microscopic understanding of this behavior requires
consideration beyond this approach, including strong correlation effects.
References and Notes
- 1. P.W.Anderson, The Theory of Superconductivity in the High- Cuprates (Princeton Univ. Press, Princeton, 1997).
- 2. S. Chakravarty, H.-Y. Kee, and E. Abrahams, Phys. Rev. Lett. 82, 2366 (1998).
- 3. J.E. Hirsch and F. Marsiglio, Phys. Rev. B 62, 15131 (2000).
- 4. M. Tinkham, Introduction to Superconductivity, (McGraw-Hill, New York, ed. 2, 1996).
- 5. S. Chakravarty, H.-Y. Kee, and E. Abrahams, Phys. Rev. B 67, 100504(R)(2003).
- 6. M.R. Norman and C. Pépin, Phys. Rev. B 66, 100506(R) (2002).
- 7. P.F. Maldague, Phys. Rev. B 16, 15131 (1977).
- 8. Materials and methods are available as supporting material on Science Online.
- 9. A.A. Tsvetkov et al., Nature 395, 360 (1998).
- 10. D.N. Basov et al., Science 283, 49 (1999).
- 11. A.V. Boris et al., Phys. Rev. Lett. 89, 4907 (2002).
- 12. H.J.A. Molegraaf, C. Presura, D. van der Marel, P.H. Kes, M. Li, Science 295, 2239 (2002).
- 13. A.F. Santander-Syro et al., Europhys. Lett. 62, 568 (2003).
- 14. M.J. Holcomb, C.L. Perry, J.P. Collman, W.A. Little, Phys. Rev. B 53, 6734 (1996).
- 15. M. Rübhausen, A. Gozar, M.V. Klein, P. Guptasarma, and D.G. Hinks, Phys. Rev. B 63, 224514 (2001).
- 16. J. Kircher et al., Physica C 192, 473 (1992).
- 17. S.L. Cooper et al., Phys. Rev. B 47, 8233 (1993).
- 18. See, e.g., D.L. Feng et al., Phys. Rev. Lett. 86, 5550 (2001).
- 19. A.E. Karakozov, E.G. Maksimov, O.V. Dolgov, Solid State Commun. 124, 119 (2002).
-
20.
This is most evident if the KK relations are written as
and combined with the -sum rule . - 21. D.B. Tanner and T. Timusk, in The Physical Properties of High Temperature Superconductors III, D.M. Ginsberg, Ed. (World Scientific, Singapore, 1992), pp. 363-469.
- 22. An uncertainty of in translates into a shift of only about for and .
- 23. The normalized difference is defined as .
- 24. J.E. Hirsch, Phys. Rev. B 67, 035103 (2003).
- 25. V. Pasler et al., Phys. Rev. Lett. 81, 1094 (1998).
- 26. Supported by the Deutsche Forschungsgemeinschaft (DFG), grant BE 2684/1-2 in the consortium FOR538. We gratefully acknowledge Y.-L. Mathis and B. Gasharova for the support at the infrared beamline of the ANKA synchrotron at FZ Karlsruhe. We also thank O.K. Andersen, E.G. Maksimov, D.N. Aristov, and D. van der Marel for fruitful discussions. We acknowledge B. Nansseu Nako for taking part in some of the measurements.
Supporting Online Material
www.sciencemag.org/cgi/content/full/304/5671/708/
Materials and Methods
Text
Figs. S1-S6
References and Notes
Supporting Online Material
“In-Plane Spectral Weight Shift of
Charge Carriers in YBa2Cu3O6.9”
www.sciencemag.org/cgi/content/full/304/5671/708/
Methods and materials
Experimental
A high quality single crystal grown in an Y-stabilized ZrO crucible was annealed in flowing oxygen at 490 ∘C for one week and subsequently quenched into liquid nitrogen to achieve optimum doping. The crystal was detwinned using a home-built apparatus that allows application of mechanical pressure while heating in an enclosed oxygen atmosphere. Complete detwinning was confirmed with a polarizing microscope and by x-ray diffraction. The sample surfaces were polished to optical grade using diamond paste. From the DC magnetization, we obtain K. A slightly underdoped Bi2212 crystal with K was grown by the traveling solvent floating zone technique in air (S1). For the spectral range 0.5-5.5 eV we used a home-built ellipsometer based on a rotating analyzer as described in Refs. (S2,S3). For the range 0.01-0.6 eV we used another home-built ellipsometer attached to a standard Fast-Fourier-Transform-Interferometer (FTIR) as described in Refs. (S4,S5). The FIR measurements were performed at the IR-beamline of the ANKA synchrotron light source at FZ Karlsruhe, Germany. For the MIR measurements we used the conventional glow-bar light source of a Bruker 113V FTIR spectrometer. Separate measurements were performed for each of the principal axes in the plane of incidence. The components of the dielectric tensor were obtained using a well established numerical procedure (S6-S8). Ellipsometry has the advantage that it measures the complex dielectric function directly. Its self-normalizing nature allows us to analyze the -dependent redistribution of the charge carrier SW in the normal and SC states with high accuracy and reproducibility. Error bars of the relative (-dependent) changes of the dielectric function are smaller than 0.2 % throughout the spectral range from 50 meV to 5 eV.
Spectral Weight and Sum Rules
The sensitivity of optical experiments to the kinetic energy of the charge carriers is rooted in the fundamental sum rule SW, where is the total density of electrons, is the free electron mass, and SW() = is the so-called spectral weight. An important parameter is the upper integration limit, . For , SW is conserved and independent of the interaction between electrons. A physically meaningful restricted sum rule, SW, with the density of the carriers in the conduction band, their effective band mass, and the plasma frequency, can be obtained if is chosen high enough to include all intraband transitions within the conduction band, but sufficiently low to exclude the interband transitions. Within a nearest-neighbor tight-binding model, the charge-carrier SW is proportional to the single-band kinetic energy, , i.e. SW, where is the in-plane lattice constant, and the unit cell volume (S9-S11). Precise optical data over a sufficiently wide energy range (with an upper cutoff beyond ) may thus enable one to address the issue of a kinetic-energy driven HTSC pairing mechanism.
An accurate determination of the -dependent intraband SW is a difficult experimental task, because less than 1% of the total charge carrier SW is redistributed in the relevant temperature range. Another complication arises from an uncertainty in the choice of due to the lack of a transparency window () between the intra- and interband absorption. Specifically, in order to deduced a kinetic energy reduction below , one needs to check whether the SW transferred to low energies in the SC state indeed originates from interband transitions or rather from the tail of the normal-state intraband response. A -dependent narrowing of a very broad charge carrier response will also give rise to a SW redistribution from high to low energies, but it leaves the intraband SW and thus the kinetic energy unaffected (S12).
Kramers-Kronig consistency of the T-dependent changes in and
Applying the KK analysis below we note that has a singularity at due to the response of the SC condensate where is the London penetration depth. In the SC state one then has
where is a regular function. One can apply the KK relation as in Ref. (19),
assuming that contains the superconducting -function at below . This relationship between and can be used to obtain a conceptually model-independent estimate of whether SW is redistributed from high to low energy or vice versa. If decreases in the vicinity of whereas remains constant, this SW decrease around needs to be balanced by a corresponding SW gain below and above according to:
The most important point is that we observe the same trend for the -changes of and at every energy over the entire range extending from 0.15 eV up to at least 1.5 eV. The SW loss between 0.15 eV and 1.5 eV then needs to be balanced by a corresponding SW gain below 0.15 eV and above 1.5 eV. In other words there is necessarily a corresponding SW gain in the interband energy range above 1.5 eV caused by a decrease of the total intraband SW. We note that this our conclusion does not lose a generality seeing the SC-induced redistribution of SW within the range below 0.15 eV. These changes including a singular part are dominated by formation of the SC condensate and have been extensively discussed in the literature (see, e.g., early publications (S13-S15)).
Analysis using the Extended Drude model
We discuss our data in terms of the so-called extended Drude formalism (or more general, “memory functions” approach (S16)) where the real and imaginary parts of the dielectric function are given by
The effective mass, , and scattering rate, , of the charge carriers are energy dependent due to strong inelastic scattering; represents the screening by interband transitions.
Concerning the formal aspects of the validity of the extended Drude-model we remark the following points:
1. Mathematically the extended Drude formalism is the representation of the analytical properties of a complex two-particle Green function which does not have poles in the upper half-plane of the complex frequency . It remains valid both in the normal and in the SC states and can provide a good way to obtain meaningful -dependent parameters.
2. The optical mass and optical scattering rate determine the effective mass and the decay of the electron-hole (boson) excitations, meanwhile quasiparticle properties are determined by the fermionic quasiparticle effective mass and the scattering rate. They are not equivalent even in the normal state at , as discussed, e.g., in Ref. (S17).
3. In the SC state the current-current polarization operator is an unified expression. Through the coherence factor and the complex self-energy of the single particle states it contains complete information on all temperature effects, including properties of “paired” and “unpaired” quasiparticles (S18,S19).
4. In our approach we assume that the electron-pairing interactions are limited to energies less than 0.1 eV. The observed SC-induced anomaly in the mass renormalization factor, , supports this our assumption, as discussed in the manuscript. The SC-induced changes of and in Fig. 2 are adequately described within the electron-boson coupling model with an additional decrease of the bare plasma frequency . This explanation is consistent with our conclusion based on the KK analysis of the changes in and .
Supporting Results and Discussion
a-axis of
Figure S1A shows the spectra for the real part of the -axis optical conductivity, , of in the range of 0.06 - 5.5 eV at 10, 100, 200, and 300 K. The data for the FIR range (0.01 - 0.08 eV) are displayed in the inset. Figure S1B shows the corresponding spectra for the real part of the dielectric function, . The inset gives an enlarged view of the zero-crossing of . The overall features of our ellipsometric spectra agree well with the previously reported data on based on normal-incidence reflection (16,20-22) and ellipsometry (22-24), but the superior accuracy of the present data set allows a direct determination of the temperature dependence of both and up to high energies.
The SW shift in the normal state, which involves a surprisingly high energy scale of more than 1 eV, can be understood simply due to the -dependence of the self-energy, that is, in terms of a narrowing of the Drude-peak at low where SW is removed from the high energy tail and transferred to the “head” near the origin. As a consequence, curves at different temperatures intersect, for instance around meV (meV) for curves at 200 and 100 K (300 and 200 K) (inset in Fig. S1A). From the integration of above the intersection point, we obtain a SW loss of () between = 100 K and = 200 K ( = 200 K and = 300 K). This loss is well balanced by the SW gain of () at energies below the intersection point, so that the total spectral weight is conserved within the experimental error. For the latter estimate, we used a linear extrapolation of our ellipsometric data to the literature DC conductivity (25), as indicated in the inset of Fig. S1A.
The -dependence of affords an independent and complementary way to analyze the SW shift from high to low energies through the KK relationship between and , as outlined above. A concomitant decrease of both and with decreasing is observed over a wide energy range from 0.05 eV to 1.5 eV confirming that the SW lost at high energies is transferred to energies below 0.1 eV. We note that the blue-shift of the zero-crossing of [inset in Fig. S1B] can be explained by the narrowing of the broad Drude-peak alone, without invoking a change in the total intraband SW. From Eq. (S4), . The -dependent correction factor due to strong inelastic scattering of the charge carriers, , accounts for the blue shift of at low while the screened plasma frequency, , and hence the total SW of the Drude-peak, , remains -independent. This brings us to the important conclusion: The observation of an unusual SW transfer, even over a very wide energy range, and a subsequent blue-shift of do not necessarily imply a reduction of the kinetic energy of the charge carriers. It may also result from the narrowing of a Drude-response whose tail extends beyond the screened plasma frequency.
b-axis of
Figure S2A shows the spectra for the real part of the optical conductivity, , along the one-dimensional CuO chains in Y-123, in the range of 0.06-5.5 eV at 10, 100, 200, and 300 K. Figure S2B shows the corresponding spectra for the real part of the dielectric function, . The SC-induced difference spectra and are displayed in Fig. S3A. Figure S3B presents the temperature dependence of and averaged over representative photon energy range from 0.25 eV to 0.4 eV. In contrast to the -axis response, the normal state difference spectra (not shown) and the temperature dependence of (Fig. S3B) exhibit nonmonotonic behavior. This is a consequence of the contribution from the Cu-O chains to the -axis optical response of the charge carriers, which can not be described within a single band picture. However, the SC-induced changes in and are very similar to those observed in the -axis response. While decreases rapidly below Tc, remains almost -independent, or even exhibits an opposite trend over a broad energy range from 0.2 eV up to 2 eV.
Furthermore, an equivalent result has been obtained for a slightly underdoped Bi-2212 crystal. Figure S4A shows the spectra for the real part of the in-plane optical conductivity, , of underdoped Bi2212 in the range of 0.06-0.5 eV at 10, 100, 200, and 300 K. Figure S4B shows the corresponding spectra for the real part of the dielectric function, . The difference spectra and are displayed in Figure S5, A and B. Figures S5 and S6 show that the spectral anomalies in underdoped Bi2212 have the same character as in Y123, although they are observed over a broader temperature range from 120 K ( 86 K) to 50 K.
Conclusions
Our ellipsometric data on both Y123 (-axis) and Bi2212 show that the overall SC-induced features agree well with our data measured along the -axis in Y123 [see Fig. 1-2 of the main text, and Fig. S1]. Following the line of arguments as described in the report for the -axis optical response of Y-123 we find an evidence for a SC-induced decrease of the charge carrier SW that is partially masked by the narrowing of a broad Drude-response.
References
S1. B. Liang, C.T. Lin, Journal of Crystal Growth 237-239, 756 (2002).
S2. J. Kircher et al.,
Physica C 192, 473 (1992).
S3. L. Viña, S. Logothetidis, and M. Cardona, Phys. Rev. B
30, 1979 (1984).
S4. R. Henn et al.,
Thin Solid Films 313-314 642 (1998).
S5. C. Bernhard, J. Humlicek and B. Keimer, to appear in Thin Solid Films.
S6. J. Humlíček, A. Röseler,
Thin Solid Films 234 332 (1993).
S7. R.M.A. Azzam and N.M. Bashara, in Ellipsometry and polarized light
(Noth Holland, Amsterdam, 1977).
S8. A. Röseler, Infrared Spectroscopic Ellipsometry, (Akademie-Verlag, Berlin, 1990).
S9. J.E. Hirsch and F. Marsiglio, Phys. Rev. B 62, 15131 (2000).
S10. M.R. Norman and C. Pépin, Phys. Rev. B 66, 100506(R) (2002).
S11. P.F. Maldague, Phys. Rev. B 16, 15131 (1977).
S12. A.E. Karakozov, E.G. Maksimov, O.V. Dolgov, Solid State
Commun. 124, 119 (2002).
S13. N.E. Bickers, D.J. Scalapino, R.T. Collins, and Z. Schlesinger, Phys. Rev. B
42, 67 (1990).
S14. R. Akis, J.P. Carbotte, and T. Timusk, Phys. Rev. B 43, 12804 (1991).
S15. O.V. Dolgov, A.A. Golubov, and S.V. Shulga, Physics Lett. A 147, 317 (1990).
S16. D.B. Tanner and T. Timusk, in The Physical Properties
of High Temperature Superconductors III, D.M. Ginsberg, Ed.
(World Scientific, Singapore, 1992), pp. 363-469.
S17. S.V. Shulga, O.V. Dolgov, and E.G. Maksimov, Physica C 178, 266 (1991).
S18. P.B. Allen, Phys. Rev. B 3, 305 (1971).
S19. E. Schachinger, J.P. Carbotte, and F. Marsiglio, Phys. Rev. B 56, 2738 (1997) and references therein.
S20. D.N. Basov et al.,
Phys. Rev. Lett. 77, 4090 (1996).
S21. C.C. Homes et al.,
Phys. Rev. B 69, 024514 (2004).
S22. S.L. Cooper et al.,
Phys. Rev. B 47, 8233 (1993).
S23. J. Kircher et al.,
Physica C 192, 473 (1992).
S24. C. Bernhard et al.,
Solid State Commun. 121, 93 (2002).
S25. K. Segawa and Y. Ando, Phys. Rev. Lett. 86, 4907 (2001).
![[Uncaptioned image]](/html/cond-mat/0405052/assets/x3.png)
Fig. S1. Real part of the (A) optical conductivity, , and (B) dielectric function, , along the -axis of . The inset to (A) shows over the FIR spectral range. The squares on the left ordinate represent the DC conductivity from Ref. (25). The inset to (B) enlarges the spectral range around the zero-crossing of .
![[Uncaptioned image]](/html/cond-mat/0405052/assets/x4.png)
Fig. S2. Real part of the (A) optical conductivity, , and (B) dielectric function, , along the -axis of .
![[Uncaptioned image]](/html/cond-mat/0405052/assets/x5.png)
Fig. S3. (A) Difference spectra (black) and (green) below the SC transition between and . (B) Temperature dependence of (black squares) and (green squares) averaged over 0.25 - 0.4 eV energy range.
![[Uncaptioned image]](/html/cond-mat/0405052/assets/x6.png)
Fig. S4. Real part of the in-plane (A) optical conductivity, , and (B) dielectric function, , of slightly underdoped with 86 K.
![[Uncaptioned image]](/html/cond-mat/0405052/assets/x7.png)
Fig. S5. Difference spectra (A) and (B) in the normal state of at and (red line), at and (black line), and between 86 K) and (blue line).
![[Uncaptioned image]](/html/cond-mat/0405052/assets/x8.png)
Fig. S6. Underdoped ( 86 K). (A) Temperature dependence of (black squares) and (green squares) averaged over 0.25 - 0.4 eV energy range. (B) Temperature derivative .