On the thermoelectricity of correlated electrons in the zero-temperature limit
Abstract
The Seebeck coefficient of a metal is expected to display a linear temperature-dependence in the zero-temperature limit. To attain this regime, it is often necessary to cool the system well below 1K. We put under scrutiny the magnitude of this term in different families of strongly-interacting electronic systems. For a wide range of compounds (including heavy-fermion, organic and various oxide families) a remarkable correlation between this term and the electronic specific heat is found. We argue that a dimensionless ratio relating these two signatures of mass renormalisation contains interesting information about the ground state of each system. The absolute value of this ratio remains close to unity in a wide range of strongly-correlated electron systems.
pacs:
71.27.+a, 72.15.Jf , 71.10.Ay1 Introduction
Almost two decades ago, Kadowaki and Woods (KW) noticed a universal correlation between two distinct signatures of electronic correlation in heavy fermion systems[1]. In these compounds, due to a large density of states at Fermi energy, both the electronic specific heat () and the term in the temperature-dependence of the resistivity ( with ) are enhanced. KW defined a ratio linking these two quantities () and observed that for various heavy-fermion compounds the magnitude of this ratio is close to a value (), which is an order of magnitude higher than the ratio observed in simple metals[1, 2]. More recently, Tsujii et al.[3] have reported that in many Yb-based compounds with a moderate effective mass the KW ratio is closer to the value observed in simple metals. It has been argued that the proportionality ratio reflects the large energy dependence of the conduction electron’s self-energy[2].
During the last years, the discovery of behavior in other remarkable Fermi liquids, such as SrRu2O4[4], LiV2O4[5], La1.7Sr0.3CuO4[6], and NaxCoO2[7], has led to the extension of the KW plot beyond the heavy fermion compounds. In many of these metallic oxides, the KW ratio is found to be intriguingly enhanced and the enhancement has been attributed to unusually large electron-electron scattering.
A Fermi liquid is also characterized by the Wilson ratio (, where and are respectively the Boltzmann constant and the Bohr magneton) which links to the Pauli spin susceptibility, [8]. This dimensionless number is equal to unity for free electrons and increases up to two for a single Kondo impurity of spin 1/2[9]. Indeed, such an enhanced Wilson ratio has been observed in a variety of strongly-correlated electronic systems[10, 4, 6].
In this paper, we focus on a third ratio connecting two distinct consequences of strong correlations among electrons. We begin by recalling that the thermopower of a free electron gas is linear as a function of temperature. Moreover, the magnitude of the Seebeck coefficient in this regime is directly proportional to the density of states at Fermi energy. A dimensionless ratio links the Seebeck coefficient to the electronic specific heat through the Faraday number and is equal to for free electrons. Our examination of the available experimental data leads to the intriguing conclusion that this ratio remains close to for a wide range of strongly-interacting electronic systems in spite of their complex band structure. We will argue that scrutinizing this ratio in a given compound is a source of insight to the properties of the ground state.
2 The Seebeck coefficient of the free electron gas
In a Boltzmann picture, the thermo-electeric power, also known as the Seebeck coefficient, is given by[11, 12, 13]:
| (1) |
Here, is the elementary charge and the Fermi energy. The function , defined as [11]:
| (2) |
yields the dc electric conductivity of the system for , where is the electron wave-vector and is the scattering time. Inserting this expression into equation 1 yields[11]:
| (3) |
where ) is the inverse of the effective mass tensor. This expression is a testimony to the difficulty of interpretation of the temperature-dependence of thermopower. It contains information on both transport and thermodynamic properties of the system. The scattering time and its energy-dependence are only present in the first term of the right side of the equation. The second term is purely thermodynamic.
In the simple case of a free electron gas, the second term of Eq. 3 is equal to [11, 14]. Moreover, in the zero-energy limit, the energy-dependence of the scattering time can be expressed as a simple function[14]:
| (4) |
which yields ( for the first term. The simplest case implies an energy-independent relaxation time (). However, alternative cases such as () are conceivable[14, 13]. The latter corresponds to a constant mean-free-path, , which implies 111In the T=0 limit, an energy-independent , corresponding to the average distance between two defects is usually taken for granted. This is thought to be the case even in presence of strong correlations[15]..
This leads to a very simple expression for the thermopower of the free electron gas:
| (5) |
This textbook expression gives a correct estimation of the magnitude of thermopower in real metals. It also indicates that whenever the Fermi energy is replaced by a different and smaller energy scale, the Seebeck coefficient is expected to increase. The Fermi energy is related to the carrier concentration and to the density of states , . For free electrons, the link is given by . Using this expression, Eq. 5 can be written as:
| (6) |
This equation is strikingly similar to the familiar expression for the electronic specific heat of free electrons[11, 12, 13]:
| (7) |
In this regime, as Ziman has put it[12], thermopower probes the specific heat per electron. In other words (and assuming =0): , where the unities are V/K for , J/Km3 for and m-3 for . However, in order to compare different compounds, it is common to express in J/K mol units. Therefore in order to focus on the ratio, let us define the dimensionless quantity:
| (8) |
where is the Avogadro number. The constant C/mol is also called the Faraday number. For a gas of free electrons with =0 (the simplest case), is equal to -1. In the case of an energy-independent mean-free-path, implying , becomes equal to -2/3. Now, if one imagines to replace the free electrons by free holes (that is to assume a hollow spherical Fermi Surface) then would become equal to +1 and to +2/3.
Note that the conversion factor assumes that there is one itinerant electron per formula unit which is often (but not always) the case. Whenever the density of carriers is lower(higher) than 1 /f.u., the absolute magnitude of is expected to be proportionally larger (smaller) than unity.
Now we turn our attention to the real metals.
3 Thermoelectricity in real metals
At a first glance, the relevance of this picture for a quantitative description of thermopower in real metals is desperate. Even in alkali metals which present quasi-spherical Fermi surfaces, the temperature-dependence of the Seebeck coefficient is not linear and in the case of lithium, it is unexpectedly positive (at least down to the lowest temperatures investigated)[14]. There are a number of well-known reasons behind this inadequacy.
First of all, a thermal gradient produces a lattice heat current in addition to the electronic one. Due to electron-phonon coupling, this leads to an additional contribution to thermopower dubbed “phonon drag”[14], which adds up to the “diffusion thermopower”. The latter is the signal generated by the diffusive movement of electrons in the absence of the phononic current. Phonon drag dominates the temperature-dependence of many metals in a wide temperature range. [An analogous magnon drag phenomenon occurs in magnetically-ordered metals.] We recall that the phonon-drag term is proportional to the lattice specific heat and the latter varies as T3 at low temperatures. Therefore, it does not contribute to an eventually linear Seebeck coefficient at very low temperatures and does not constitute a complication in the T=0 limit.
Even the diffusion thermopower of real metals cannot be reduced to the simple picture of the previous section. Since there are different types of scattering centers interacting with various types of carriers, the deconvolution of different contributions is most often an impossible task. The total thermopower is expected to be a weighted sum of different contributions. For example, the Nordheim-Gorter rule, which corresponds to the Matthiessen rule for resistivity, treats the case of a one-band metal in presence of several type of scatterers. According to this rule, , where the index designates distinct contributions to resistivity, and thermopower, [14]. In the case of several type of carriers, one expects each contribution, Sj, to be weighted by the respective conductivity, . A combination of the two situations should occur in real multi-band metals [16]. An obvious obstacle for the application of the free-electron-gas picture (even at T=0) to a multi-band metal appears: for each band, thermopower Sj can be positive or negative but the sign of corresponding electric conductivity [and specific heat] is always positive. Therefore, in principle, the absolute value of the weighted sum which yields the overall thermopower could be considerably reduced compared to what is expected for a one-band metal.
The Mott formula for transition metals[17, 18] is a celebrated milestone in the understanding of thermoelectricity in multi-band metals. In this two-band picture, light electrons of the band associated with the -orbital coexist with the heavier ones of the band. The dominant mechanism is the scattering of the light electrons from the wider [] to the narrower [] band, due to the larger density of states in the latter. This leads to an additional scattering rate which is proportional to the density of state of the band: . As a result of this, thermopower presents a component proportional to ( which dominates the free-electron component[14]. The Mott formula provides a qualitative explanation for the enhanced diffusion thermopower in transition metals. It successfully predicts that the sign of the additional contribution is different for elements situated in the beginning and in the end of the series as a result of the occupancy (or vacancy) of the orbital. All these considerations indicate that thermoelectricity in usual metals (even in reasonably low temperatures) is dominated by many factors which do not correlate with their specific heat. This may partly explain one curious anomaly. In spite of being known for many decades, widely mentioned[11, 12, 13] and commented in detail[14], the free-electron-gas picture of thermoelectricity has not been quantitatively tested. There is no trace of a systematic investigation of real metals verifying the simple correlation between specific heat and thermopower according to Eq. 6-7.
Let us focus on the specific case of heavy fermion compounds which, due to their giant specific heat, are a natural playground for this concept.
4 Thermoelectricity of heavy electrons in the zero-temperature limit
In heavy fermion compounds(HFC), the effective mass, of quasi-particles is enhanced mainly due to Kondo local fluctuations around each -electron atom. A new temperature scale , T appears which defines a Fermi energy much smaller than in common metals (For a recent review see [19]).
The investigation of thermoelectricity in HFCs started more than two decades ago[20]. An early study on Ce- and Yb-based compounds displaying a moderate mass enhancement (the so-called intermediate valence compounds) established a number of features in qualitative agreement with an extension of the Mott formula to - electrons[20, 21]. Both the large enhancement of thermopower up to a value close to and the occurrence of a maximum at Tmax corresponding roughly to the bandwidth of f-electrons (the latter is inversely proportional to ) are compatible with the Mott formula. In many cases, was found to remain linear up to a substantial fraction () of Tmax and did not show a clear signature of entrance into the Fermi liquid regime. Moreover, the Mott formula provides a natural explanation for the positive(negative) sign of thermopower for Ce(Yb)based compounds in a manner analogous to the case of transition metals.
During the last two decades, the exploration of numerous HFCs led to a partial understanding of many features of thermoelectricity in these compounds. At room temperature, the interplay of incoherent Kondo scattering with crystal field (CF) effect leads to a huge at room temperature. No experimental systematics appear below the temperature TCF corresponding to the crystal field energy sacle. Various interpretations have been proposed to explain why thermopower varies from large and positive (as in the case of CeCu6) to large and negative (as for CeCu2Si2) among various compounds. On the other hand, high pressure studies on cerium compounds[22, 23, 24, 25] indicate that under pressure the positive sign is systematically favored presumably because the system is driven towards an intermediate valence state (See[25] for a detailed discussion). On the theoretical side, in the absence of a microscopic theory of thermoelectricity in a Kondo lattice, most authors have focused on the single-impurity case[26, 27, 28].(For a recent survey on theory see [29].)
Nevertheless, the magnitude of the in the zero-temperature limit and its eventual correlation with in HFC has not been a focus of attention. Although such a correlation explicitly appears in the papers by Read and his co-workers[27, 28], no experimental study has been devoted to this issue. Furthermore, for a Kondo impurity of spin with a complete localisation of the 4 charge (that is when n), the thermopower is predicted to collapse at very low temperature. As we will see below, this is not the case of the cerium Kondo Lattices.
With all these considerations in mind, let us examine the magnitude of in the zero-temperature limit from an experimental point of view. In order to address this issue, it is useful to plot the old thermopower data in a different fashion.
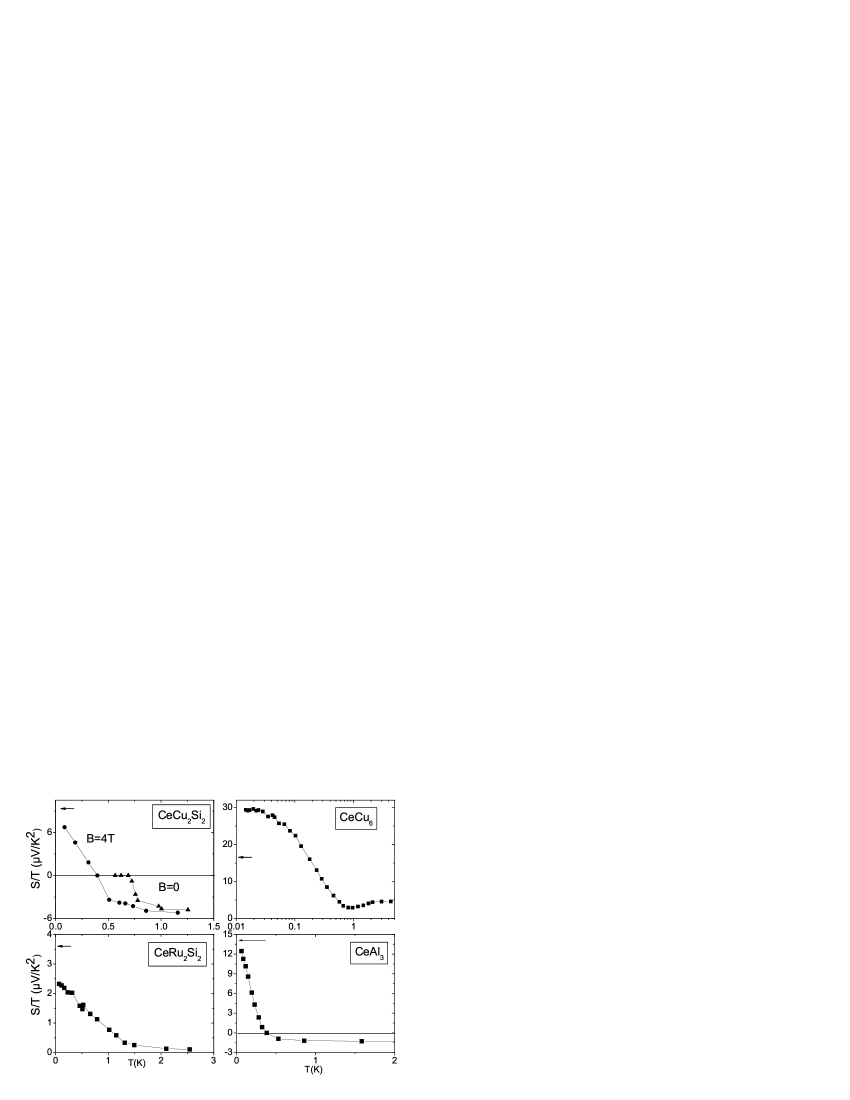
Fig. 1 displays the temperature dependence of using the previously-published data for four different Ce compounds. A polycrystal of CeCu2Si2 was studied by Sparn et al.[30]. At zero field, thermopower remains negative down to Tc ( 0.65 K). But, with the application of a magnetic field and the destruction of superconductivity a positive emerges. Measurements on a polycrystal of CeAl3 was reported by Jaccard and Flouquet[32]. Single crystals of CeRu2Si2 were studied by Amato et al. [31] and here we have plotted these data for . Sato et al. measured a single crystal of CeCu6 with the heat current along the [010] axis[33]. As seen in the figure, in the four cases a finite and positive can be firmly extracted in the zero-temperature limit. Interestingly, in all these systems, the value obtained is not very far from the magnitude of . In the case of CeCu2Si2 and CeAl3, the extracted matches within experimental uncertainty (). In the two other compounds the extracted magnitude yield a close to unity (1.7 for CeCu6 and 0.7 for CeRu2Si2).
The persistent variation of in sub-Kelvin temperature range indicates that the so-called Fermi-liquid regime in these cases is established only at very low temperatures. This is backed by a very careful study of thermopower down to 14 mK in CeCu6[33]. Indeed, Sato et al. reported that becomes constant only below 30 mK which is also the temperature associated with the emergence of a purely T2 resistivity[33]222The carefully-extracted -term in CeCu6 [33](71 ) yields an anomalously large KW ratio. Interestingly, however, the discrepancy vanishes if one directly computes the ratio using values obtained below 30 mK. The anomaly seems to stem from the anisotropy of transport. It is largely reduced when one compares with values of and averaged along in-plane and out-of-plane directions..
5 A short survey of various families
| Compound | S/T ( V / ) | Remarks | (mJ /mol ) | |
| CeCu2Si | 9[30] | polycrystal | 950[52] | 0.9 |
| CeCu6 | 29[33] | along [010] | 1600[53] | 1.7 |
| CeAl3 | 14[32] | polycrystal | 1400[32] | 1..0 |
| CeRu2Si2 | 2.4[31] | in-plane | 350[54] | 0.7 |
| CeCoIn5 (B=6T) | 6[55] | in-plane | 650[56] | 0..9 |
| CePt2Si2 | 2[57] | along [110] | 130[58] | 1.5 |
| CeSn3 | 0.18[59] | polycrystal | 18[60] | 1.0 |
| CeNiSn | 50[61] | polycrystal | 45[62] | 107 |
| YbCu4.5 | -7[63] | polycrystal | 635[64] | -1.1 |
| YbCuAl | -3.6[65] | polycrystal | 267[66] | -1.3 |
| YbCu4Ag | -3.6[67] | polycrystal | 200[68] | -1.7 |
| YbCu2Si2 | -1[20, 69] | polycrystal | 135[70] | -0.7 |
| YbAl3 | -0.6[20] | polycrystal | 45[71] | -1.3 |
| YblnAu2 | -0.75[69] | polycrystal | 40[72] | -1.8 |
| UPt3 | unknown | none observed[35] | 430[35] | – |
| UBe13(B=7.5T) | -12[36] | polycrystal | 1100[73] | -1.1 |
| UNi2Al3 | 0.24[37] | polycrystal | 120[74] | 0.2 |
| UPd | 0.4[37] | S | 150[75] | 0.3 |
| URu2Si2 | -3[38] | S | 65[76] | -4.5 |
| -(BEDT-TTF)2Cu[N(CN) | -0.4[41] | in-plane | 22[77] | -1.7 |
| -(BEDT-TTF)2Cu(NSC)2 | -0.15[42] | in-plane | 25[78] | -0.6 |
| (TMTSF)2ClO4 | unknown | No report found | 11[79] | – |
| Sr2RuO4 | 0.3[44] | in-plane | 38[4] | 0..8 |
| SrRuO3 | unknown | No report found | 30[80] | – |
| Sr3Ru2O7 | unknown | No report found | 38[81] | – |
| SrRhO3 | 0.03[82] | polycrystal | 7.6[83] | 1..3 |
| NaxCoO2 | 0.4[45] | in-plane | 48[46] | 0..8 |
| La1.7Sr0.3CuO4 | 0.18[47] | ceramic | 6.9[6] | 2.5 |
| Bi2Sr2CuO6+δ | -0.25[48] | ceramic | 8.7[84] | -2.8 |
| NbSe2 | 0.3[51] | in-plane | 17[85] | 1.7 |
| Pd | -0.08[16] | polycrystal | 9.5[86] | -0.8 |
| Cu | -0.028[50] | along [231] | 1.6[11] | -1.7 |
| constantan (%43Ni-%57Cu) | -0.25[14] | wire | 27.4[87] | -0.9 |
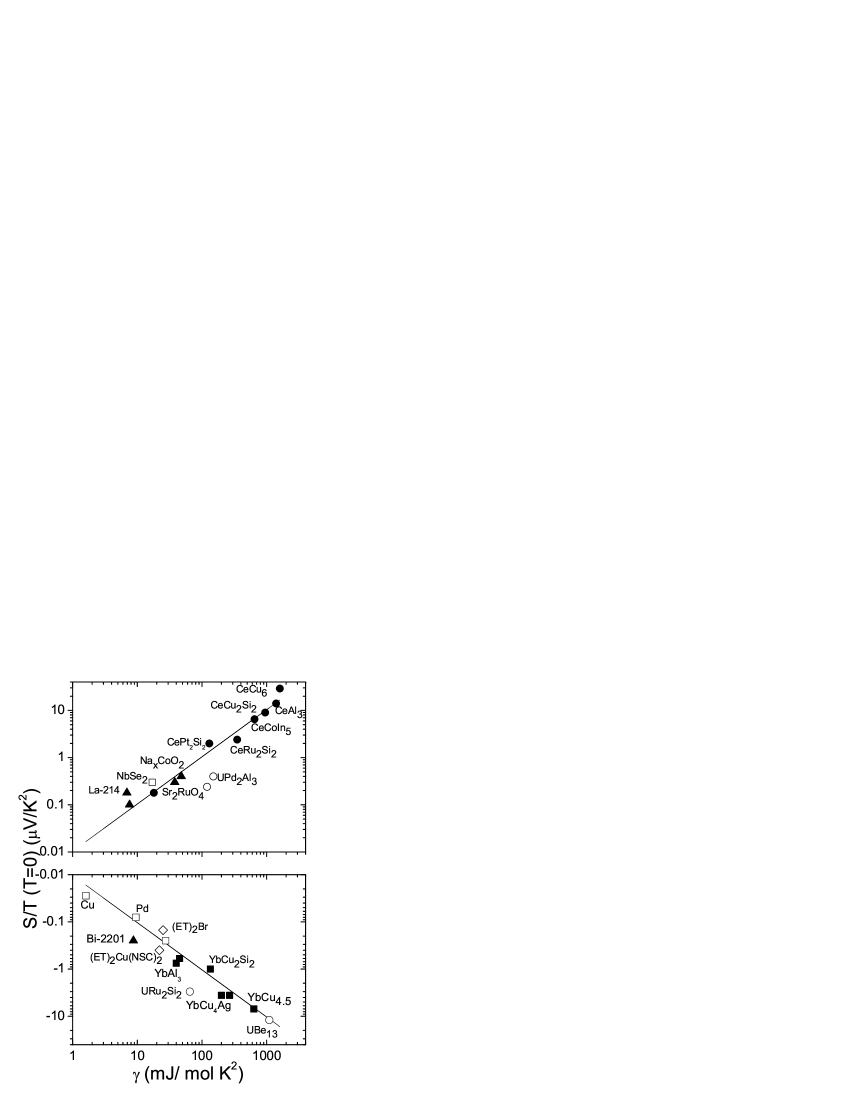
The specific heat of many remarkable metals is well-documented in technical literature. This is not, however, the case for thermoelectric power. In particular, the magnitude of in the zero-temperature limit is almost never explicitly reported. In table I, we have compiled the reported data for a number of compounds. We have tried to restrict ourselves to the cases where the extrapolation of data at lowest reported temperature to T=0 does not appear to produce any significant change in the sign and/or magnitude of . In the case of low-dimensional systems, we have taken the in-plane value. As seen in the table, in most cases the coefficient is not very far from unity. This can also be seen in Fig. 2 which plots as a function of . Each data point represents a compound and together they constitute a cloud around a straight line representing . Below, we consider different families of compounds represented in table I.
Heavy Fermions: In all Ce-based compounds listed in the table, the ratio remains close to unity. As extends over two orders of magnitude from CeSn3 to CeCu6, this correlation between specific heat and thermopower is indeed remarkable. Note that the sign of thermopower is positive for all Ce-based compounds. On the other hand, the thermopower of Yb compounds which often display a clearly linear temperature-dependence in a reasonable temperature window is negative. In all cases the magnitude of a yields .
The table also includes CeNiSn, a so-called “Kondo insulator”. Given the extremely low carrier density of the system, the very large magnitude of () is not a surprise. The Hall data suggests a carrier density of 0.01 at 5K and still lower below[34]. The magnitude of is in good agreement with this estimation.
The situation is different for the U-based compounds. An early study of UPt3 did not detect a finite at sub-Kelvin temperatures[35]. [The magnitude of above Tc yields ]. In UBe13 thermopower changes strongly with magnetic field. The largest field applied (7.5T) in the only reported study[36] was not enough to destroy superconductivity. Taking the value of in presence of such a field at T0.8K yields a . For the other U-based compounds of the list, no data is available for low temperatures and in presence of a magnetic field needed to destroy superconductivity. In the T=0 limit, the magnitude (and the sign) of in UPd2Al3 and UNi2Al3 could be somewhat different from what is given in table I which gives the zero-temperature extrapolation of the data reported for [37]. In the case of URu2Si2[38] there is a simple reason for expecting a much larger than unity. Indeed, both Hall effect measurements[39] and band calculations[40] indicate that the carrier density at low temperatures is very small (about 0.05 -atom). Thus the apparently large ( 4.5) is a consequence of an enhanced conversion factor between and . In fact, given such a small carrier density in URu2Si2, a as large as twenty and sensibly larger than what is given in the table is expected. Clearly, a fresh look at the thermopower of U-based compounds in the subkelvin regime would be very useful. Even at this stage, however, the problem of the 4-electron localisation in uranium compounds appears to be more complex than in the case of Ce and Yb compounds. Notably the sign of the thermopower is strikingly different among different compounds.
Organic superconductors: Few studies of thermoelectricity in organic superconductors are available. The table indicates data found in literature for two members of the -(BEDT-TTF)2X family of quasi-two-dimensional superconductors. While is roughly the same in -(BEDT-TTF)2Cu(NSC)2 and in -(BEDT-TTF)2Cu[N(CN)2]Br, two different groups report sensibly different values of thermopower at the onset of superconductivity for each compound[41, 42]. In neither case is purely linear at this temperature. The reported results point to a in the 0.6 - 1.7 range. Note that the in-plane thermopower of these compounds is anisotropic and the values of the table correspond to the [larger] negative ones attributed to the carriers associated with the quasi-one-dimensional sheet of the Fermi surface[43]. Determination of the magnitude of the low-temperature in the metallic state of the Bechgaard salts (the (TMTSF)2X family) would be very useful for the purpose of this investigation. The zero-temperature thermoelectricity of organic conductors with their simple and well-defined Fermi surfaces appears to be largely unexplored.
Metallic oxides: The table includes a number of metallic oxides known to be remarkable Fermi liquids. The thermopower of Sr2RuO4 has been studied down to 4.2 K[44]. It displays an almost linear temperature dependence over an extended temperature range. Taking the value of at 4.2K yields . We did not find any report on the thermoelectricity of two other ruthenate compounds displaying a comparable mass enhancement in their specific heat. It is interesting to observe that available data for thermopower[45] and specific heat[46] of the recently-discovered cobaltite compound (NaxCoO2) points also to a close to unity. Ando et al.[46] have already made a qualitative link between the giant thermopower and the enhanced specific heat in this case.
Let us underline the interesting case of the heavily overdoped cuprate La1.7Sr0.3CuO4. At this doping level, superconductivity is completely absent and resistivity displays a purely T2 temperature as expected for a Fermi liquid[6]. Now, a study of thermopower in La2-xSrxCuO4 reports that for x=0.3, in contrast with lower doping levels, thermopower becomes almost linear below 20K with [47]. This, combined with [6], yields . The result is far from anomalous and is to be compared with 3.3 which is the expected value of for a system with a carrier density of 0.3 per unit cell. Interestingly, a linear term, slightly larger and with an opposite sign, can be extracted from the data reported for overdoped Bi-2201 at a comparable doping level (=0.29). Future studies on single crystals would be very useful to refine the issue. An intensive debate on thermopower of the cuprates has focused on the influence of the doping level on the magnitude of Seebeck coefficient at high temperatures[49].
Common metals: The extraction of an intrinsic linear thermopower is particularly difficult in simple elemental metals. This is due to the small magnitude of thermopower at low temperatures and its sensitivity to the presence of a small concentration of impurities. We have found compelling data for very pure Cu[50] and for hydrogen-free Pd[16]. The value of has been taken at the lowest reported temperature (1.5-2K) which is below the last low-temperature structure in . Interestingly, constantan, a Cu-Ni alloy widely used as a thermocouple presents a linear up to room temperature. Taking this quasi-constant and yields a close to -1. It is tempting to attribute the absence of any detectable phonon drag in this alloy to presence of strong disorder which kills electron-phonon coupling. Finally, we have also included the data from a recent study on the Charge-Density-Wave compound NbSe2[51] which present a positive thermopower and .
6 Discussion and unanswered questions
The principal observation reported in this paper is presented in Fig.2. Most of the systems considered lie close to the two lines representing . Moreover, in many other cases which appear not to follow this general trend, the number of carriers per formula unit gives a satisfactory explanation for the magnitude of .
Let us stress that, in spite of its conformity to the free-electron-gas picture, this observation does not lie on a solid understanding of microscopic properties. Many of the systems considered here have notoriously complicated Fermi surfaces. In a naive multi-band picture, the contribution of hole-like and electron-like carriers would cancel out and lead to a more or less homogenous distribution of points between the two lines. Clearly, this is not the case.
One may invoke an inherent asymmetry of mass renormalization between electrons and holes in each system. Take the case of cerium and ytterbium compounds. In Ce compounds, the occupancy of f-level orbital is expected to lead to the formation of a narrow band which has a curvature opposite to the one formed in Yb compounds. Now, it is a tiny vacancy () in the 4 content (n) of the 4 shell which is responsible of the Kondo dressing and of the positive sign of the thermoelectric power in Ce compounds. In the Yb case, on the other hand, the excess in the 4 content (respective to the trivalent state Yb+3) leads to the negative sign of . Note that such an explanation is quite different from the one resulting from the extension of the Mott formula which also correctly predicts the positive (negative) sign of thermopower for Ce(Yb) compounds. According to the latter, the sign of the thermopower is determined by since it affects the energy dependence of the scattering rate of the light electrons. In other words, the sign of is imposed by the first term of Eq.3 and not the second which prevails in the simple free-electron-gas picture. Clearly, a rigorous theoretical investigation of this issue is required.
Let us also note that within the current resolution, the experimental data presented in Fig.2 does not allow to detect any deviation from the general tendency for different families of correlated-electron systems. This is also remarkable, since large deviations from the KW value (from in several Yb compounds[3] to in NaxCoO2[7] have been reported. This may not be as surprising as it appears. There is a fundamental difference between the KW ratio and . While the former compares the size of inelastic electron-electron scattering with the density of states at Fermi energy, the latter is a ratio of two zero-energy properties of the system. In this regard, it is more akin to the Wilson ratio. However, contrary to the latter, it should mirror those anomalous transport properties which affect the energy-dependence of the scattering rate.
Finally, we should mention that the observation reported here can be used as a tool for tracking non-trivial physics associated to an anomalous value of at very low (yet finite) temperature. This is the case of several HF superconductors such as CeCoIn5, UBe13 and CeCu2Si2 at the onset of superconductivity.
7 Acknowledgements
We thank R. Bel and H. Aubin for stimulating discussions.
References
References
- [1] K. Kadowaki and S. B. Woods, Solid State comm, 58, 507 (1986)
- [2] K. Miyake, T. Matsuura and C. Varma, Solid State comm, 71, 507 (1989)
- [3] N. Tsujii, K. Yoshimura and K. Kosuge, J. Phys.: Condens. Matter 15, 1993(2003)
- [4] Y. Maeno, K. Yoshida, H. Hashimoto, S. Nishizaki, S. Ikeda, M. Nohara, T. Fujita, A. P. Mackenzie, N. E. Hussey, J. G. Bednorz and F. Lichtenberg, J. Phys. Soc. Japan 66, 1405 (1997)
- [5] C. Urano, M. Nohara, S. Kondo, F. Sakai, H. Takagi, T. Shiraki and T. Okubo, , Phys. Rev. Lett. 85, 1052 (2000)
- [6] S. Nakamae, K. Behnia, N. Mangkorntong, M. Nohara, H. Takagi, S. J. C. Yates and N. E. Hussey , Phys. Rev. B 68, R100502 (2003)
- [7] S. Y. Li, L. Taillefer, D. G. Hawthorn, M. A. Tanatar, J. Paglione, M. Sutherland, R. W. Hill, C. H. Wang and X. H. Chen, cond-mat/0401099 (2004)
- [8] K. E. Wilson, Rev. Mod. Phys. 47, 773 (1975)
- [9] K. Yamada, Prog. Theor. Phys. 53, 970 (1975)
- [10] P. A. Lee, T. M. Rice, J. W. Serene, L. J. Sham, and J. W. Wilkins, Comm. Cond. Matt.12, 99 (1986)
- [11] N. W. Ashcroft and N. D. Mermin, Solid state Physics, Saunders College Publishing (1976)
- [12] J. M. Ziman, Principles of the theory of Solids, Cambridge University Press, Cambridge (1972)
- [13] A. A. Abrikosov, Fundamentals of the theory of metals, North-Holland, Amsterdam (1988)
- [14] R. D. Barnard, Thermoelectricity in Metals and Alloys, Taylor & Francis, London (1972)
- [15] D.A. Millis and P.A. Lee, Phys. Rev. B 35, 3394 (1987)
- [16] R. Fletcher, N. S. Ho and F. D. Manchester, J. Phys. C: Solid State Phys. 3 S59 (1970)
- [17] N. F. Mott, Proc. Roy. Soc. 47, 571 (1935)
- [18] L. Colquitt et al., Phys. Rev. B 4, 292 (1971)
- [19] J. Flouquet, to be published in Prog. Low Temp. Phys., P. W. Halperin (ed), Elsevier 2004
- [20] D. Jaccard , J. Sierro, in Valence Instabilities, P. Wachter and H. Boppart (eds.), North-Holland, 409 (1982)
- [21] N. F. Mott, in Valence Instabilities, P. Wachter and H. Boppart (eds.), North-Holland, 402 (1982)
- [22] D. Jaccard, J. M. Mignot, B. Bellarbi, A. Benoit, H. F. Braun and J. Sierro, J. Magn. Magn. Mater. 47&48, 23 (1985)
- [23] C. Fierz, D. Jaccard, J. Sierro and J. Flouquet, J. Appl. Phys. 63, 3899 (1988)
- [24] D. Jaccard, K. Behnia and J. Sierro, Phys. Lett. A 163, 475 (1992)
- [25] P. Link, D. Jaccard and P.Lejay, Physica B 225, 45 (1996)
- [26] N. E. Bickers, D. L. Cox, and J. W. Wilkins, Phys. Rev. Lett. 54, 230(1985)
- [27] D.M. Newns and N. Read, Advances in Physics 36, 799-849 (1987)
- [28] A. Houghton, N. Read and H. Won, Phys. Rev. B 35, 5123 (1987)
- [29] V. Zlatić, B. Horvatić, I. Milat, B. Coqblin, G. Czycholl and C. Grenzebach, Phys. Rev. B 68, 104432 (2003)
- [30] G. Sparn, W. Lieka, U. Gottwick, F. Steglich and N. Grewe, J. Magn. Magn. Mater. 47&48, 521 (1985)
- [31] A. Amato, D. Jaccard, J. Sierro, F. Lapierre, P. Haen, P. Lejay and J. Flouquet, J. Magn. Magn. Mater. 76&77, 263 (1988)
- [32] D. Jaccard and J. Flouquet, J. Magn. Magn. Mater. 47&48, 45 (1985)
- [33] H. Sato, J. Zhao, W.P. Pratt, Y. Onuki and T. Komatsubara, Phys. Rev. B 36, 8841 (1987)
- [34] Takabatake F. Iga, T. Yoshino, Y. Echizen, K. Kobayashi, M. Higa, K. Katoh, N. Shimizu, Y. Bando, G. Nakamoto, H. Fujii, K. Izawa, T. Suzuki, T. Fujita, M. Sera, M. Hiroi, K. Maezawa, S. Mock, H. v. Löneysen, A. Bückl, K. Neumaier, and K. Andres, J. Magn. Magn. Mater. 177&181, 277 (1998)
- [35] A. Sulpice, P. Gandit, J. Chaussy, J. Flouquet, D. Jaccard, P. Lejay and J. L. Tholence, J. Low Temp. Phys. 62, 39 (1986)
- [36] D. Jaccard, J. Flouquet, Z. Fisk, J. L. Smith and H. R. Ott, J. Phys. Lett. 46 L-811 (1985)
- [37] A. Grauel, D. Fromm, C. Geibel, F. Steglich, N. Sato and T. Komatsubara, Int. Jour of Mod. Phys. B 7, 50 (1993)
- [38] J. Sakurai, K. Hasegawa, A. A. Menovsky and J. Schweizer, Solid State Commun. 97, 689 (1988)
- [39] J. Schoenes, C. Schoneneberger, J. J. M. Franse and A. A. Menovsky, Phys. Rev. B 35, 5375 (1987)
- [40] H. Yamagami and, N. Hamada, Physica B 284&288, 1295 (2000)
- [41] R. C. Yu, J. M. Williams, H. H. Wang, J. E. Thompson, A. M. Kini, K. D. Carlson, J. Ren, M. H. Whangbo and P. M. Chaikin, Phys. Rev. B 44, 6932 (1991)
- [42] T. Sasaki, H. Ozawa, M. Koakutsu and T. Fukase, Synthetic Metals 103, 1944 (1993)
- [43] T. Mori and H. Inokuchi, J. Phys. Soc. Japan 57, 3674 (1988)
- [44] H. Yoshino, K. Murata, N. Shirakawa, Y. Nishihara, Y. Maeno,T. Fujita, J. Phys. Soc. Japan 65, 1548 (1996)
- [45] I. Terasaki, Y. Sasago and K. Uchinokura, Phys. Rev. B 56, R12685 (1997)
- [46] Y. Ando, N. Miyamoto, K. Segawa, T. Kawata and I. Terasaki Phys. Rev. B 60, 10580 (1999)
- [47] M. V. Elizarova and V. E. Gasumyants, Phys. Rev. B 62, 5989 (2000)
- [48] Z. Konstantinovic, G. Le Bras, A. Forget, D. Colson, F. Jean, G. Collin, M. Ocio and C. Ayache, Phys. Rev. B 66, 020503 (2002)
- [49] S. D. Obertelli, J. R. Cooper and J. L. Tallon, Phys. Rev. B 46, 14928 (1992)
- [50] E. R. Rumbo, J. Phys. F: Metal Phys. 6 85 (1976)
- [51] R. Bel, K. Behnia and H. Berger, Phys. Rev. Lett. 91, 066602 (2003)
- [52] C. D. Bredl, S. Horn, F. Steglich, B. Lüthi and R. M. Martin Phys. Rev. Lett. 52, 1982 (1984)
- [53] H. v. Löhneysen, T. Pietrus, G. Portisch, H. G.. Schlager, A. Schr der, M. Sieck, and T. Trappmann, Phys. Rev. Lett. 72,3262 (1994)
- [54] A. Lacerda, A. de Visser, P. Haen, P. Lejay, and J. Flouquet, Phys. Rev. B 40, 8759(1989)
- [55] R. Bel, K. Behnia, Y. Nakajima, K. Izawa, Y. Matsuda, H.. Shishido, R. Settai and Y. Onuki, cond-mat/0311473 (2003)
- [56] A. Bianchi, R. Movshovich, I. Vekhter, P. G. Pagliuso, and J. L. Sarrao, Phys. Rev. Lett. 91, 257001 (2003)
- [57] A. K. Bhattacharjee, B. Coqblin, M. Raki, L. Forro, C. Ayache and D. Schmitt, J. Phys. (France) 50, 2781 (1989)
- [58] C. Ayache, J. Beille, E. Bonjour, R. Calemczuk, G. Creuzet, D. Gignoux, A. Najib, D. Schmitt, J. Voiron and M. Zerguine, J. Magn. Magn. Mater. 63&64, 329 (1987)
- [59] J. Sakurai, H. Kamimura and Y. Komura, J. Magn. Magn. Mater. 76&77, 287 (1988)
- [60] K. Ikeda and A. A. Gschneidner, Jr., Phys. Rev. B 25, 4623 (1982)
- [61] A. Hiess, C. Geibel, G. Sparn, C. D. Bredl, F. Steglich, T. Takabatake and H. Fujii, Physica B 199&299, 437 (1994)
- [62] K. Izawa, T. Suzuki, T. Fujita, T. Takabatake, G. Nakamoto and H. Fujii K. Maezawa, Phys. Rev. B 59, 2599 (1999)
- [63] L. Spendeler, D. Jaccard, J. Sierro, M. Fran ois, A. Stepanov and J. Voiron, J. Low Temp. Phys. 94, 585 (1994)
- [64] A. Amato, R. A. Fisher, N. E. Phillips, D. Jaccard, E. Walker and Physica B, 165&166, 389 (1990)
- [65] D. Jaccard, J. Flouquet and J. Sierro, J. Appl. Physics 57, 3084 (1985)
- [66] R. Pott, R. Schefzyk, D. Wohlleben, and A. Junod, Z. Phys. B 44 , 17 (1981)
- [67] R. Casanova, D. Jaccard, C. Marceneat, N. Hamdaoui and M. J. Besmus, J. Magn. Magn. Mater. 90&91, 587 (1990)
- [68] E. Bauer, Adv. Phys. 40, 417 (1991)
- [69] K. Alami-Yadri, D. Jaccard and D. Andreica, J. Low Temp. Phys. 114, 135(1999)
- [70] B. C. Sales et al., J. Low Temp. Phys. 23, 449 (1976)
- [71] U. Walter, E. Holland Moritz and Z. Fisk, Phys. Rev.. B 43, 320 (1991)
- [72] M. J. Besnus et al., J. Less Common Metals 120, 101 (1986)
- [73] M. J. Graf, N. A. Fortune and J. S. Brooks, J. L. Smith and Z. Fisk, Phys. Rev. B 40, 9358 (1989)
- [74] C. Geibel, S. Thies, D. Kaczorowski,A. Mehner,A. Grauel,B. Seidel, U. Ahlheim, R. Helfreich,K. Petersen, C. D. Bredl and F. Steglich, Z. Phys. B 83 305 (1991)
- [75] C. Geibel, C. Schank, S. Thies, H. Kitazawa, C. D. Bredl,A. Böhm, M. Rau, A. Grauel,R. Caspary,R. Helfreich,U. Ahlheim,G. Weber and F. Steglich, Z. Phys. B 84 1 (1991)
- [76] M. B. Maple, J. W. Chen, Y. Dalichaouch, T. Kohara, C. Rossel, and M. S. Torikachvili, M. W. McElfresh and J. D. Thompson, Phys. Rev. Lett. 56, 185 (1986)
- [77] B. Andraka, C. S. Jee, J. S. Kim and G. R. Stewart, K. D. Carlson, H. H. Wang, A. V. S. Crouch, A. M. Kini and J. M. Williams, Solid State Commun. 79, 57 (1991)
- [78] B. Andraka, J. S. Kim, G. R. Stewart, K. D. Carlson, H. H. Wang, and J. M. Williams, Phys. Rev. B 40, 11 345 (1989)
- [79] P. Garoche, R. Brusetti and K. Bechgaard, Phys. Rev. Lett. 49, 1346 (1982)
- [80] P. B. Allen, H. Berger, O. Chauvet, L. Forro, T. Jarlborg, A. Junod, B. Revaz, and G. Santi, Phys. Rev. B 53, 4393 (1996)
- [81] R. S. Perry, L. M. Galvin, S. A. Grigera, L. Capogna, A. J. Schofield, A. P. Mackenzie, M. Chiao, S. R. Julian, S. I. Ikeda, S. Nakatsuji, Y. Maeno and C. Pfleiderer Phys. Rev. Lett. 86, 2661 (2001)
- [82] K. Yamaura, Q. Huang, D. P. Young, Y. Noguchi, and E. Takayama-Muromachi, Phys. Rev. B 66, 134431 (2002)
- [83] K. Yamaura and E. Takayama-Muromachi, Phys. Rev. B 64, 224424 (2001)
- [84] H. Mayama, Y. Okajima, and K. Yamaya, Phys. Rev. B 57, 14470-14475 (1998)
- [85] D. Sanchez, A. Junod, J. Muller, H. Berger and F. Lévy, Physica B 204, 167 (1995)
- [86] U Mizutani, T B Massalski, J Bevk and R R Vandervoort, J. Phys. F: Met. Phys. 7 L63 (1977)
- [87] C. Ho James, H. R. O’Neal and N. E. Phillips, Rev. Sci. Instrument 34 (1963) 782