Orbital Freezing in FeCr2S4 Studied by Dielectric Spectroscopy
Abstract
Broadband dielectric spectroscopy has been performed on single-crystalline FeCr2S4 revealing a transition into a low-temperature orbital glass phase and on polycrystalline FeCr2S4 where long-range orbital order is established via a cooperative Jahn-Teller transition. The freezing of the orbital moments is revealed by a clear relaxational behavior of the dielectric permittivity, which allows a unique characterization of the orbital glass transition. The orbital relaxation dynamics continuously slows down over six decades in time, before at the lowest temperatures the glass transition becomes suppressed by quantum tunneling.
pacs:
77.22.Gm, 71.70.Ej, 64.70.PfThe cooperative and continuous freezing of translational and orientational degrees of freedom into a highly degenerate glassy state is one of the most fascinating phenomena in condensed matter physics and far from being really understood Angell . Although canonical glass-forming materials and supercooled liquids have been in the focus of scientific interest for about 200 years, only in recent years the glassy dynamics has been investigated in systems having perfect long-range translational order but being disordered with respect to the orientational degrees of freedom. Most prominent among those are spin glasses (SGs), featuring diluted magnetic moments on a regular lattice. Disorder-derived frustration suppresses any long-range magnetic order and the moments cooperatively freeze into a glassy low-temperature state Bind86 . Frustration in SGs results from the joint effect of substitutional disorder and interactions that change sign as a function of distance or bonding angle. Substitutional Mn ions in Cu is a prototypical example. Glassy dynamics, can also be found in a broad class of materials, including disordered ferroelectrics, diluted molecular crystals, or ortho-para hydrogen mixtures, which usually are termed orientational glasses (OGs) Hoech90 ; Reger . In OGs electric dipoles, elastic quadrupoles, or even higher multipolar degrees of freedom cooperatively freeze-in devoid of long-range orientational order. Both, SGs and OGs are dominated by disorder-derived frustration and exhibit a cooperative freezing of diluted moments on a regular lattice.
Yet there exists another class of systems with frozen-in moments. Namely geometrical frustration can establish complex ground states with a large residual entropy, a problem that has been tackled almost 50 years ago by Anderson Ande56 in treating the magnetism of B-site spinel compounds. Geometrical frustration arises if certain regular but specific arrays of interacting moments can not satisfy all pair-wise interactions Ram01 . Ising spins on a triangular lattice may serve as an illuminating example. Spin ice, with a ground state derived from magnetic moments located on a pyrochlore lattice, with ferromagnetic interactions and a strong Ising-like anisotropy, is another geometrically frustrated system, which recently gained considerable interest RamNat . Geometrical frustration has been investigated in detail in the spin sector, resulting in most cases in complex non-collinear spin structures or in spin-glass behavior Ram01 . However, there exist recent experimental reports on geometrical frustration also of the orbital moments Frit04 ; Tsur04 . And while for FeSc2S4 the authors of Frit04 propose a spin-orbital liquid, an orbital glass has been detected in ferrimagnetic FeCr2S4 Tsur04 . The possibility of orbital-glass (Jahn-Teller glass) formation has been outlined long ago by Mehran and Stevens Mehr83 , and the fact that orbital freezing can be detected by dielectric spectroscopy has been demonstrated by Babinskii et al. Bab93 .
In canonical glass formers, dielectric spectroscopy has proven a key technique for the investigation of glassy dynamics. Especially, the exceptionally broad time/frequency window, accessible with this method, makes it an ideal tool to follow the many-decade change of molecular kinetics at the glass transition Lunk00 . Here we show, that, as in FeCr2S4 the elastic response of the ionic lattice is coupled to the orbital reorientations via electron-phonon interaction, dielectric spectroscopy also reveals valuable information on the orbital freezing process. We provide a detailed dielectric investigation of the orbital dynamics in single-crystalline FeCr2S4 and compare it to results on polycrystalline material, which undergoes a cooperative Jahn-Teller (JT) transition below 10 K. The slowing down of the mean relaxation time, the distribution of relaxation times, and the temperature dependence of the relaxation strength are derived.
FeCr2S4 crystallizes in the normal cubic spinel structure Frit04 . The Cr3+ sublattice (, spin ) is dominated by ferromagnetic exchange. The Fe2+ ions (, ) are only weakly coupled within the Fe-sublattice, but much stronger to the Cr ions. Hence FeCr2S4 reveals ferrimagnetic spin order below K vStap82 . The orbital moment of the octahedrally coordinated Cr3+ ions is quenched. Fe2+ is tetrahedrally coordinated by the sulfur ions; its lower e-doublet is occupied by three electrons and hence is JT active. And indeed, in Mössbauer experiments on polycrystalline samples, an abrupt change of the electric-field gradient below 10 K was attributed to a transition from a dynamic to a static JT distortion, establishing an orbitally ordered ground state Spen72 . In addition a -type anomaly of the specific heat at 9.25 K was registered in Fe-deficient samples Lotg72 . Recently it has been demonstrated that pure single crystals reveal a transition into an orbital glass state, while polycrystalline materials reveal long-range orbital order Tsur04 .
Sample preparation and subsequent heat treatments of the poly- (PC) and single-crystal (SC) samples are described in ref. Tsur04 . The same SC and PC batches were investigated in the present work. To characterize the samples, we measured the magnetization in a commercial MPMS-5 SQUID magnetometer (Quantum Design) and the thermal expansion in a home-built system utilizing a 4He cryostat. For the dielectric measurements silver paint contacts were applied to the plate-like samples forming a parallel-plate capacitor. The conductivity and permittivity were measured over a broad frequency range of 9 decades () at temperatures down to 1.4 K. A frequency response analyzer (Novocontrol -analyzer) was used for frequencies MHz and a reflectometric technique employing an impedance analyzer (Agilent E 4291A) at MHz Schn01 .
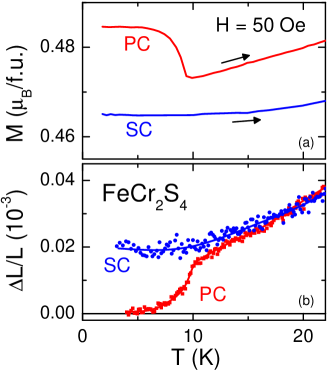
Figure 1(a) shows the field-cooled magnetization of the PC and SC, measured in an external magnetic field of 50 Oe. Only the PC reveals a upward jump of just below 10 K, indicative for a structural phase transition, while the SC shows only a smooth temperature dependence. Also the thermal expansion [Fig. 1(b)] provides evidence for a structural phase transition only in the PC. These results are in accord with the heat capacity results of Tsurkan et al. Tsur04 , which reveal a Jahn-Teller transition at 9.2 K in the PCs, but a clear indication of an orbital-glass transition in the SC. It is thought that geometrical frustration dominates only in ideal stoichiometric samples, but is partially broken by marginal disorder, allowing for a cooperative phase transition restoring orbital order. Such an order by disorder scenario has been treated nearly 25 years ago by J. Villain Vill80 .
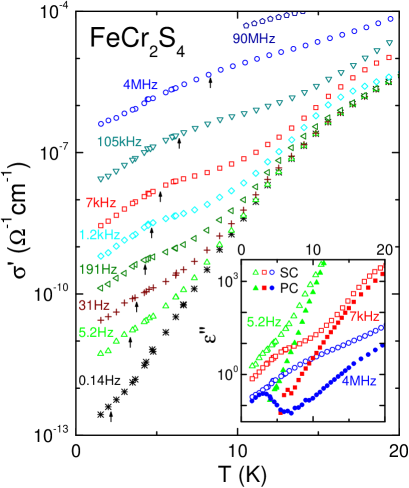
Figure 2 shows the conductivity of SC FeCr2S4 for various frequencies at temperatures below 20 K. The behavior is dominated by charge transport, namely a dc contribution, approximately represented by the 0.14 Hz curve, and an ac contribution increasing with frequency, which has a weaker temperature dependence and can be ascribed to hopping transport of localized charge carriers Elli87 . However, as indicated by the arrows, superimposed to these contributions there is a significant shoulder, indicating an underlying peak that shifts towards lower temperatures with decreasing frequency. Having in mind that , this corresponds to a peak in the dielectric loss , too. Thus, Fig. 1 reveals the typical signature of relaxational behavior as commonly observed e.g. for the glassy freezing of dipolar molecules Hoech90 ; Lunk00 . In Tsur04 evidence for a glassy freezing of the orbital dynamics was deduced from specific heat measurements, displaying a cusp-like peak in vs. at about 5 K. Thus it is reasonable that the relaxational feature in , occurring in just the same temperature region, mirrors the glass-like slowing down of orbital dynamics. Further evidence arises from a comparison to the results on the PC sample (inset of Fig. 2), where the orbital degrees of freedom are ordered at low temperatures Tsur04 . As expected, the relaxation feature is absent in the PC, being more than one decade smaller at the peak temperature of the corresponding SC curve. In the PC, at the highest frequency a small peak shows up at about 3 K, which, however, is located at a significantly smaller temperature compared with the shoulder observed at the same in the SC. It also has a much smaller amplitude than the shoulder observed at 5.2 Hz in the SC, which is located at approximately the same temperature, and thus its relaxational strength (corrected for the usual Curie-like behavior ) is nearly two decades smaller than for the SC. We assume that defect centers in grain boundaries of the Jahn-Teller ordered PC still undergo orbital reorientations. From the relaxation strength we estimate this fraction of non-ordered arrays to be of the order of 1%.
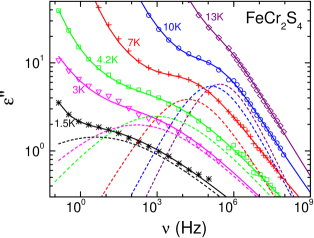
In the frequency-dependent plot of Fig. 3, the loss peaks characterizing the orbital relaxation are analyzed in more detail. The solid lines represent fits with the sum of a Cole-Cole (CC) function Cole41 , often employed to describe loss peaks in canonical and OGs, and a conductivity contribution, , leading to a divergence of towards low . The latter is composed of a dc component and an ac power-law contribution with exponent , representing the so-called ”universal dielectric response” (UDR) Jons83 . For semiconducting systems, the UDR is the signature of hopping conduction of Anderson-localized charge carriers and explained within various theoretical approaches Elli87 . Good agreement of fits and experimental spectra could be achieved in this way, the dashed lines showing the relaxational part of the fits. Judging these results, one should bear in mind their rather high uncertainty, due to a partial correlation of the fit parameters. Whatsoever, as can be deduced even from the raw data, the loss peaks must be broader than for the Debye case, corresponding to a single relaxation time. Thus the relaxation in FeCr2S4 shows the typical broadening of glassy systems, commonly ascribed to a heterogeneous distribution of relaxation times. With decreasing temperature the loss peak broadens significantly, while its amplitude decreases. Such a narrowing of a CC-like loss peak is commonly observed in OGs. It can be explained assuming a temperature-independent Gaussian distribution of energy barriers, leading to loss peaks whose widths increase like 1/T gauss .
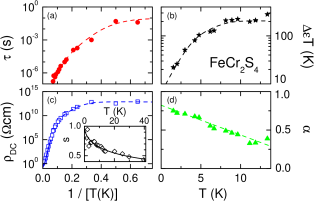
In Fig. 4 the temperature dependences of the main fit parameters are given. The relaxation time characterizing the reorientational dynamics of the orbitals [Fig. 4(a)], shows a smooth variation over many decades, which is typical for glassy freezing. However, in contrast to most other glassy systems, its temperature dependence becomes weaker for low temperatures. In the Arrhenius-representation, vs. , a purely thermally activated process corresponds to a straight line, while tunneling would yield a nearly constant . Obviously Fig. 4(a) represents a smooth transition from a thermally activated ( K) to a purely tunneling type ( K) of reorientation. That indeed quantum fluctuations can suppress the glass transition has been demonstrated theoretically for a proton glass Dobr87 . In Fig. 4(b), the relaxation strength multiplied by temperature is plotted. For K, is constant, which indicates that approximately follows a Curie-type behavior, characteristic for non-interacting orbitals. Below about 5 K starts to decrease on decreasing temperature signaling a static freezing of a significant fraction of reorienting orbitals, which are then lost for the relaxation process. It indicates a type of smeared-out phase transition with a certain number of orbitals fixed in random orientations while the remaining ones undergo a reorientational motion via tunneling processes. From Fig. 4 important differences of the orbital relaxation dynamics can be derived when compared to canonical glass formers. In supercooled liquids, the slowing down of the reorientational motion is stronger than an Arrhenius law and the relaxation peaks are significantly asymmetric. However, in FeCr2S4 the orbital motion slows down even weaker than Arrhenius because quantum tunneling suppresses conventional freezing. Fig. 4(d) shows the width parameter of the CC function ( corresponds to symmetrically broadened peaks, compared to Debye behavior with ). increases linearly with decreasing temperature, which simply reflects the fact that the relaxational motion is dominated by a Gaussian distribution of energy barriers gauss . Based on a linear extrapolation of in Fig. 4(d), the relaxation is monodispersive and Debye-like for temperatures K and the distribution of relaxation times is almost infinitely broad towards K. Based on Fig. 4(b) one has to bear in mind that a significant fraction of orbitals no longer takes part in the relaxational process due to cooperative static freezing. This quenched disorder, resulting from frozen-in orbitals and local strain-fields, yields locally varying energy barriers and a symmetric and broad distribution of relaxation times.
In Fig. 4(c) the dc resistivity as deduced from the fits is given. It agrees perfectly with the results of a four-point dc-measurement (solid line), performed at K. At K), behaves thermally activated with an energy barrier of about 23 meV. At lower temperatures, the temperature dependence of becomes successively weaker, being nearly constant for K, indicating charge transport via tunneling. The inset of Fig. 4(c) shows the power law exponent of the hopping-dominated ac conductivity. It increases approaching unity for low temperatures and can be described within a model for hopping transport via polaron tunneling (solid line) Elli87 . Thus there is evidence for tunneling-dominated dynamics for both, the reorientational motion of the orbitals and the charge transfer from site to site. Interestingly, the tunneling regime seems to be identical for and and the curves of Figs. 4(a) and (c) can be scaled to nearly perfectly match each other. We interpret this finding assuming that both, the reorientation of the electronic charge distribution and the hopping of electrons from site to site, via strong electron-phonon coupling are accompanied by the same kind of structural rearrangement, which determines the temperature evolution of the corresponding quantities. For the charge transport this is corroborated by the indication of polaronic charge carriers deduced from .
In conclusion, by dielectric spectroscopy at low temperatures, we achieved a thorough characterization of the glassy freezing of the orbital degrees of freedom in FeCr2S4. In contrast to most glassy materials, this low-temperature state is not established via randomness, but most probably is governed by geometrical frustration. We find typical glassy behavior, in particular a continuous slowing down of the orbital dynamics and a distribution of relaxation times, which almost diverges for K. Based on the temperature dependence of , a large fraction of orbitals undergoes a static freezing, while for the remaining entities a conventional freezing-in is suppressed by quantum-mechanical tunneling, limiting the low-temperature relaxation time to s. The low-temperature charge transport in FeCr2S4 is dominated by tunneling of polaronic charge carriers.
This work was supported by the Deutsche Forschungsgemeinschaft via the Sonderforschungsbereich 484 and partly by the BMBF via VDI/EKM, FKZ 13N6917.
References
- (1) C. A. Angell et al., J. Appl. Phys. 88, 3113 (2000); D. Ediger, C. A. Angell, and S. R. Nagel, J. Phys. Chem. 100, 13200 (1996).
- (2) K. Binder and A. P. Young, Rev. Mod. Phys. 58, 801 (1986).
- (3) U. T. Höchli, K. Knorr, and A. Loidl, Adv. Phys. 39, 405 (1990).
- (4) K. Binder and J. D. Reger, Adv. Phys. 41, 547 (1992).
- (5) P. W. Anderson, Phys. Rev. 102, 1008 (1956).
- (6) A. P. Ramirez, in Handbook of Magnetic Materials, edited by K. H. J. Buschow (Elsevier, Amsterdam, 2001), Vol. 13, p. 423.
- (7) A. P. Ramirez et al., Nature 399, 333 (1999).
- (8) V. Fritsch et al., Phys. Rev. Lett. 92, 116401 (2004).
- (9) V. Tsurkan et al., Phys. Rev. Lett. (2004), submitted.
- (10) F. Mehran and K. W. H. Stevens, Phys. Rev. B 27, 2899 (1983).
- (11) A. V. Babinskii et al., JETP Lett. 57, 299 (1993).
- (12) P. Lunkenheimer et al., Contemp. Phys. 41, 15 (2000).
- (13) R. P. van Stapele, in Ferromagnetic Materials, edited by E. P. Wohlfarth (North Holland Publishing, Amsterdam, 1982) Vol. 3, p. 606.
- (14) M. R. Spender and A. H. Morrish, Solid State Commun. 11, 1417 (1972).
- (15) F. K. Lotgering, A. M. van Diepen, and J. F. Olijhoek, Solid State Commun. 17, 1149 (1975).
- (16) U. Schneider et al., Ferroelectrics 249, 89 (2001).
- (17) J. Villain, R. Bidoux, J.-P. Corton, and R. Conte, J. Physique 41, 1263 (1980).
- (18) S. R. Elliott, Adv. Phys. 36, 135 (1987).
- (19) K. S. Cole and R.H. Cole, J. Chem. Phys. 9, 341 (1941).
- (20) A. K. Jonscher, Nature 267, 673 (1977).
- (21) V. Dobrosavljević and R. M. Stratt, Phys. Rev. B 36, 8484 (1987).
- (22) N. Birge et al., Phys. Rev. B 30, 2306 (1984).