3-D mapping of diffuse scattering in Pb(Zn1/3Nb2/3)O3-PbTiO3
Abstract
High energy (67 keV) x-ray diffuse scattering measurements were performed on single crystals of Pb(Zn1/3Nb2/3)O3-PbTiO3 (PZN-PT). A novel technique was developed to map out the diffuse scattering distribution in all three dimensions around a large number of Bragg peaks simultaneously, taking advantage of the almost flat Ewald sphere of the high energy x-ray beam. For , and , the results are very similar, indicating same type of correlations of polarizations in these compounds. Our results show that the diffuse scattering intensity consists of six rod-type intensities around reciprocal lattice points. A simple model is suggested where {110} type planar correlations of the in-plane type polarizations in real space contribute to the rod-type diffuse intensities in the reciprocal space. The planar correlations of polarizations are likely a result from condensations of soft polarized optic phonon modes.
pacs:
77.80.-e, 77.84.Dy, 61.10.NzI Introduction
Relaxors are a special class of ferroelectrics whose dielectric properties show diffusive and strongly frequency dependent phase transitions. Pb(Zn1/3Nb2/3)O3 (PZN) is one of the prototype relaxors, which has attracted much attention due to its high piezoelectric properties when doped with PbTiO3 (PT) Park and Shrout (1997); Kuwata et al. (1982, 1981). One unique property about relaxors is the appearing of local polarized nano-sized regions at the Burns temperature , which is a few hundred degrees above the Curie temperature . This was first suggested by Burns and Dacol Burns and Dacol (1983) in interpreting their measurements on the optical index of several relaxor systems, including PZN and one of its close analog, Pb(Mg1/3Nb2/3)O3 (PMN).
The PNR was then extensively studied by diffuse scattering measurements. It was found that in PMN, the diffuse scattering starts to appear at around K, and increases monotonically with cooling Naberezhnov et al. (1999); Vakhrushev et al. (1989); Hirota et al. (2002); Xu et al. (2004). Similar results were also observed in PZN Stock et al. (2004) (see Fig. 1), where is much higher than that of PMN. In order to understand the nature of polarizations and correlations/shapes of the PNR in relaxors, one of the most direct methods is to study the spatial distribution of the diffuse scattering intensity. Recently, several neutron Xu et al. (2004); Hiraka et al. (2004); La-Orauttapong et al. (2001, 2003); Hlinka et al. (2003) and x-ray You and Zhang (1997); Takesue et al. (2001) diffuse scattering measurements have been carried out on various relaxor compounds to investigate the shapes of diffuse scattering intensity distributions in the reciprocal space around different Bragg peaks.

However, the majority of these measurements were performed in a 2-D scattering plane, i.e., probing the two-dimensional diffuse scattering distribution around Bragg peaks. For example, measurements for PMN around (100) and (110) Bragg peaks in the (HK0) scattering plane (see the schematic representation in Fig. 1) suggest that the diffuse scattering intensity extend along the directions. But there is still ambiguity about whether or not these are projections of diffuse scattering intensities along other out-of-plane directions (e.g., projection of [111] direction) onto the scattering plane. You et al. You and Zhang (1997) were the first to measure the out-of-plane x-ray diffuse scattering intensities of PMN around the (300) Bragg peak. Yet no systematic 3-D mapping of diffuse intensity distributions around different Bragg peaks in these relaxor systems has been reported up to date. The lack of understanding of the diffuse scattering distribution in three-dimensions made it very hard to establish an effective and convincing model that can explain and predict accurately the diffuse pattern.
In this paper, we present high energy x-ray diffraction results, on the diffuse intensity distribution in three dimensions measured simultaneously around many Bragg peaks of PZN-PT single crystals. Our results show that the diffuse scattering intensities extend along all six directions around most Bragg points. However, for certain Bragg peaks, one or more of the six type diffuse intensities are absent, because of the associated polarization (atomic shift) being perpendicular to . We suggest a simple phenomenological model, where polarizations are planar correlated in the {110} planes. For example, [10] polarization correlated in the (110) plane. The diffuse scattering patterns calculated based on this simple model are in good agreement with most previous and current results of measurements on diffuse scatterings from PNR in relaxors. Details of this novel technique, our results, and the model calculations, are discussed in the next three sections.
II Experimental Techniques
Single crystals of PZN, PZN-4.5PT (4.5PT) and PZN-8PT (8PT) have been studied. The PZN single crystal is mm3 is size, and was grown at the Simon Fraser University in Canada (the same crystal used in Ref Xu et al., 2003). The 4.5PT single crystal is mm3 in size and provided by TRS ceramics. The 8PT crystal is a part ( mm3) of the original crystal previously studied by Ohwada et al. Ohwada et al. (2003), grown at the Pennsylvania State University.
The x-ray diffraction measurements were performed at X17B1 beamline of the National Synchrotron Light Source (NSLS). A monochromatic x-ray beam of 67 keV, with an energy-resolution of 10-4 (E/E), was produced by a sagittal-focusing double-crystal monochromator using silicon [311] reflection with both crystals in asymmetric Laue mode Zhong et al. (2001). In principle, with a four-circle x-ray diffractometer, one can reach any points in the reciprocal space, if allowed by geometry. However, in reality, most measurements on diffuse scatterings are performed in the “zone”. In other words, the measurements are performed mostly in a plane - the diffraction plane, around certain Bragg peaks. This is also the case for neutron diffuse scattering measurements. For example, measurements in the (HK0) zone indicate that the measurements are performed in the plane perpendicular to the -axis (of the pseudocubic system), so that is fixed (to 0). This only probes two of the three dimensions of the diffuse scattering distribution around Bragg peaks. Certainly one can measure diffuse scatterings in other planes and essentially reconstruct a 3-D picture. But the beam time and efforts spent would usually be enormous.

Position sensitive detectors such as CCD detectors or Image-plates have been used to perform monochromatic Laue style measurements. In this type of measurements, scattering intensities in a plane, i.e., the Ewald sphere, can be taken simultaneously, very similar to the case of electron diffraction measurements in transmission electron microscopies. This usually requires Bragg points to be close to the Ewald sphere. In some cases, single crystal samples were oscillated while the image was taken. This is a very efficient way to obtain 2-D diffraction intensity distributions, but without any information, or with very coarse resolution, along the incident beam direction perpendicular to the image plane. One example of this type of measurements on relaxor systems is shown in Ref. Chaabane et al., 2003.
In our measurements, we were able to take advantage of the high energy (67 keV) of the x-ray beam and a position sensitive CCD detector to perform 3-D x-ray diffuse scattering measurements in a very efficient manner. The focusing double-crystal monochromator set-up is also essential since it produces more than two orders of magnitude more photon flux than that of a conventional set-up. A schematic of the experiment set-up is shown in Fig. 2. The attenuation length of 67 keV x-rays in our samples are a few hundred microns, and the measurements are performed in a transmission mode. The reciprocal lattice and the radius of the Ewald sphere (the curve in Fig. 2) are scaled from the real values in our measurements ( Å Å-1 and Å-1). The incident x-ray beam was assumed to be along the reciprocal lattice [001] direction, and the [100] direction is pointing up. Because of the high x-ray energy, and thus a large , the Ewald sphere is almost flat, parallel to the (001) plane, perpendicular to -axis at small . This makes it possible to reach close to many reciprocal lattice points in the (HK0) zone simultaneously with one sample geometry. In addition, it is important to note that at larger values, the Ewald sphere is not exactly cutting through the reciprocal lattice points. Instead, the sphere cuts through the reciprocal lattice at none-zero values, as well as a small tilt angle to the (001) plane. For example, around the (200) reciprocal point, the Ewald sphere is about r.l.u. away from the exact (200) position. So we are in fact measuring diffraction intensities at (H,K,-0.09) around the (200) position on the CCD. By tilting the sample, therefore tilting the reciprocal lattice, the Ewald sphere can cut the reciprocal lattice at different values as we need. With a few measurements taken at different sample tilts, the geometry of the diffuse scattering intensity distribution in three dimensions can be mapped out easily around selected Bragg peaks. Of course, in our measurements, the Ewald sphere is curved not only vertically, but also horizontally so that the situation would be very similar around the (020) peak as the (200) peak.
Our measurements show that results from PZN, 4.5PT and 8PT crystals are qualitatively the same. The x-ray beam size used in the PZN and 4.5PT measurements were mm2, and mm2 for the 8PT measurements. The -resolution of our measurements is mainly limited by the x-ray beam size. The 8PT measurements with finer resolution show the features in a better detail, so in the next section we will focus on the results obtained using the 8PT sample.
III 3-D x-ray diffuse scattering measurements
III.1 (HK0) zone
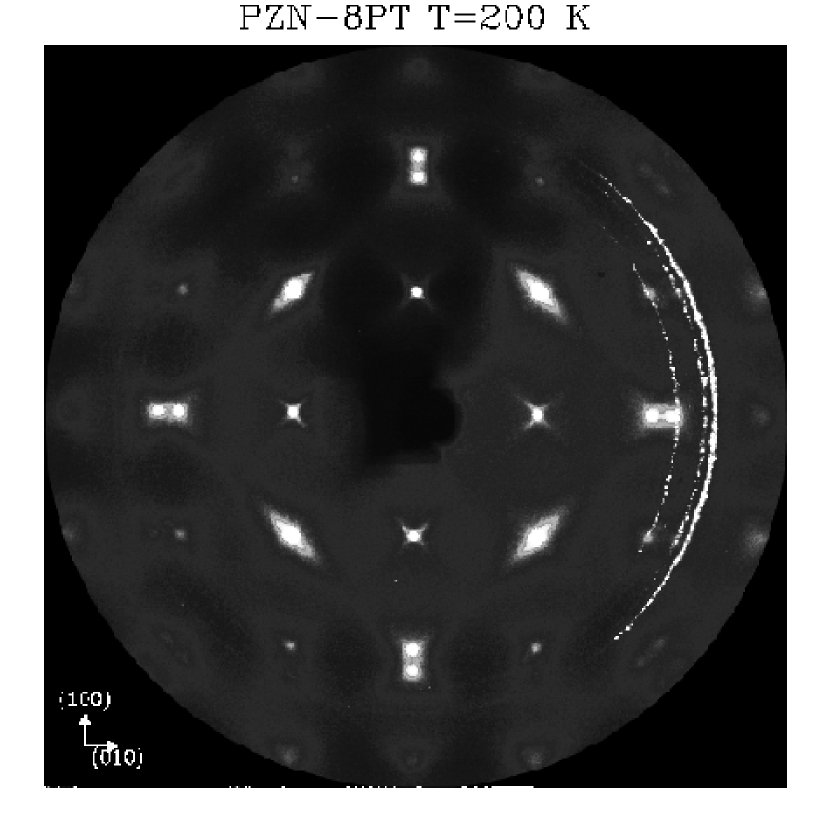
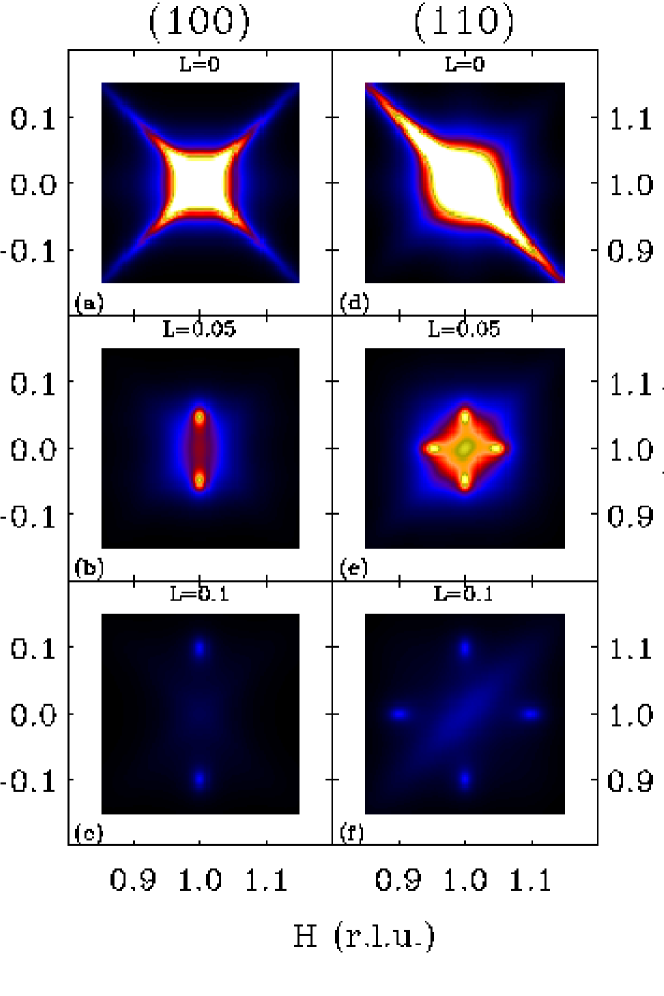
Fig. 3 shows a CCD image taken at K, which is well below the ferroelectric transition temperature K for PZN-8PT Noheda et al. (2002); La-Orauttapong et al. (2002). This was measured in the (HK0) zone, as shown by the schematics in Fig. 2. The x-ray beam is incident in the [001] direction, perpendicular to the CCD plane. [100] and [010] directions are marked in the figure. The center of the image, which is the origin of the reciprocal lattice, is black because a central beam stop was used to block the direct beam. The tilt (vertical) and rotation (horizontal) of the sample has been aligned carefully so that the intensity around (100), (00) are the same, as well as (010) and (00), to ensure that the CCD plane is as parallel to the (001) plane as possible. The counting time was 200 seconds, and we were able to measure very fine features simultaneously around many Bragg peaks for as large as (2,2,0). The rings in the image are powder rings from the Be window in the high temperature displex, and the rest of the background is mainly due to air scattering.
At the four {100} positions ((100), (010), (00), and (00)), the Ewald sphere is still close to the Bragg peak ( r.l.u.). Tails of the Bragg peaks are picked up at these positions. In addition, diffuse intensities extending out from the {100} Bragg peaks along the [110] and [10] directions are clearly observed. Around the four {110} peaks ((110), (10), (10), and (0)), we found that the diffuse scattering intensity is extending more in the transverse direction. For example, at the (110) peak, the diffuse scattering is strong along the [10] direction. These type diffuse intensity distribution is in good agreement with previous x-ray You and Zhang (1997); Takesue et al. (2001) and neutron Xu et al. (2004); Hiraka et al. (2004) diffuse measurements.
When moving to larger positions, the Ewald sphere starts to move further away from the (HK0) plane in the reciprocal space, and the results reveal more interesting behavior. Around the (200) position, r.l.u., two spots are observed, split in the longitudinal direction along (100). Taking into account the curvature of the Ewald sphere, the positions of the two spots can be calculated to be (2.09,0,-0.09) and (1.91,0,-0.09). One can see that (2.09,0,-0.09) (1,0,-1) (2,0,0), and (1.91,0,-0.09) (1,0,1) (2,0,0). It is possible that those could be diffuse intensities extending out from the (200) peak in the [101] and [10] directions. In addition, the [110] and [10] type diffuse intensities can still be vaguely seen around the (200) peak. Although these diffuse intensities are much weaker than the Bragg peak intensity, they are also much broader in reciprocal space. This is why when the Ewald sphere is further away from the Bragg peak at (200) that that at (100), the sharp Bragg peak itself is not observed, but small traces of the [110] and [10] type diffuse intensities still remain.
Around the (210) position, in addition to the two spots split along (100) direction, we can see vaguely two weak spots split along the (010) direction too. This can be better seen at the (220) position, where the Ewald sphere is further away from the (HK0) plane, with r.l.u. Four spots are observed, positioned at around (2.18,2,-0.18), (1.82,2,-0.18), (2,2.18,-0.18), and (2,1.82,-0.18). Similar to the two spots around (200) position, these four spots are possibly intensity rods extending out from the (220) peak, along the [101], [10], [011], and [01] directions, and cutting through the Ewald sphere with a none-zero L value.
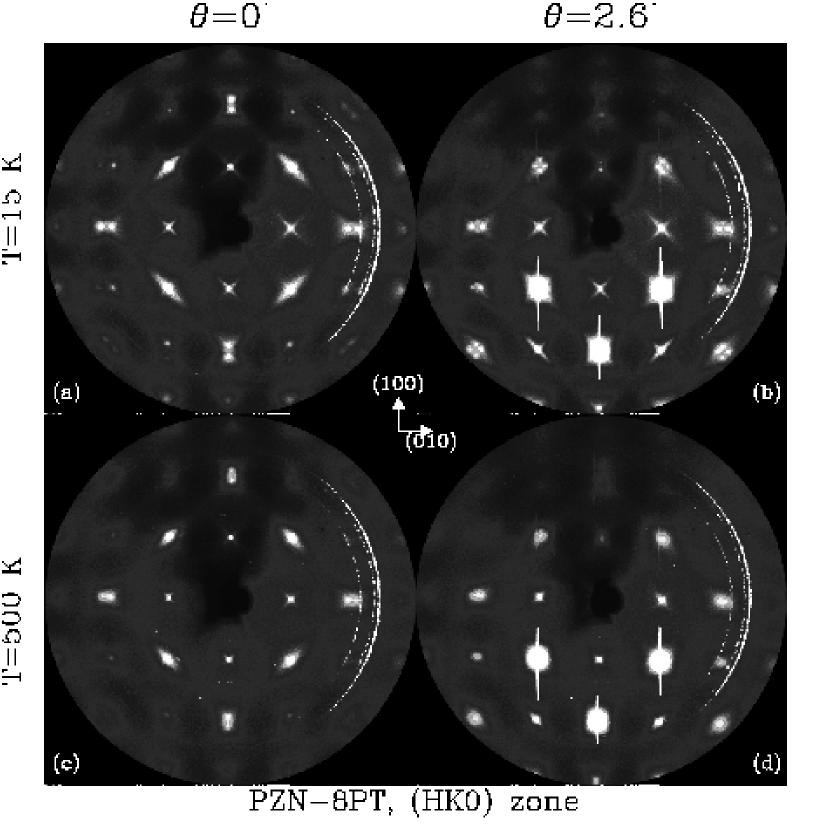
In order to verify this, more measurements were performed by tilting the sample, so that diffuse scattering intensities at different values away from the Bragg peaks can be studied. In Fig. 4, images taken at K and 500 K, as well as different sample tilt angles are shown. At K, sample tilt , the result (Fig. 4 (a)) looks very similar to that at K, shown in Fig. 3. When the sample was tilted by 2.6∘ (Fig. 4 (b)), the (00) Bragg peak was actually right on the Ewald sphere, and the CCD was saturated at that position. The vertical lines in the image are artifacts of the CCD saturation. The (200) peak, however, was moved further away from the Ewald sphere. The sphere is therefore cutting at a larger around the (200) position. The two spots around (200) on the image clearly split further apart than that measured without sample tilt (Fig. 4 (a)). They are roughly positioned at (2.18,0,-0.18) and (1.82,0,-0.18). This confirms that these two spots are indeed results from Ewald sphere cutting the intensity “rods” coming out from the (200) Bragg peak along the [101] and [10] directions. The sample tilt also moved the (100), (110) and (10) peaks (on the top part of the image) further away from the Ewald sphere. The fine features around these positions are also consistent with those around (200) and (220). Two longitudinally split spots at (100), and four spots at (110) and (10). In Fig. 4 (a), these Bragg points are simply too close to the Ewald sphere for any fine features to be observed. The (20) and (0) peaks (on the bottom part of the image) are, however, moved closer to the Ewald sphere in Fig. 4 (b) then in (a). Here we see the four spots moving closer in, also in good agreement with what one would expect from the Ewald sphere cutting intensity “rods” along [101], [10], [011], and [01] directions.
One important fact to note is that around the (200) position, no intensity rods along the [011] and [01] was observed. Similarly, around the (020) position, no intensity rods along the [101] and [10] directions are present. In x-ray and neutron scattering measurements, the diffuse scattering intensity resulting from correlated polarizations (atomic shifts) is proportional to , where is the polarization vector. It is therefore evidential that the polarizations contributing to the [011] and [01] type diffuse scatterings are perpendicular to (1,0,0).
III.2 (HKK) zone
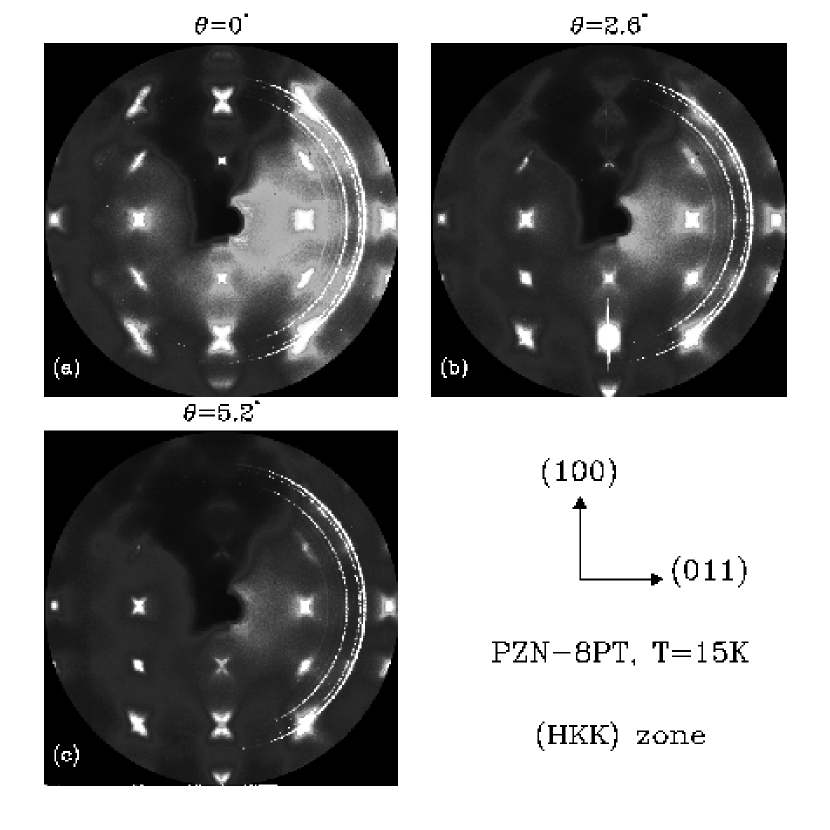
Diffuse scattering measurements were also performed in a different zone, the (HKK) zone. In Fig. 5, results are shown at K, with the sample rotated by 45∘ around the vertical axis ([100] direction). Now the x-ray beam is incident in the [01] direction, and the Ewald sphere is almost parallel to the reciprocal (HKK) plane, i.e., the plane defined by the [100] and [011] vectors.
With sample tilt , we see four spots around the (200) position as expected, where the Ewald sphere is about (0,-0.064,0.064) away from the (HKK) plane. These four spots are roughly positioned at (2.13,0,0.13), (2.13,-0.13,0), (1.87,0,0.13), and (1.87,-0.13,0). It is entirely consistent with the results from the (HK0) zone measurements, i.e., intensity rods extending out in the [101], [10], [110], and [10] directions from the (200) peak, being cut by the Ewald sphere. With tilt (see Fig. 5 (b)), these four spots move further out, as the Ewald sphere is moving further away from the (HKK) plane around (200). No central peak is seen at the center of those four spots ((2.,-0.64,0.64)), confirming the absence of diffuse intensity rods in the [01] direction around the (200) position. In addition, one starts to see similar features around the (100) position as well. With further tilting, (see Fig. 5 (c)), the intensities around (200) has become very weak, and the further parted four spots can hardly be observed. On the bottom of the image, four spots also appear around the (00) position. There the Ewald sphere actually went passed the (HKK) plane, with (0,0.064,-0.064), so similar patterns are seen there compared to Fig. 5 (a).
Diffuse patterns around other Bragg positions are all consistent with this type diffuse rods. For example, if we look at around the (220) position, a strong peak appears there. The Bragg structure factor of PZN (220) and (200) are the same order of magnitude, yet the Ewald sphere is further away from the Bragg peak at (220) than (200) (because of the larger ). Since the (200) Bragg is not observed, neither should the (220) Bragg. In fact, that “peak” is not the (220) Bragg peak, but instead the diffuse scattering intensity coming out from the (220) peak along the [01] direction (perpendicular to the image plane).
III.3 3-D diffuse intensity distribution
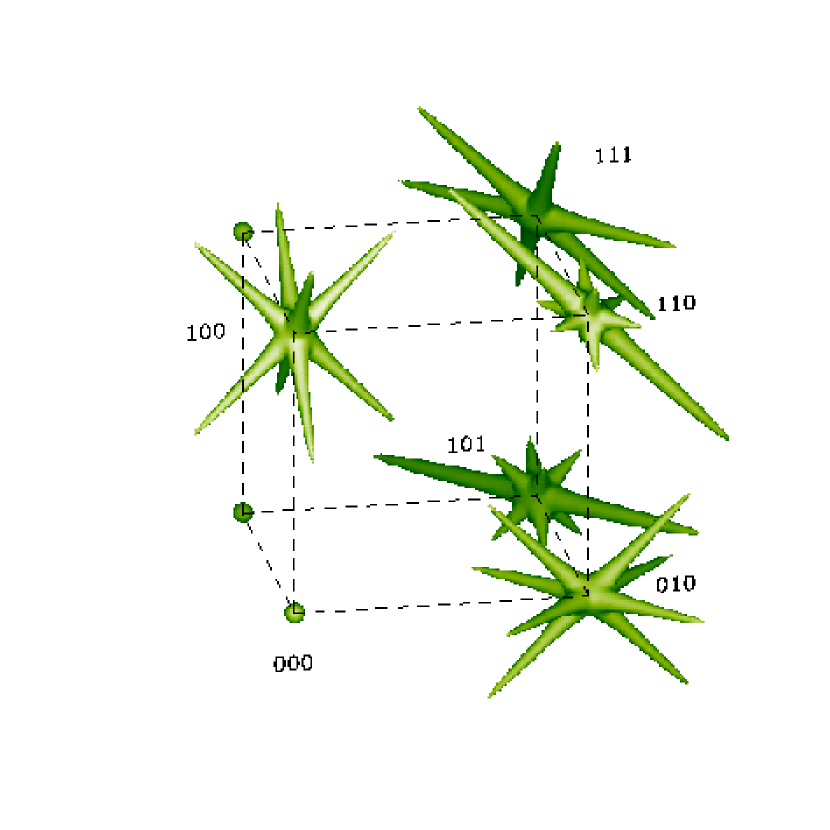
Our results can establish unambiguously the geometry of the diffuse scattering intensities distributed in the reciprocal space. Based on all the information obtained, (i) diffuse intensities are type rods around Bragg peaks; (ii) the intensities of different diffuse rods can vary between different Bragg reflections; (iii) at some Bragg reflections, certain intensity rods are strong, and certain rods may even be absent, the 3-D distribution of the diffuse scattering intensity can be sketched in Fig. 6. The 3-D sketch is shown in the way that the (001) plane ((HK0) plane) is parallel to the paper. Here we plot the equi-intensity surface of the diffuse scattering around various Bragg peaks. The contrast and sharpness of the diffuse intensity rods have been exaggerated in order to illustrate the geometry in a simple and effective way.
In a quantitative way, it describes our results very well. For example, around the (100) peak, the [110], [10], [101], and [10] diffuse rods are of equal intensities, but the [011] and [01] rods are absent; around the (110) peak, the [10] diffuse rod is much more intense than the [101], [10], [011], and [01] rods, but the [110] rod is absent. A cross section of the 3-D diffuse scattering distribution in the (HK0) plane gives the “butter-fly” shaped pattern around the (100) peak, and the transverse [10] type diffuse around the (110) peak, in good agreements with previous neutron scattering measurements Xu et al. (2004); Hiraka et al. (2004). More detailed model calculations will be presented in the next section.
IV Discussions
IV.1 Static or dynamic?

One disadvantage of x-ray diffraction measurements is the coarse energy resolution, so that many of the low energy phonon modes are also included together with the elastic component. Some examples of phonon contributions dominating the x-ray diffuse intensity distribution can be found in similar ferroelectric perovskite compounds BaTiO3 Takesue et al. (1995) and KTaO3 Comès and Shirane (1972). A very important question to resolve is whether these intensity rods observed in PZN-PT diffuse are coming from phonon contributions (thermal diffuse) or static distortions (static diffuse).
Recently, neutron diffuse scattering measurements Xu et al. (2004); Hiraka et al. (2004); Hlinka et al. (2003); Gvasaliya et al. (2004) have been performed on the relaxor systems with good energy resolutions so that phonon intensities can be easily separated out. These results have directly confirmed that the type diffuse intensities in the (HK0) plane are elastic.
The temperature dependence of the diffuse scattering intensity is also consistent with the static nature. In Fig. 7, the temperature dependence of the diffuse scattering intensity at (2.09,0,-0.09) (the top one of the two spots observed around the (200) position) are plotted for PZN, 4.5PT, and 8PT. At T below , the intensity decreases slowly and monotonically with increasing T for all three compounds. In addition, the diffuse intensity does not reach zero at the ferroelectric phase transition, but rather at some temperatures above . All these are in agreement with the elastic diffuse scatterings expected from PNR in relaxor ferroelectric systems.
Phonon scattering intensities, on the other hand, are proportional to , when taking into account of the Bose factor and the factor. In PZN Stock et al. (2004) and PMN Wakimoto et al. (2002), the zone center TO phonon energy actually increases with cooling for . Measurements on TA phonons at small in the same systems Wakimoto et al. (2002); Stock et al. (2004) also confirmed that the TA phonon modes behave normally below , i.e., no significant broadening or softening. Therefore, both TO and TA phonon contribution to the x-ray diffuse scattering should increase with increasing T, at least for the low temperature range . This is in contrast to the data shown in Fig. 7. As a comparison, x-ray diffuse scattering measurements with similar set-ups on single crystals of Si have been performed by us, and by Holt et al. Holt et al. (1999). There the phonon contribution dominates, and the thermal diffuse intensity clearly increases with heating.
| (100) | (110) | (111) | (200) | (210) | (220) | (222) | (300) | |
|---|---|---|---|---|---|---|---|---|
| 1 | 19 | 11 | 63 | 5 | 126 | 190 | 9 | |
| 10 | 27 | 17 | 33 | 50 | 66 | 99 | 90 | |
| 88 | 43 | 30 | 10 | 439 | 20 | 30 | 789 |
Another clue is provided by comparing the structure factors calculated based on previous results. Previous measurements by You et al. obtained similar results near the (300) Bragg peak. It was attributed to contributions from ferroelectric soft transverse optic phonons propagating along the directions, and thus concluded to be only strong around the odd integer Bragg reflections ( odd). In our measurements, however, the diffuse scattering intensities around the (200), (110), and (220) Bragg peaks are reasonably strong. The static diffuse scattering, acoustic and and soft optic phonon structure factors at different Bragg reflections are shown in Table. 1. Apparently the diffuse scattering intensities observed in our measurements are more consistent with the static diffuse structure factors, which do not vary much between different Bragg peaks in our measurement range. It is also qualitatively in agreement with measurements by Takesue et al. Takesue et al. (2001) on PMN in the (HK0) plane. The soft phonon structure factors, however, vary a lot and are very strong at (210) and (300). Measurements around those peaks did not show any particularly strong diffuse intensities (see Figs. 3 and 4).
These facts strongly suggest that for temperatures , the main contribution to our x-ray diffuse scattering is coming from static lattice distortions, namely, those from the polarized PNR, instead of thermally activated inelastic phonon scatterings. We can therefore study the low temperature diffuse scattering distributions to better understand the static polarizations (atomic shifts) and correlations in the PNR. With increasing temperature, the phonon contributions will eventually increase and dominate. In fact, at 700 K, with the disappearance of the two spots around (200) position, we started to pick up intensities around (2,0,-0.09), which is very likely coming from thermally activated phonons propagating in the [001] direction.
In the next two subsections, we will start at providing a simple phenomenological model describing the real space correlation of polarizations, that gives rise to the rod-type diffuse intensities. Based on this model, the shape of diffuse scattering in these compounds can be well calculated within good agreement to the experimental results. We will then suggest one possible origin of these elastic diffuse scatterings from the aspect of lattice dynamics - condensation of soft optic phonons into static distortions.
IV.2 Planar correlations - “pancake” model

Having determined the static nature of these observed type diffuse intensity rods, we now consider a simple model that can reproduce such diffuse intensities. Generally, a rod type structure in the reciprocal space corresponds to a planar structure in the real space. Therefore, the type diffuse scattering intensity can be a result of polarizations correlated in the {110} planes in the real space. There are totally six {110} planes, corresponds to the six diffuse intensity rods. Furthermore, the polarizations should have the same periodicity as the lattice itself, because all these diffuse scattering intensities peak at the Bragg positions, instead of forming some super-lattice peaks.
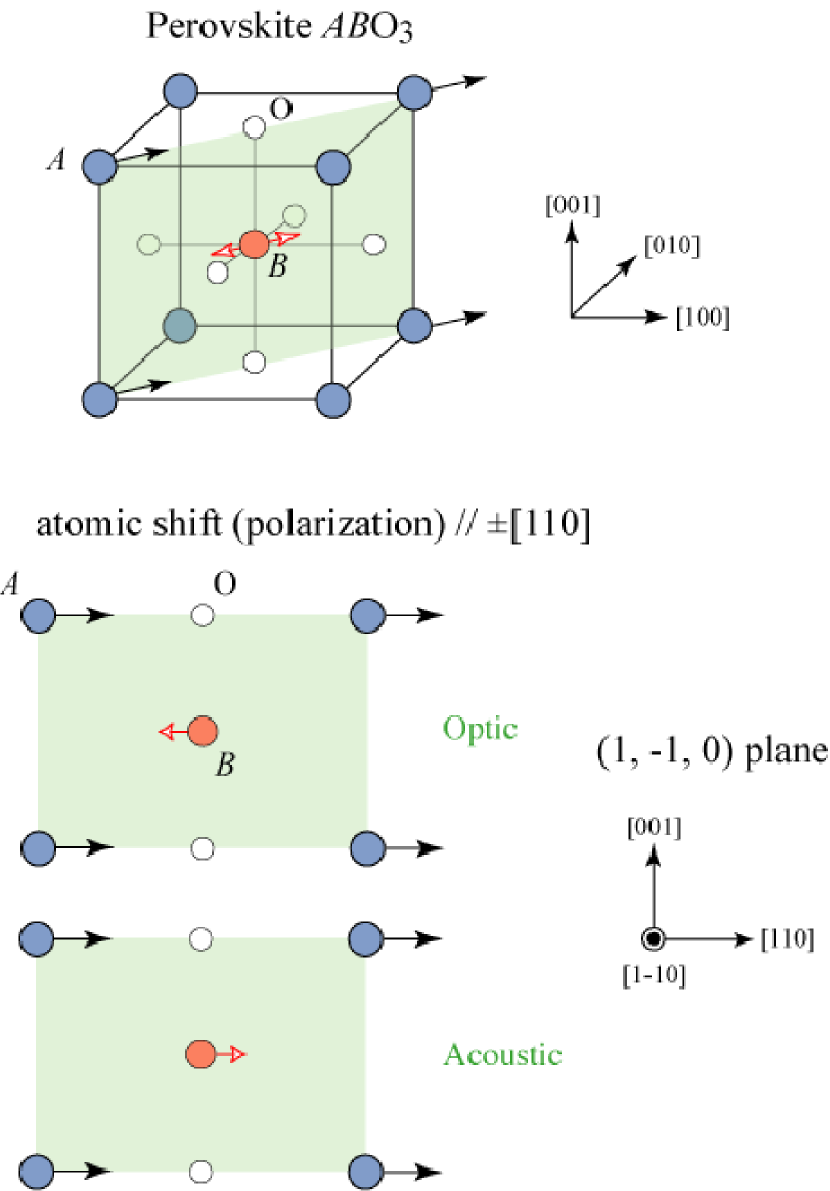
The problem remaining is to determine the directions of these polarizations with planar type correlations. The polarizations can be either in-plane, or out-of-plane, as shown in Fig. 8. Here the polarizations are confined in the “pancake” shaped spaces, indicating the planar type correlations. One can easily find that out-of-plane type polarizations as shown in Fig. 8 (b) do not yield the type of diffuse intensity pattern around the (110) peak. There when measured in the (HK0) plane, the diffuse intensity is mostly transverse along the [10] direction, and the [110] type intensity rod is absent. Since , polarizations correlated in the (110) plane, that give rise to the [110] type diffuse, must be perpendicular to (1,1,0) for this intensity to be zero. Only in-plane type polarizations can satisfy this condition.
Nevertheless, the polarizations still can not rotate freely in the {110} planes. The exact direction of these polarizations can be determined by studying the diffuse intensity around the (200) peak. Here the diffuse scatterings along [011] and [01] directions are absent. So, for the [011] type diffuse, must be perpendicular to both (2,0,0) (so that ) and the out-of-plane vector [011] (so that is in-plane). This immediately leads to [01]. Similar analysis can be used to derive the polarizations directions associated to all the six type diffuse scatterings.
In summary, we find that the real space structure corresponding to the rod-type diffuse intensity is {110} planar correlations of in-plane polarizations. More specifically, there are polarizations along the [110] direction, correlated in the (10) plane; polarizations along the [10] direction, correlated in the (110) plane; polarizations along the [101] direction, correlated in the (10) plane; polarizations along the [10] direction, correlated in the (101) plane; polarizations along the [011] direction, correlated in the (01) plane; and polarizations along the [01] direction, correlated in the (011) plane. Fig. 9 provides a schematic illustration of one of these six planar correlations in real space. The x-ray diffraction measurements are less sensitive to the lighter atoms such as O, so we only illustrated possible motions of the heavier A (Pb2+) and B (Zn2+/Nb5+/Ti4+) site atoms. The motions of the A site and B site can be parallel (acoustic) or antiparallel (optic), or a combination of the two.
The diffuse scattering intensity can be therefore calculated based on this simple model. At ,
| (1) |
is the sum of contributions from the six {110} planar type correlations, where is the diffuse scattering structure factor at the Bragg reflection ; is the polarization vector correlated in the plane (one of the six ); and , are the inverse of the correlation length in- and out-of-plane; and are the in- and out-of-plane components of . Here we used a product of Lorentzian functions because an exponentially decaying correlation in real space, both in- and out-of-plane, has been assumed. For a square-function cut-off type correlation caused by a finite “pancake” shape, with thickness described by and diameter described by , the reciprocal space intensity distribution will take the functional forms of Gaussian functions instead. However, the shape of the diffuse scattering intensity will not change qualitatively.
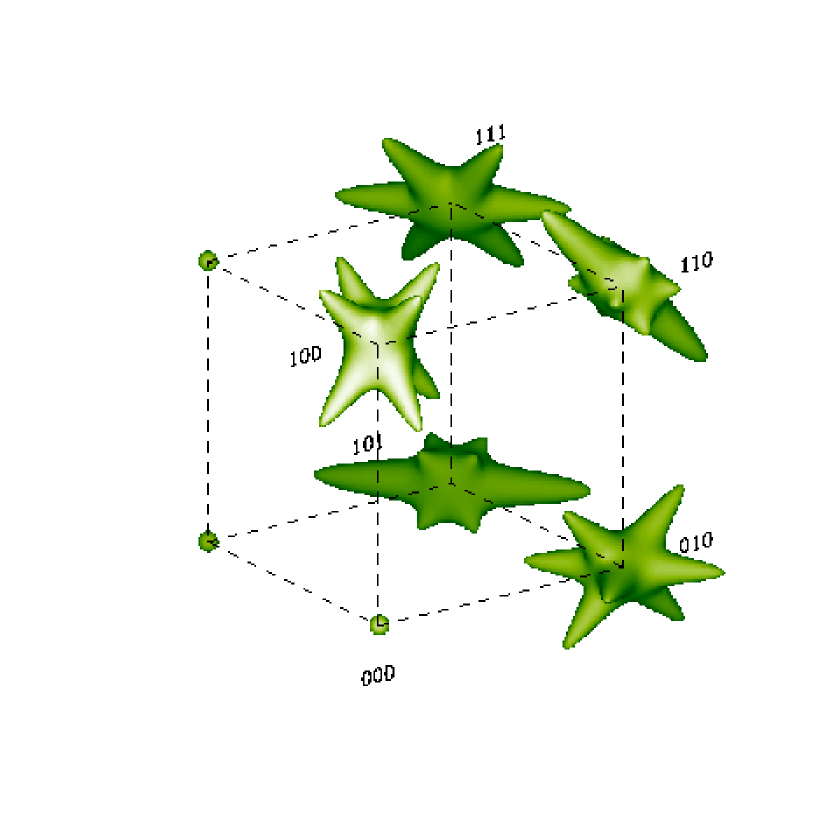
In the simulation, the in-plane correlation length was assumed as 20 lattices, 4 times larger than the out-of-plane correlation length (5 lattices - estimated from results of neutron diffuse measurements on PMN by Xu et al. Xu et al. (2004)). The contributions from the six {110} planar correlations are weighed by the factor and summed up. The result is shown in Fig. 10. Here the equi-intensity surface of the diffuse scattering intensity is plotted. Note that for best visual effects, the static diffuse structure factors in Table. 1 and the factor were taken out in constructing Fig. 10, in order to illustrate the diffuse intensity distributions around different Bragg peaks with the same quality in the same figure. In the exaggerated version of this model, as shown in Fig. 6, the in-plane correlation length was chosen to be 20 times larger than the out-of-plane one to produce those “sharp” diffuse rods.
In Fig. 10, the simulated diffuse scattering intensities around the (100), (010), (110), (111), and (011) Bragg peaks are plotted. When measured in the (HK0) plane, the cross section of the 3-D diffuse scattering intensities gives the “butter-fly” diffuse pattern around (100) and (010) peaks, as well as the transverse [10] type diffuse around the (110) peak. By moving away from the (HK0) plane, with a small , one starts to see the two spots split in the longitudinal direction around the (100) Bragg peak due to the [101] and [10] type diffuse intensities; and four spots around the (110) Bragg peak due to the [101], [10], [011], and [01] type diffuse intensities. A simulation of diffuse intensities in the (HK) plane, at different values is shown in Fig. 11. It is in good agreement with our measurements in the (HK0) zone. Similarly, one can also compare the simulation in the (HKK) zone to our measurements. We found that calculations based on this model can explain all of our results, as well as almost all of the previous results from x-ray You and Zhang (1997); Takesue et al. (2001) and neutron Xu et al. (2004); Hiraka et al. (2004); Hlinka et al. (2003) diffuse scattering measurements on PMN and PZN-PT. Although it does not yet provide a clear physical picture on the origin of these correlated polarizations, it is very useful in calculating and predicting diffuse scattering distributions in these relaxor compounds.
One interesting problem is that all of the three compounds in our measurements have rhombohedral type polarizations below . Recent NMR measurements Blinc et al. (2003) on PMN also confirms the type polarization in the system. How do the type polarization and the correlated type polarization coexist in the same system? In fact, our model is not in contradiction to the average type polarization. Alternatively, the type polarization can be decomposed into three components. The average type polarization can be a result of global averaging of type polarized “pancake” entities. Another possible scenario could be the following: when three different {110} type “pancakes” (e.g., (110), (011), and (101)) cross each other, the region shared by those three “pancakes” would have a combination of three polarizations - resulting in a type polarization. This shared region could be a polarized PNR, and the size of this region is then defined by the thickness of the three “pancakes”, i.e., the out-of-plane correlation length, which is in the order of one to few nanometers (a few lattice units).
IV.3 Condensation of polarized soft optic phonon modes
Ferroelectric polarizations are optic type distortions, associated with different atoms moving opposite to each other in the unit cell. It is well accepted that the PNR are formed from the condensation of the ferroelectric soft optic phonon mode. Previous measurements show that the transverse optic (TO) phonons become overdamped for for smaller than a certain value, called the “waterfall” wave-vector Gehring et al. (2000, 2001). The “water-fall” effect was observed for along both [001] and [011] directions Gehring et al. (2000), and is believed to be intimately related to some length scales defined by the PNR. We can therefore suggest one possible origin of the rod-type diffuse scattering intensities. If the polarized optic phonon modes are particularly soft when propagating along the perpendicular directions, they can then condense into the type elastic diffuse intensities upon cooling. This occurs around , when the soft optic mode becomes overdamped and start to condense into static distortions. The shape of these static entities are then determined by the energy dispersion, i.e., phonon velocity, of these polarized modes. Take the [10] polarized mode for example, it is likely to be softer along the [110] direction, i.e., the optic phonon propagates with a smaller velocity along the [110] direction; and harder in the (110) plane. When this mode becomes overdamped at , it then condenses accordingly, with a shorter length scale along the [110] direction than in the (110) plane, resulting in the (110) planar correlation of the [10] polarizations, and the “pancake” shaped entity.
Since PNR are results of soft TO phonon condensation, why do the static diffuse scattering and soft optic phonons have different structure factors? This discrepancy has been very well explained by Hirota et al. with the phase-shifted PNR Hirota et al. (2002) model. They re-examined the atomic shift values derived from the neutron diffuse scattering measurements by Vakhrushev et al. Vakhrushev et al. (1995) on PMN, and found out that those values do not satisfy the center of mass condition. The mass center of the atoms in the PNR are displaced from the surrounding lattice along the polarization direction. This displacement is called the “uniform-phase-shift”, which is an acoustic type of atomic motion. The ferroelectric soft phonon mode only condense into the center-of-mass portion of the atomic shifts in the PNR, and therefore have different structure factors than the overall static atomic shifts in the PNR.
In our measurements, we were able to probe diffuse scattering intensities distributed in three dimensions around many Bragg peaks simultaneously, from PZN-PT single crystals. The shape of the diffuse scattering in the reciprocal space can be described as “rod” type intensities, resulting from {110} planar correlations of polarizations in the real space, with the in-plane correlation length about a few to ten times larger than the out-of-plane correlation length. On the other hand, limited by the measurement resolution, we can not accurately determine the values of correlation length in and out of the correlation planes. In addition, we also do not have enough information to demonstrate whether the in-plane correlations are isotropic, or have certain preferences. Further studies on these relaxor systems are required to complete these details and to provide a clear physical picture to explain the origin of the planar correlations.
Acknowledgements.
We would like to thank P. M. Gehring, S.-H. Lee, S. M. Shapiro, C. Stock, and S. B. Vakrushev for stimulating discussions. Financial support from the U.S. Department of Energy under contract No. DE-AC02-98CH10886 and the U.S.-Japan Cooperative Neutron Scattering Program is also gratefully acknowledged.References
- Park and Shrout (1997) S.-E. Park and T. R. Shrout, J. Appl. Phys. 82, 1804 (1997).
- Kuwata et al. (1982) J. Kuwata, K. Uchino, and S. Nomura, Jpn. J. Appl. Phys. 21, 1298 (1982).
- Kuwata et al. (1981) J. Kuwata, K. Uchino, and S. Nomura, Ferroelectrics 37, 579 (1981).
- Burns and Dacol (1983) G. Burns and F. H. Dacol, Phys. Rev. B 28, 2527 (1983).
- Naberezhnov et al. (1999) A. Naberezhnov, S. Vakhrushev, B. Doner, D. Strauch, and H. Moudden, Eur. Phys. J. B 11, 13 (1999).
- Vakhrushev et al. (1989) S. B. Vakhrushev, B. E. Kvyatkovksy, A. A. Naberezhnov, N. M. Okuneva, and B. Toperverg, Ferroelectrics 90, 173 (1989).
- Hirota et al. (2002) K. Hirota, Z.-G. Ye, S. Wakimoto, P. M. Gehring, and G. Shirane, Phys. Rev. B 65, 104105 (2002).
- Xu et al. (2004) G. Xu, G. Shirane, J. R. D. Copley, and P. M. Gehring, Phys. Rev. B 69, 064112 (2004).
- Stock et al. (2004) C. Stock, R. J. Birgeneau, S. Wakimoto, J. S. Gardner, W. Chen, Z.-G. Ye, and G. Shirane, Phys. Rev. B 69, 094104 (2004).
- Hiraka et al. (2004) H. Hiraka, S.-H. Lee, P. M. Gehring, G. Xu, and G. Shirane (2004), eprint cond-mat/0403544.
- La-Orauttapong et al. (2001) D. La-Orauttapong, J. Toulouse, J. L. Robertson, and Z.-G. Ye, Phys. Rev. B 64, 212101 (2001).
- La-Orauttapong et al. (2003) D. La-Orauttapong, J. Toulouse, Z.-G. Ye, W. Chen, R. Erwin, and J. L. Robertson, Phys. Rev. B 67, 134110 (2003).
- Hlinka et al. (2003) J. Hlinka, S. Kamba, J. Petzelt, J. Kulda, C. A. Randall, and S. J. Zhang, J. Phys.: Condens. Matter 15, 4249 (2003).
- You and Zhang (1997) H. You and Q. M. Zhang, Phys. Rev. Lett. 79, 3950 (1997).
- Takesue et al. (2001) N. Takesue, Y. Fujii, and H. You, Phys. Rev. B 64, 184112 (2001).
- Xu et al. (2003) G. Xu, Z. Zhong, Y. Bing, Z.-G. Ye, C. Stock, and G. Shirane, Phys. Rev. B 67, 104102 (2003).
- Ohwada et al. (2003) K. Ohwada, K. Hirota, P. W. Rehrig, Y. Fujii, and G. Shirane, Phys. Rev. B 67, 094111 (2003).
- Zhong et al. (2001) Z. Zhong, C. C. Kao, D. P. Siddons, and J. B. Hastings, J. Appl. Cryst. 34, 646 (2001).
- Chaabane et al. (2003) B. Chaabane, J. Kreisel, B. Dkhil, P. Bouvier, and M. Mezouar, Phys. Rev. Lett. 90, 257601 (2003).
- Noheda et al. (2002) B. Noheda, D. E. Cox, and G. Shirane, Ferroelectrics 267, 147 (2002).
- La-Orauttapong et al. (2002) D. La-Orauttapong, B. Noheda, Z.-G. Ye, P. M. Gehring, J. Toulouse, D. E. Cox, and G. Shirane, Phys. Rev. B 65, 144101 (2002).
- Takesue et al. (1995) N. Takesue, M. Maglione, and H. Chen, Phys. Rev. B 51, 6696 (1995).
- Comès and Shirane (1972) R. Comès and G. Shirane, Phys. Rev. B 5, 1886 (1972).
- Gvasaliya et al. (2004) S. N. Gvasaliya, S. G. Lushnikov, and B. Roessli, Phys. Rev. B 69, 092105 (2004).
- Wakimoto et al. (2002) S. Wakimoto, C. Stock, R. J. Birgeneau, Z.-G. Ye, W. Chen, W. J. L. Buyers, P. M. Gehring, and G. Shirane, Phys. Rev. B 65, 172105 (2002).
- Holt et al. (1999) M. Holt, Z. Wu, H. Hong, P. Zschack, P. Jemian, J. Tischler, H. Chen, and T.-C. Chiang, Phys. Rev. Lett. 83, 3317 (1999).
- Vakhrushev et al. (1995) S. B. Vakhrushev, A. A. Naberezhnov, N. M. Okuneva, and B. N. Savenko, Phys. Solid State 37, 1993 (1995).
- Blinc et al. (2003) R. Blinc, V. Laguta, and B. Zalar, Phys. Rev. Lett. 91, 247601 (2003).
- Gehring et al. (2000) P. M. Gehring, S.-E. Park, and G. Shirane, Phys. Rev. Lett. 84, 5216 (2000).
- Gehring et al. (2001) P. M. Gehring, S.-E. Park, and G. Shirane, Phys. Rev. B 63, 224109 (2001).