Percolation and Colossal Magnetoresistance in Eu-based Hexaborides
Abstract
Upon substituting Ca for Eu in the local-moment ferromagnet EuB6, the Curie temperature decreases substantially with increasing dilution of the magnetic sublattice and is completely suppressed for 0.3. The Ca substitution leads to significant changes of the electronic properties across the EuxCa1-xB6 series. Electron microscopy data for 0.27 indicate a phase separation into Eu- and Ca-rich clusters of 5 to 10 nm diameter, leading to percolation-type phenomena in the electrical transport properties. The related critical concentration is approximately 0.3. For 0.27, we observe colossal negative magnetoresistance effects at low temperatures, similar in magnitude as those reported for manganese oxides.
pacs:
72.15.Gd, 75.30.Kz, 75.47.GkStrong variations of the electrical resistivity by external magnetic fields may be achieved either in specially tailored thin-film heterostructures, leading to so called giant magnetoresistance fert1 , or in manganese oxides which exhibit metal/insulator transitions and concomitant magnetic ordering phenomena, leading to colossal magnetoresistance effects jin . Giant magnetoresistance is related to the spin-dependent scattering of conduction electrons between magnetically ordered layers which is strongly affected by external fields fert2 . Colossal magnetoresistance is traced back to a strong coupling of the electronic subsystem to the lattice, leading to polaron formation batlogg . The onset of ferromagnetic order, favored by applying external fields, induces a transition to a metallic, i.e., low resistive state.
Large magnetoresistance effects are also known to occur in some Eu-based chalcogenides kasuya and in EuB6 bachmann . Also here, ferromagnetism favors metallicity, both by enhancing the number of itinerant charge carriers and by reducing the spin disorder scattering leo . Again, increasing magnetic fields help to enhance the electrical conductivity of the respective materials.
In this work, we present and discuss a set of electrical transport data for materials of the series EuxCa1-xB6 and demonstrate that they are strongly influenced by a phase separation between nanoscopically small Eu- and Ca-rich regions. This phenomenon leads to percolation effects in both the onset of magnetic order and the electronic transport. For close to = 0.31, the three dimensional site percolation limit for a simple cubic lattice kirkpatrick1 ; efros ; efros2 , we observe extremely large negative magnetoresistance effects.
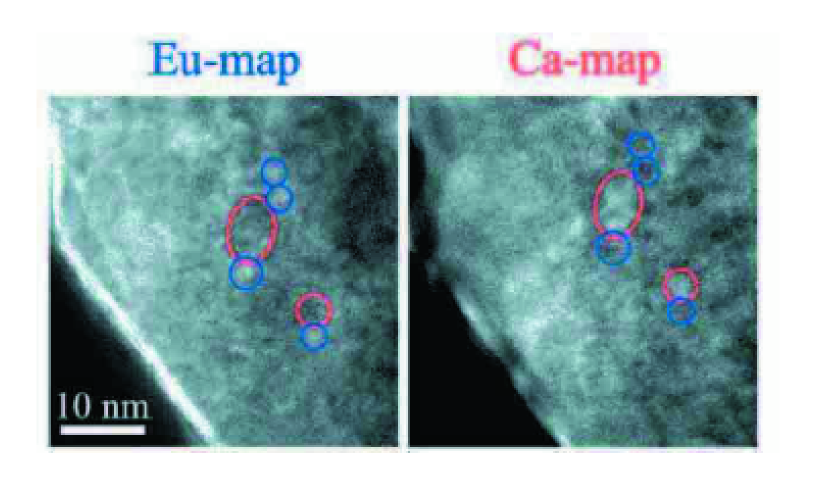
Single-crystalline samples of EuxCa1-xB6 were grown in a flux of 99.999 pure Al, using the starting elements Eu, Ca and B with purities of 99.95, 99.987 and 99.99, respectively. Measurements of the magnetization were made with a commercial SQUID magnetometer. In order to avoid the influence of possible magnetic impurities at the surface, the samples were etched for a short time in strongly diluted nitric acid. High resolution transmission electron microscopy (HRTEM) investigations were made with a FEI Technai F30 instrument, equipped with a field emission electron gun and an energy filter from Gatan Inc. The filter employs an electron energy loss spectrometer (EELS) to select a particular energy window for the inelastically scattered electrons to form the image. The chemical maps shown in Fig.(1) were recorded with the so-called three-window technique. Selected area electron diffraction patterns and HRTEM images, which are both not shown because of space restrictions, reveal the high perfection of the atomic arrangements in the crystals, also for low values of . However, energy-filtered TEM images reveal a phase separation resulting in Eu- and Ca-rich regions. An example is shown in Fig.(1) for = 0.27. Two patches relatively rich in Ca are marked by red rings, several other patches relatively rich in Eu are emphasized by blue rings. The comparison of the two maps reveals that a relative richness in one element is correlated with a relative deficiency in the other. Analogue Boron maps confirm a constant distribution of the anion element. The typical diameter of the clusters is between 5 and 10 nm. In view of the different concentrations of charge carriers in the different regions (see inset of Fig.(2)), the maps shown in Fig.(1) may also be taken as evidence for an electronic phase separation and hence the formation of regions with different electrical conductivities.
The resistivities and the Hall voltages were measured using a standard low-frequency a.c. four-contact technique in longitudinal and transversal configuration, respectively. The covered temperature and magnetic field ranges were between 0.35 and 300 K, and 0 and 7 Tesla, respectively.
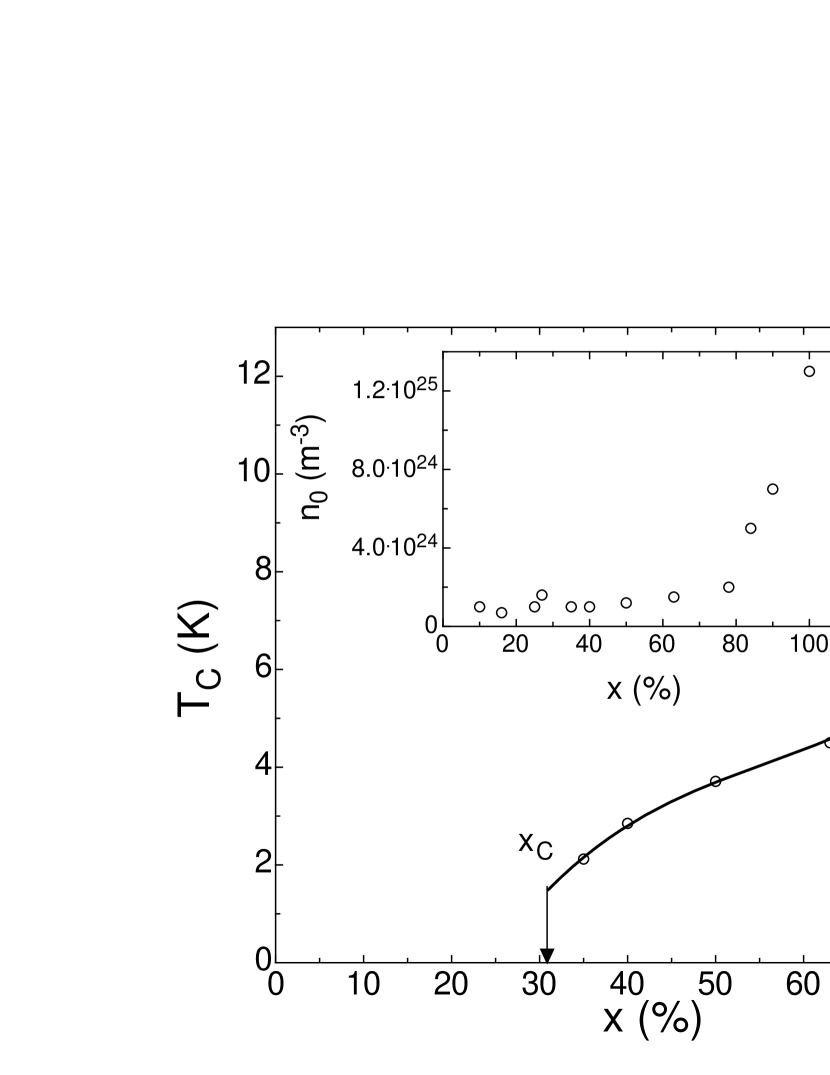
In Fig.(2) we present the dependence of the Curie temperature as established by measurements of the specific heat and the electrical resistivity in zero magnetic field, as well as by Arrott-plot analyses of the magnetization . decreases monotonously but non linearly with decreasing and vanishes at 0.3. The non-linear decrease of most likely reflects the formation of Eu- and Ca-rich regions, whereby merely represents an average concentration of Eu ions. For 0.3, i.e., below the percolation limit, the ground state exhibits spin-glass type features future .
In the following we argue that the phase separation is also reflected in the electronic transport properties across the series. As described in detail before mandrus ; wiggermonnier , the total electrical resistivity of these materials is due to different contributions. In our case we consider
| (1) |
where , and represent the spin-disorder, the electron-phonon and the defect scattering, respectively.
Because in these hexaborides, the concentration of conduction electrons is temperature dependent, all three contributions to vary with temperature, in particular also . It is which is mainly affected by the phase separation and therefore is expected to reflect the influence of percolation effects most significantly.
The spin disorder scattering is taken into account by taylordarby ; haas
| (2) |
with as the effective exchange interaction parameter, as the number of cations per unit volume, as the effective mass and as the concentration of the conduction electrons. For the scattering of electrons on phonons, we used the same model approach that was successful in previously published analyses of the electrical resistivities of LaB6 mandrus and EuB6 wiggermonnier , where the phonon spectrum was approximated by a Debye type spectrum and two superimposed Einstein modes. The latter modes model the motion of Eu and Ca ions inside the respective Boron cages. The Debye temperature was taken as 1160 K, as previously reported mandrus ; wiggermonnier . The best fits were obtained with Einstein temperatures of 168 K and 373 K for the Eu and the Ca mode, respectively. The activation of mobile charge carriers out of defect states, implied by results of Hall voltage measurements future ; wiggermonnier , was considered by setting
| (3) |
where represents the constant mobile-carrier densities in the range 30 K 70 K, shown in the inset of Fig.(2). The excitation energy is the energy of defect states with respect to the Fermi energy. The relaxation rate for the defect scattering, assumed to be temperature independent, was evaluated from = - - and .
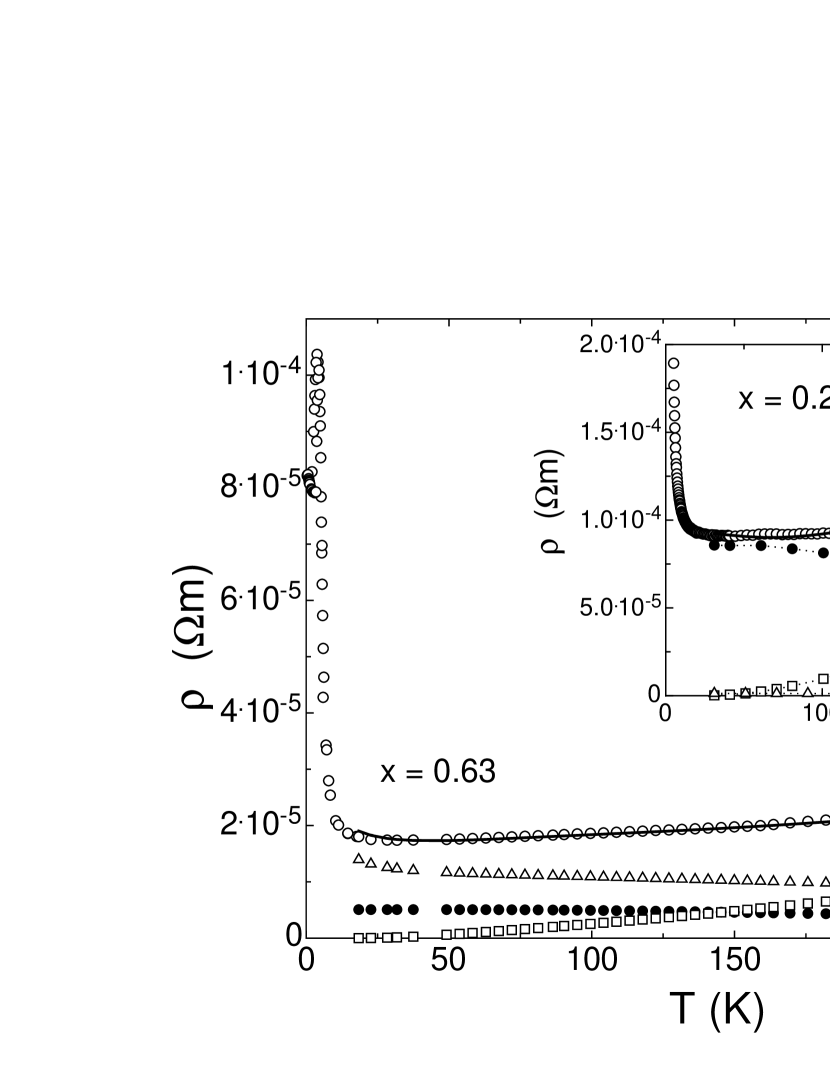
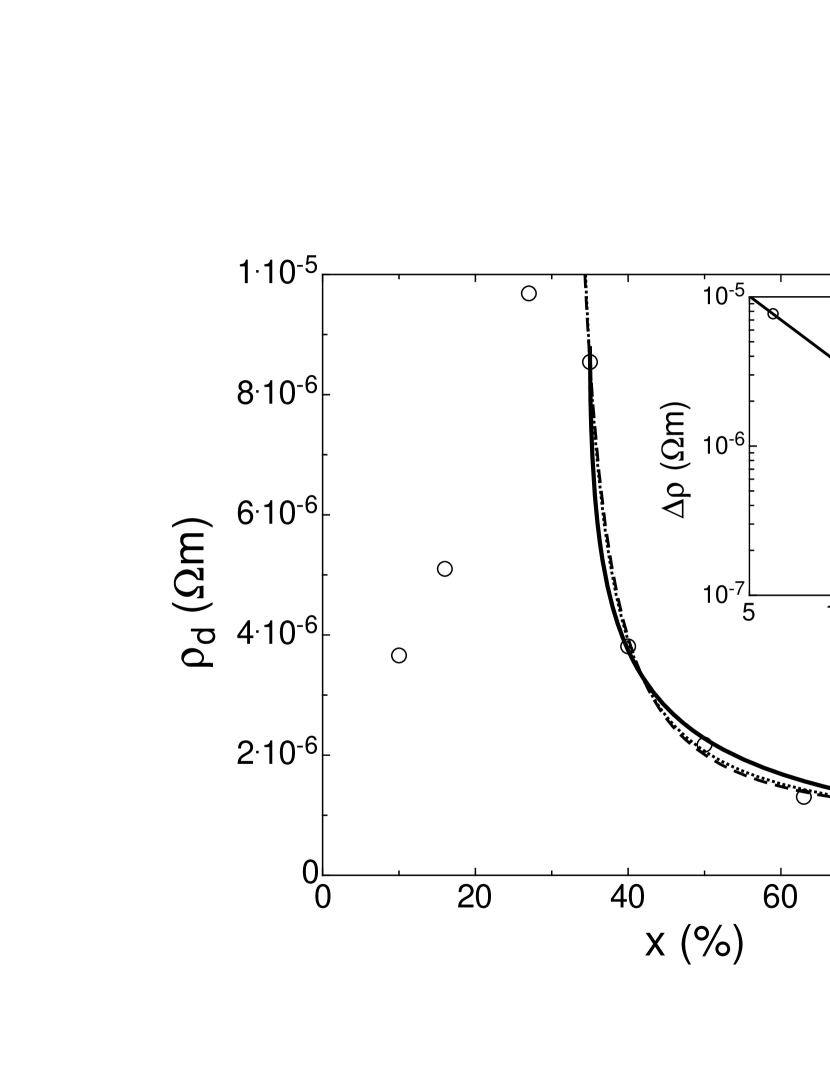
The temperature dependences of the individual contributions, adding up to the total of material with = 0.63 and 0.27, is shown in Fig.(3). The calculated solid lines are in remarkably good agreement with experiment. In order to emphasize the effect of percolation, was scaled to a charge carrier concentration of 1.31025 m-3, the value of . From fits to the experimental data for for other values of , the scaled values of were evaluated and plotted in the main frame of Fig.(4). The usual Nordheim-Kurnakov relation ziman for a two component system
| (4) |
is not even qualitatively obeyed. Instead a tendency to divergence at 0.33, close to the above mentioned site percolation limit for a simple cubic system of = 0.31 is observed. A percolation dominated resistivity is expected to be described by
| (5) |
with 1.5 1.6 kirkpatrick2 ; shklovskii ; dunn . In our case, 4.210-7 m. A first attempt to fit the data for 0.35 and assuming = 0.31, resulted in = 1.12 0.05, distinctly smaller than expected. The corresponding fit is represented by the dotted line in Fig.(4). A forced fit with = 1.5, shown as the broken line in Fig.(4), results in = 0.29. Although no perfect agreement between theoretical expectations and experiment is achieved in this way, the qualitative behaviour of strongly suggests that percolation plays a dominant role. This is supported by the inset of Fig.(4), where - is plotted versus ( - ) on double logarithmic scales. The solid line represents a power law variation with = 1.5.
Considering that both the Eu-, as well as the Ca-rich regions are conducting, it seems reasonable to inspect whether a phenomenological interpretation of the effective media theory due to Bruggeman bruggeman , treating two or more constituents with different conductivities and different volume fractions , is more appropriate for our case. This approach, due to McLachlan mclachlan1 , yielded very good agreement with experimental results by interpolating between the symmetric and the antisymmetric solution of the Bruggeman model. The scheme retains Bruggeman’s solution in the limiting cases with the correct values for and . For our purpose we consider two components; Eu-rich regions with a volume fraction and a high conductivity , and Ca-rich regions with a volume fraction and a low conductivity . Volume fractions can be converted to atomic fractions by using
| (6) |
where is the atomic bond or site fraction and is the effective ratio of the two volumes. In our case, volume effects are negligible because the lattice parameter changes only by about 1 across the entire series and we may set and . The conductivity of the effective medium is found by solving mclachlan1
| (7) |
where is the scaled conductivity of the effective medium and = = for = , and . Based on this model we attempted to fit the data by assuming = 1.5. The best result, represented by the solid line in Fig.(4), yielded = 8.710-7 m and = 2.610-6 m, respectively. These values are close to and, particularly rewarding, , respectively. The percolation limit turns out to be 0.33, slightly higher than the mentioned site percolation limit.
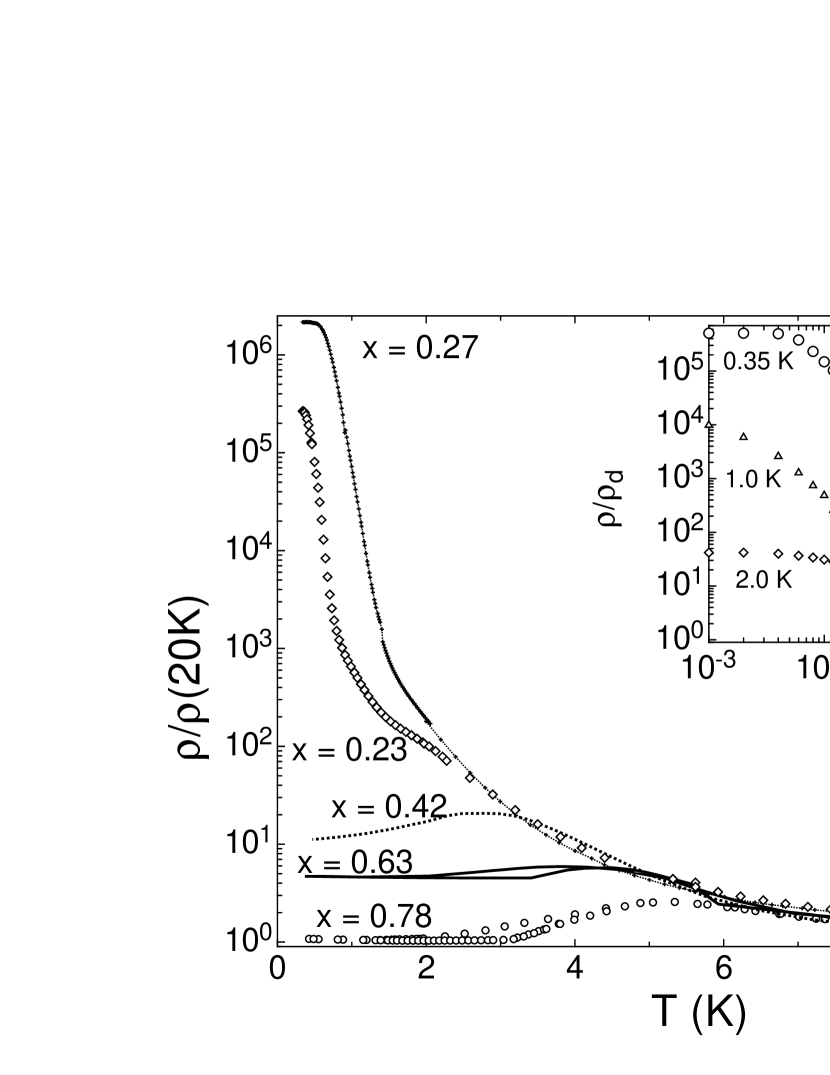
For material with close to but below , we observe remarkable magnetoresistance effects at very low temperatures. In Fig.(5), in zero external magnetic field is shown for specimens with different values of . The materials with = 0.27 and 0.23 do not exhibit long range magnetic order at low temperatures. Instead, spin-freezing type phenomena as evidenced by the results of specific heat and a.c. susceptibility measurements future were observed. It is remarkable, that continues to increase dramatically below the spin-freezing transitions at about 2 K. The inset of Fig.(5) demonstrates that the strong enhancement of at low temperatures can be eliminated by magnetic fields of moderate strength. A more detailed discussion of these data will be published elsewhere. The curves are qualitatively similar to those that were previously reported for manganese oxides of the type (La5/8-yPry)Ca3/8MnO3 uehara . It was claimed that for these materials, intrinsic inhomogeneities due to phase separation are responsible for colossal magnetoresistance effects. A theoretical interpretation of those data, calculating the inverse conductivity for 3D percolative systems mayr , resulted in curves of qualitatively the same shape as those shown in Fig.(5).
We intended to demonstrate that electronic phase separation, related percolation and colossal magnetoresistance phenomena, previously reported for selected oxide compounds uehara , may also be found in systems as simple as the cubic hexaborides. Although we cannot yet provide a convincing link between the different phenomena in our case, ours and previous results indicate a favorable route for future research efforts in relation with colossal magnetoresistance effects.
Stimulating discussions with R. Monnier are gratefully acknowledged. This work has benefitted from partial financial support of the Schweizerische Nationalfonds zur Förderung der wissenschaftlichen Forschung and the US-NSF grant DMR-0203214.
References
- (1) P. Grünberg, R. Schreiber, Y. Pang, M.B. Brodsky, and H. Sowers , Phys. Rev. Lett. 57, 2442 (1986); M.N. Baibich, J.M. Broto, A. Fert, F. Nguyen Van Dau, and F. Petroff, P. Eitenne, G. Creuzet, A. Friederich, and J. Chazelas, Phys. Rev. Lett. 61, 2472 (1988)
- (2) S. Jin, T.H. Tiefel, M. McCormack, R.A. Fastnacht, R. Ramesh, L.H. Chen, Science 264, 413 (1994)
- (3) J.M. De Teresa, A. Barthélémy, A. Fert, J.P. Contour, F. Montaigne, P. Seneor, Science 286, 5349 (1999)
- (4) J.F. Lawler, J.M.D. Coey, J. M. M. Mat. 140, 2049 (1995); H.Y. Hwang, S-W. Cheong, P.G. Radaelli, M. Marezio, and B. Batlogg, Phys. Rev. Letters 75, 914 (1995).
- (5) T. Kasuya, A. Yanase, Rev. Mod. Phys 40, 684 (1968).
- (6) R. Bachmann, K.N. Lee, T.H. Geballe and A. Menth, J. Appl. Phys. 41, 1431 (1970).
- (7) L. Degiorgi, E. Felder, H.R. Ott, J.L. Sarrao, and Z. Fisk, Phys. Rev. Lett. 79, 5134 (1997).
- (8) S. Kirkpatrick, Solid State Comm. 12, 1279 (1973).
- (9) B.I. Shklovskii and A.L. Efros, Sov. Phys.-Usp. 18, 845 (1975).
- (10) B.I. Shklovskii, A.L. Efros, , Springer (1984)
- (11) G.A. Wigger et al., unpublished.
- (12) D. Mandrus, B. C. Sales and R. Jin, Phys. Rev. B64, 12302 (2001).
- (13) G.A. Wigger, R. Monnier, H.R. Ott, D.P. Young and Z. Fisk, cond-mat/0309412.
- (14) K.N.R. Taylor and M.I. Darby, Chapman and Hall LTD, London (1972).
- (15) C. Haas, Phys. Rev. 168, 531 (1968).
- (16) J.M. Ziman, , Clarendon, Oxford (1960).
- (17) S. Kirkpatrick, Rev. Mod. Phys. 45, 574 (1973).
- (18) A.S. Skal, B.I. Shklovskii, A.L. Efros, Fiz. Tverd. Tela 17, 506 (1975).
- (19) A.G. Dunn, J.W. Essam, J.M. Loveluck, J. Phys. C.: Solid State 8, 743 (1975).
- (20) D.A.G. Bruggeman, Z. Phys. 37, 906 (1936), Ann. Phys. 24, 665 (1935) and Ann. Phys. 29, 160 (1937).
- (21) D.S. McLachlan, J. Phys. C: Solid State Phys. 19, 1339 (1986).
- (22) M. Uehara, S. Mori, C.H. Chen and S-W. Cheong, Nature 399, 560 (1999).
- (23) M. Mayr, A. Moreo, J.A. Vergés, J. Arispe, A. Feiguin and E. Dagotto, Phys. Rev. Letters 86, 135 (2001).