Hydrogen-assisted distortion of gold nanowires
Abstract
In this paper the influence of adsorbed hydrogen on the behavior of gold nanojunctions is investigated. It is found, that the hydrogen environment has a strong effect on the conductance of atomic-sized gold junctions, which is markedly reflected by the growth of an additional peak in the conductance histogram at quantum unit, . The statistical analysis of the conductance traces implies that the new peak arises due to the hydrogen-assisted distortion of atomic gold chains.
pacs:
73.63.Rt, 73.23.Ad, 85.65.+hI Introduction
The conductance histograms of different metals have been studied under various experimental conditions.Agrait et al. (2003) It was found, that the peaks in the histogram arise due to the repeated establishment of some stable atomic configurations during the breaking process. Usually the general shape of the histogram is characteristic of the material, and it is not very sensitive to the experimental parameters, like the temperature or the magnitude of the bias voltage.
On the other hand, the interaction of adsorbates with the junction can influence the evolution of the nanocontact during the rupture and can cause drastic changes in the shape of the histogram. It was shown that the adsorption of some organic molecules on copper nanojunctions results in the appearance of new peaks around and quantum conductance unit, G.Li et al. (2000) Similar phenomenon was observed using gold nanowires immersed in an electrochemical cell.Shu et al. (2000) By changing the potential on the nanoconstriction from positive to negative with respect to the reference electrode, the authors observed the appearance and growth of two new peaks, again at and G0.
These studies have shown that the conductance histograms can serve as sensitive detectors of adsorbates. The new peaks in the histogram are assumably caused by the appearance of new, stable atomic arrangements in the modified environment. On the other hand, the conductance histograms alone cannot tell the microscopic background of the phenomenon. The above systems are rather complicated for theoretical calculations, so the origin of the observations has remained an open question.
In this paper we show that similar phenomenon can arise due to the adsorption of hydrogen molecules on gold nanowires. Hopefully, the simplicity of this system will open the opportunity for theoretical studies. We also show, that the detailed statistical investigation of the conductance traces supplies useful information about the nature of the new atomic configurations.
Quite recently, the influence of hydrogen molecules on platinum junctions was also studied.Smit et al. (2002) In this system the characteristic peak of platinum at G0 disappears, and a new peak grows in the histogram at G0. The detailed studies have shown, that the new peak is connected to the conduction through a H2 bridge between the Pt electrodes. The comparison of these results with our observations is presented.
II Basic observation: the appearance of a new peak in the conductance histogram
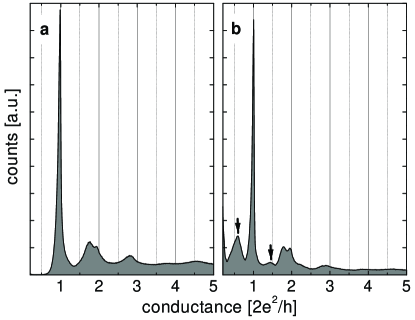
We have performed our measurements on high-purity gold samples with the mechanically controllable break junction (MCBJ) technique. The experiments were done under cryogenic circumstances in the temperature range of K. A typical conductance histogram of gold measured in ultra high vacuum at K is presented in Fig. 1(a). It agrees with earlier reported data obtained under similar conditions.Yanson (2001) The most pronounced feature of this histogram is a sharp peak at G0. The introduction of hydrogen into the vacuum potnot resulted in the appearance of an additional peak positioned close to G0, as shown in Fig. 1(b). In some cases a small peak at G0 was also visible, but due to its eventual occurrence we focus our attention on the peak at G0.
This basic observation was studied in detail by changing three experimental parameters: the temperature, the bias voltage and the amount of H2 near the contact. Even though the quantity of gas admitted into the vacuum pot was accurately determined, no reliable estimation for the H2 coverage of the junction can be given due to the presence of different materials and unavoidable temperature gradients in the sample holder. Fortunately, the results of the measurements were not sensitive to the precise amount. In contrast, the other two parameters played a rather crucial role and the new peak in the histogram was only observed in a restricted range of the temperature and the bias voltage.
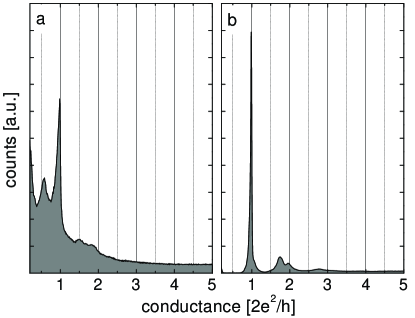
The study of the temperature dependence showed that the fractional peak is only present in the range of approximately K. The bias dependence of the conductance histograms measured at a fixed temperature ( K) is shown in Fig. 2. At bias voltages mV the peaks of the histogram are superimposed on a large featureless background [Fig. 2(a)]. At higher bias, both the background and the relative amplitude of the peak at G0 compared to the one at G0 decrease [Fig. 1(b)]; and finally above mV the peak at G0 completely disappears [Fig. 2(b)]. The absence of the new peak at elevated temperature or bias voltage is presumably caused by the desorption of hydrogen from the surface of the junction. These two effects can have the same origin: at elevated bias the voltage-induced heating of the junctionHalbritter et al. (2002) causes the desorption. At low temperatures the vapor pressure of hydrogen is very small, so the amount of hydrogen near the contact is strongly reduced.
The same measurements were performed on silver and copper contacts. In high vacuum the histograms of these noble metals are resembling the one of gold.Yanson (2001) The inclusion of hydrogen resulted in a similar behavior with respect to the appearance of a featureless background at low bias voltage. On the other hand, in Ag and Cu no indication for the appearance of a new peak was observed.
Summarizing the experimental results, the addition of H2 to the contact area has two basic observable consequences: (1) the growth of a large background signal at low bias voltage which is present for all the materials investigated; (2) the appearance of a new peak at G0 in the conductance histogram of gold.
The first phenomenon is presumably caused by a large amount of H2 between the electrodes. Due to the adsorption of hydrogen, the surface energy of the junction is reduced. From this reason, a larger amount of atomic configurations might occur during the break. It is also possible that an increased tunnel current can flow through the hydrogen layers.
The second phenomenon – which is in the focus of the present study – indicates the repeated establishment of a special atomic configuration during the last stages of the break. This atomic configurations arises or becomes stable due to the surrounding hydrogen molecules. The analysis of the conductance traces can provide information about the nature of this new atomic configuration, as discussed in the following.
III The nature of the conductance traces
In pure gold contacts the conductance plateau at G0 is a robust feature. The conductance traces contain this plateau almost without exception. Furthermore, this is the last plateau, after which the contact breaks. This plateau is very flat, very long, and usually it is precisely positioned at G0. These features are reflected by the exceptionally sharp peak in the conductance histogram [Fig. 1(a)]. There is some chance for having smaller conductance values down to G0, but below that there are absolutely no counts in the histogram.
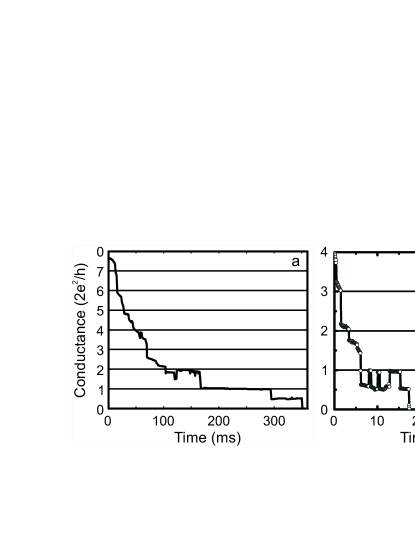
The appearance of a new peak around G0 raises the question, how these strong features of the conductance traces of pure gold are modified in the presence of hydrogen. Naturally, the traces must contain plateaus both at G0 and at G0. However, the conductance histogram alone cannot tell how these plateaus are related to each other. Figure 3(a) shows a conductance trace extracted from the data set. It has plateaus at both conductance values: first the conductance stays at G0, then it jumps to G0, and finally the contact breaks. This kind of behavior was frequent, but not exclusive. Another two examples are presented in Fig. 3(b). These traces show a telegraph fluctuation between G0 and G0. This telegraph fluctuation implies that the contact can choose from two metastable atomic configurations. The one with unit conductance is assumably the customary atomic arrangement of pure gold. The other one with G0 is another – yet unknown – configuration which is only observable if hydrogen molecules are also present. It should be noted that plateaus at G0 are not seen in each trace, several conductance curves look like those in pure gold contacts. On the other hand, traces with plateau at G0 and no plateau at G0 were not typical.
The plateaus are not precisely placed at G0 and G0, which is indeed expected from the finite width of the peaks in the histogram. The peak at G0 grows above the interval G0, while the peak at G0 grows above G0. So all the plateaus in the first interval are regarded as plateaus near G0, while the plateaus in the second interval are taken as plateaus near G0.
Further on the lengths of these two types of plateaus are analyzed with statistical methods.
IV Exploring correlations between the peaks in the histogram
As a first step, we investigate those traces for that the plateau at G0 is long. The length of this plateau was determined for each trace by counting the number of data points in the conductance interval . The data set of Fig. 1(b) contained conductance traces. From that those traces were selected, which have the longest plateau at G0. The histogram for these selected curves is shown in Fig. 4 by the area graph. This histogram is compared with the histogram for the whole data set, as shown by the dashed line. In order to have a good comparison, both histograms were normalized to the number of traces included.
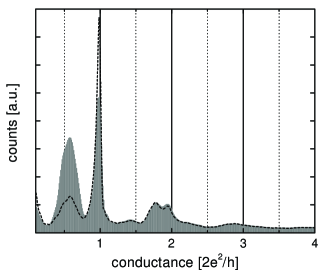
For the selected curves the peak at G0 is significantly larger, which is a natural consequence of the selection. The interesting result of this comparison is the shrinking of the peak at G0 by more than % due to the selection. The rest of the structures at higher conductance values are exactly the same on the two histograms.
This analysis shows that the traces with long plateaus at G0 have a smaller peak at G0 in the histogram; or in other words, if the plateau at G0 is longer than in average then the plateau at G0 is shorter than in average. This kind of anticorrelation implies that the summed length of the both plateaus is important, and the switching between them is probably a random process. This remark will have special importance in the next part, where the histograms for the plateau lengths are investigated.
V Plateau length histograms
The measurements in a pure environment have shown, that a single atom gold contact has a single conductance channel with perfect transmission.Scheer et al. (1998); Ludoph et al. (1999) Furthermore it was found that gold can form atomic chains with single atoms in a row,Yanson et al. (1998) and this chain also has a perfect transmission.Rubio-Bollinger et al. (2003) The existence of these atomic chains was deduced from histograms plotted for the lengths of the last plateaus before break. These histograms revealed equidistant peaks, corresponding to the break of chains with different number of atoms. Therefore the question must be addressed, to what extent this chain formation is influenced by the presence of hydrogen.
As it was mentioned, even in hydrogen surrounding, a lot of traces just exhibit plateaus at G0 without any additional plateau around G0. These traces can be regarded as “pure gold behavior”, and the plateau length histogram for these traces can serve as a reference [Fig. 5(a)]. This histogram shows two well-defined peaks. This means that the process of chain formation is present, but no really long chains are pulled. It should be noted, that in metals that cannot form chains the plateau length histogram shows only a single peak. The distance between the two peaks in Fig. 5(a) defines the Au-Au distance in the chain.
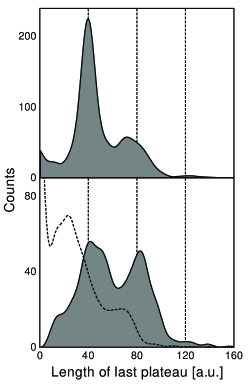
We can also plot the plateau length histogram for the traces that have a plateau around G0 as well. The anticorrelation demonstrated in the previous part implies that the summed length of the plateaus at G0 and at G0 is important. Therefore, as a first step the plateau length is measured for each trace by the number of data points in the conductance interval . The plateau length histogram built in this way is presented by the area graph in Fig. 5(b). The position of the peaks coincides with the reference histogram. The plateau length histogram for the same traces can be plotted by measuring just the lengths of the plateaus at G0. (In this case the plateau length is the number of data points in the conductance interval ) This analysis results in the histogram shown by the dashed line. In this histogram the peaks are smeared and considerably shifted compared to the reference histogram.
A plateau at G0 in a conductance trace is a clear sign, that the break of the nanojunction is influenced the hydrogen molecules. The two peaks in the plateau length histogram in Fig. 5(b) indicate that even in this case the chain formation of gold is preserved. Furthermore, a nice plateau length histogram is only obtained if the plateaus at G0 are also included in the plateau length. This indicates that the atomic configuration with G0 is a part of the chain formation.
VI Discussion of the observations
Our measurements have shown, that the adsorption of hydrogen on gold junctions results in the appearance of a new peak at G0 in the conductance histogram. The same phenomenon was not observed in silver and copper junctions, which have conduction properties similar to gold. An important difference between the nobel metals is the striking property that gold can form atomic chains while Ag and Cu cannot.Smit et al. (2001) It has already implied that the new peak at G0 is somehow connected to the chain formation of gold. This assumption was further supported by the investigation of plateau length histograms. This analysis has shown that the configuration with G0 is indeed a part of the chain formation.
Local density functional simulations have shown that a small increase in the interatomic distance in a Au chain causes a considerable reduction of the conductance.Häkkinen et al. (1999) This implies, that the configuration with perfect transmission is the usual gold chain, while the conductance value of G0 corresponds to a distorted chain with slightly increased Au-Au distance.
This distortion can be an intrinsic property of gold, which is just aided by the hydrogen environment. It was shown that stretched atomic chains have a tendency for spontaneous dimerization. Torres et al. (1999); Okamoto and Takayanagi (1999); Häkkinen et al. (1999, 2000); Maria and Springborg (2000) Calculations of the conductance through a short chain of gold atoms with a dimer yield values from G0 Häkkinen et al. (1999) to G0.Okamoto and Takayanagi (1999) Such dimers have never been observed in high vacuum, but the adhesive hydrogen environment might stabilize this configuration. A crucial problem with this interpretation is the following. In a process called “dimerization” at least three atoms should be included in the chain. In our measurements the occurrence of such long chains was not frequent (see the plateau length histograms in Fig. 5), so a plausible explanation should also account for the distortion of a chain with two atoms.
As another possibility, the binding of the hydrogen molecule on the chain itself might cause the distortion. The precise nature of such process cannot be predicted without microscopic model calculations. The possibility of the chemical reaction of H2 with the gold chain also cannot be excluded.
The measurements on hydrogen covered platinum junctions have demonstrated that the new peak in the histogram is connected to the conductance through a hydrogen molecule.Smit et al. (2002) In gold the plateau length histograms strongly indicate that the conductance values near G0 are related to chains of gold atoms; therefore, the same explanation is not supported. A similar analysis of the plateau length histograms can also be performed on platinum, which has the tendency of chain formation as well. Our measurements have shown that in Pt the chain formation is completely destroyed in the presence of hydrogen.
In conclusion, we have shown that a new stable atomic configuration appears in gold nanojunctions due to the adsorption of hydrogen. The analysis of the results implies that this configuration is related to a distorted chain of gold atoms. Presently, the experimental observations cannot provide more information about the nature of this configuration. Hopefully, the simplicity of the gold-hydrogen adsorbate system will stimulate extensive theoretical investigations, which will lead to a better understanding of the details of molecular adsorption on nanowires.
This work has been supported by the “Stichting FOM” and the Hungarian research funds OTKA TS040878, T037451.
References
- Agrait et al. (2003) N. Agrait, A. L. Yeyati, and J. M. van Ruitenbeek, Phys. Rep. 377, 81 (2003).
- Li et al. (2000) C. Z. Li, H. X. He, A. Bogozi, J. S. Bunch, and N. J. Tao, Appl. Phys. Lett. 76, 1333 (2000).
- Shu et al. (2000) C. Shu, C. Z. Li, H. X. He, A. Bogozi, J. S. Bunch, and N. J. Tao, Phys. Rev. Lett. 84, 5196 (2000).
- Smit et al. (2002) R. H. M. Smit, Y. Noat, C. Untiedt, N. D. Lang, M. C. van Hemert, and J. M. van Ruitenbeek, Nature 419, 906 (2002).
- Yanson (2001) A. I. Yanson, Ph.D. thesis, Universiteit Leiden, The Netherlands (2001).
- (6) The admitted amount of H2 was between molemmole.
- Halbritter et al. (2002) A. Halbritter, S. Csonka, O. Y. Kolesnychenko, G. Mihaly, O. I. Shklyarevskii, and H. van Kempen, Phys. Rev. B 65, 45413 (2002).
- Scheer et al. (1998) E. Scheer, N. Agrait, J. C. Cuevas, A. L. Yeyati, B. Ludoph, A. Martín-Rodero, G. R. Bollinger, J. M. van Ruitenbeek, and C. Urbina, Nature 394, 154 (1998).
- Ludoph et al. (1999) B. Ludoph, M. H. Devoret, D. Esteve, C. Urbina, and J. M. van Ruitenbeek, Phys. Rev. Lett. 82, 1530 (1999).
- Yanson et al. (1998) A. I. Yanson, G. R. Bollinger, H. E. van den Brom, N. Agrait, and J. M. van Ruitenbeek, Nature 395, 783 (1998).
- Rubio-Bollinger et al. (2003) G. Rubio-Bollinger, C. de las Heras, E. Bascones, N. Agrait, F. Guinea, and S. Vieira, Phys. Rev. B 67, 121407 (2003).
- Smit et al. (2001) R. H. M. Smit, C. Untiedt, A. I. Yanson, and J. M. van Ruitenbeek, Phys. Rev. Lett. 87, 266102 (2001).
- Häkkinen et al. (1999) H. Häkkinen, R. N. Barnett, and U. Landman, J. Phys. Chem. B 103, 8814 (1999).
- Torres et al. (1999) J. A. Torres, E. Tosatti, A. D. Corso, F. Ercolessi, J. J. Kohanoff, F. D. D. Tolla, and J. M. Soler, Surface Science 426, L441 (1999).
- Okamoto and Takayanagi (1999) M. Okamoto and K. Takayanagi, Phys. Rev. B 60, 7808 (1999).
- Häkkinen et al. (2000) H. Häkkinen, R. N. Barnett, A. G. Scherbakov, and U. Landman, J. Phys. Chem. B 104, 9066 (2000).
- Maria and Springborg (2000) L. D. Maria and M. Springborg, Chem. Phys. Lett. 323, 293 (2000).