Dilute ferrimagnetic semiconductors in Fe-substituted spinel ZnGa2O4
Abstract
Solid solutions of nominal composition [ZnGa2O4]1-x[Fe3O4]x, of the semiconducting spinel ZnGa2O4 with the ferrimagnetic spinel Fe3O4 have been prepared with = 0.05, 0.10, and 0.15. All samples show evidence for long-range magnetic ordering with ferromagnetic hysteresis at low temperatures. Magnetization as a function of field for the = 0.15 sample is S-shaped at temperatures as high as 200 K. Mössbauer spectroscopy on the = 0.15 sample confirms the presence of Fe3+, and spontaneous magnetization at 4.2 K. The magnetic behavior is obtained without greatly affecting the semiconducting properties of the host; diffuse reflectance optical spectroscopy indicates that Fe substitution up to = 0.15 does not affect the position of the band edge absorption. These promising results motivate the possibility of dilute ferrimagnetic semiconductors which do not require carrier mediation of the magnetic moment.
pacs:
75.50.Pp, 75.50.Gg, 78.20.-e1 Introduction
The burgeoning field of spintronics [1, 2] has created demands for entirely new classes of materials. One such materials class combines both semiconducting and ferromagnetic properties. Magnetic semiconductors can help in the efficient injection of spin from a ferromagnetic contact to a semiconductor.[3] The substitution of magnetic ions such as Mn3+ in traditional semiconducting materials such as GaAs is a well-established route to making ferromagnetic semiconductors.[4, 5] However Mn-substituted GaAs as well as digital heterostructures such as GaAs/0.5ML-Mn [6] have maximum Curie temperatures of around 100 K or less. In the ideal case, we desire magnetic semiconductors with a magnetic transition above room temperature. The ability to have both - and -type doping, a long spin-relaxation lifetime, and large carrier spin-polarization are other desirable features. Proposed candidate materials are strongly hole-doped wide band gap wurtzite semiconductors GaN and ZnO, with magnetic transition metal tM substituents on the cation sites.[7, 8] A number of recent studies on bulk and thin-film samples have ensued which suggest that ZnO:tM with tM = Co [9, 10, 11] and with tM = Mn [12, 13] are ferromagnetic at room temperature, whilst others find spin-glass behavior. [14, 15]
Results of our prior work on bulk samples of ZnO:tM systems suggest a complete absence of any magnetic ordering in well-characterized bulk samples.[16, 17] Studies by Kolesnik et al. and coworkers confirm these findings.[18] Careful density functional calculations by Spaldin [19] also point to difficulties in inducing ferromagnetism by transition metal substitution in ZnO. We find that while magnetic susceptibility indicates strong near-neighbor coupling in ZnO:tM (tM = Mn and Co), the mean-field coupling is exceedingly weak.[17] It is the mean field term that would dictate magnetic ordering. It is useful to temper expectation with the following observation: the few known ferromagnetic oxide semiconductors have rather low s: BiMnO3 ( = 105 K), [20] SeCuO3 ( = 26 K), [21] YTiO3 ( = 29 K), [22] EuO ( = 79 K).[23]
A promising alternative is to induce ferrimagnetism in a wide band gap semiconductor with two host cation sites: this would exploit the more natural tendency of spins in insulating oxides to anti-align and would require no conduction electrons. A natural structure for ferrimagnetism is spinel, AB2O4, where spins in the tetrahedral (A) and octahedral (B) cation sites are usually anti-aligned with respect to each other; in addition, with two B sites for every A site, the possibility of a net ferrimagnetic moment exists. Figure 1 shows the cation network centered around a single tetrahedral A cation in the spinel structure. The very high effective cation coordination in this structure type would mean that even at rather low concentrations of substituent transition metal ions, extensive magnetic coupling can be expected. In this contribution, we have chosen spinel ZnGa2O4 with a direct band gap of 4.1 eV as host.[24] Both ZnGa2O4 as well as ZnO can be grown epitaxially on spinel MgAl2O4 substrates [25, 26], suggesting that the title compound can be incorporated in devices.
By preparing nominal solid solutions [ZnGa2O4]1-x[Fe3O4]x (), we have been able to induce magnetism, with strongly hysteretic behavior for the = 0.15 sample at 5 K. Mössbauer spectra acquired at 293 K and 4.2 K on the = 0.15 sample suggests spontaneous magnetization at 4.2 K. The data also reveal the complete absence of Fe2+ in the sample, which supports our view of dilute ferrimagnetism rather than magnetism arising from a spurious source such as magnetite Fe3O4 nanoparticles in a ZnGa2O4 matrix. Diffuse reflectance UV/Vis spectroscopy reveals that the direct band gap of ZnGa2O4 is unaffected by substitution.

2 Experimental
As in previous work on polycrystalline Zn1-xMxO materials [16, 17] precursor oxalates Zn1-xFex(C2O4)2H2O were prepared with = 0.00, 0.02, 0.05, 0.10, and 0.15 by precipitation from aqueous solution. Polycrystalline samples with the nominal compositions [ZnGa2O4]1-x[Fe3O4]x ( were made by grinding together the corresponding oxalate with appropriate amounts of Ga2O3 and decomposing in air at 1473 K for 18 hrs., with an intermediate regrinding step. For = 0.00, the powder is white; as increases, the powder colors range from beige to auburn. Beyond = 0.15, samples require longer sintering times, suggesting a possible solubility limit in the vicinity. Step-scanned X-ray diffraction data on the powders were collected on a Scintag X-2 diffractometer operated in the - geometry. Transmission electron microscopy of the = 0.15 sample, in conjunction with energy dispersive X-ray spectroscopic (EDX) analysis was carried out on a JEOL JEM 2010 microscope. The sample powder was dispersed from a solvent on to a carbon-coated copper grid for TEM studies. UV/Vis diffuse reflectance spectra were acquired on powders sprinkled on scotch tape. Magnetization data were collected on a Quantum Design MPMS 5XL SQUID magnetometer operated between 2 K and 400 K. Mössbauer spectra were collected at 293 K and 4.2 K using a constant-acceleration spectrometer equipped with a 1024 channel analyzer and operated in the time scale mode. The source was 25 mCi 57Co/Rh. The spectra were analyzed using the computer program effino.[27]
3 Results and discussion
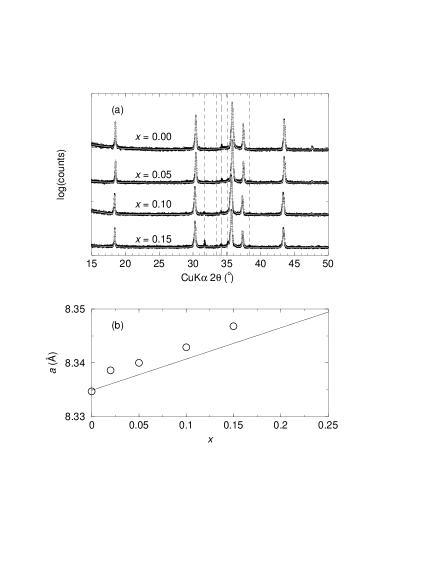
X-ray diffraction data, plotted on a log scale in Figure 2(a), indicate a very small as-yet unidentified impurity at 34.2∘ 2 in all the samples, including the non-magnetic host ZnGa2O4. In addition, the = 0.15 sample has a small impurity of monoclinic Ga2O3 (PDF Card 41-1103). Other than these clearly non-magnetic impurities, the samples are clean showing only the spinel phase. The diffraction profiles could be satisfactorily fit to the spinel crystal structure by the Rietveld method using the xnd program.[28] For all the samples, reliability factor () was less than 7%. The evolution of the cell parameter with is shown in Figure 2(b) and is consistent with substitution of Fe on the spinel ZnGa2O4 lattice. The line connects published cell parameters of ZnGa2O4 [29] and Fe3O4.[30] Under the conditions of our preparation, Fe3O4 is stable under the heat treatment conditions which we have employed,[31] so we were initially confident in describing the Fe substitution as a solid solution [ZnGa2O4]1-x[Fe3O4]x. However, as we shall describe presently, Mössbauer spectra indicate a complete absence of Fe2+ in the = 0.15 sample. We do see a small broadening of the X-ray profiles with substitution characteristic of the increased number of elements in the crystal. The X-ray form factors of Fe, Zn and Ga are too similar to one-another for us to directly refine the relative amounts of these elements in the spinel crystal structure.
TEM/EDX analysis of the = 0.15 sample systematically indicated that the Fe:Zn:Ga atomic ratio was close to 1:3:6 rather than the ratio calculated from the nominal composition which is 1:1.9:3.8, or nearly 1:2:4. More importantly, the samples are homogeneous on the length scale of the EDX spot size (approximately 3 nm), consistently displaying the same ratios over several spots.
Across the substitution series, the semiconducting nature of ZnGa2O4 is retained as confirmed by UV/Vis diffuse-reflectance spectroscopy. Diffuse reflectance UV/Vis spectra across the series are shown in Figure 3. ZnGa2O4 is a direct band gap semiconductor,[24] as confirmed by the sharp band-edge absorption. In our samples we find the band edge is at 3.3 eV rather than the reported value of 4.1 eV. However, it is well known[24] that ZnGa2O4 displays a very sensitive dependence of the optical absorption edge on composition, and a very small concentration of cation vacancies are sufficient to shift the edge to the red. Substitution by iron leaves the band-edge absorption unchanged, though new features associated with atomic transitions arise in the visible region. The relative rise of these new features in the visible region of the spectrum results in an effective relative decrease in the intensity of the band-edge absorption.

Figure 4(a) shows the temperature dependence of the magnetization of three samples, = 0.05, 0.10, and 0.15. The magnetization has been scaled by the mole number of Fe3O4; implying that in the absence of long-range interactions, traces for the three samples should collapse on a single curve. We do not observe this even at 400 K. Plots of as a function of are not linear for any of the samples below 400 K, also in accord with the existence of long-range interactions. All three samples show a separation of the ZFC and FC traces. This is clearly visible for = 0.10 and = 0.15 at about 100 K. At 5 K, all three samples display hysteretic behavior as seen in Figure 4(b). None of the samples show magnetic saturation indicating that a certain fraction of the spins are “free” and are not involved in the ordering. If we assume that Fe substitutes on ZnGa2O4 as an alloy with Fe3O4, then the saturation magnetization should be 4 per Fe3O4. If we take the minimum magnetic saturation value to be the point where the hysteresis loop closes, then for = 0.15, this value is about 1 per Fe3O4 at 5 K. Therefore, to a good approximation, 25% of the substituted Fe completely participate in the bulk ferrimagnetism.

Figure 5 displays magnetization for = 0.15 as a function of the scaled field () at three different temperatures, (a) 2 K, (b) 5 K, and (c) 200 K. At the two lower temperatures, hysteretic behavior is observed. The hysteresis is lost by about 100 K, but even at 200 K, magnetization as a function of field indicates long range ordering. The nature of the magnetization loops would suggest superparamagnetic behavior with a blocking temperature of around 100 K. However, superparamagnetism would imply that plots of as a function of would collapse on to a single S-shaped trace above the blocking temperature. We do not find this. Figure 5(d) shows the temperature dependence of the magnetic coercivity of = 0.15, which grows almost exponentially as the temperature is lowered. At 5 K, the coercivity is about 250 Oe, to be compared with a value of 420 Oe for Fe3O4.[32]

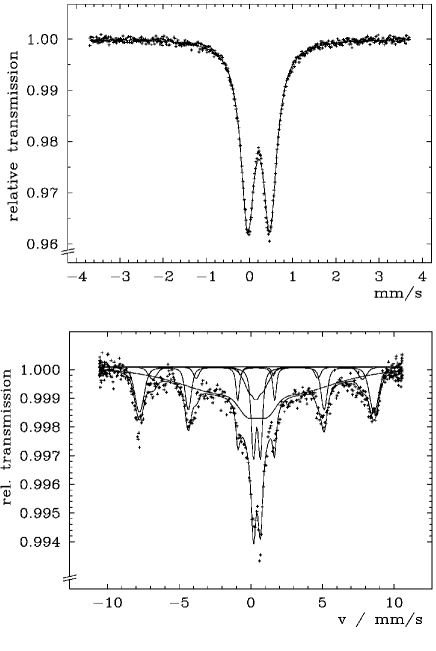
Mössbauer spectra were acquired at room temperature (293 K) on = 0.05 sample and the = 0.15 sample. For both samples, the isomer shift with respect to Fe metal was 0.32 mm s-1 and the quadrupolar splitting was 0.52. Neither sample showed, at 293 K, the 6-finger pattern characteristic of magnetic ordering. At 4.2 K, the = 0.15 sample displayed both a doublet corresponding to paramagnetic Fe3+ and a 6-finger pattern corresponding to magnetically ordered Fe3+. The internal field is between 250 and 510 Oe, consistent with the magnetization data. From the Mössbauer fit to the para and ferromagnetic phases at 4.2 K, a relative ratio of 10% (paramagnetic) to 90% (ferromagnetic) was obtained. Mössbauer data and the fit to different components, acquired on the = 0.15 sample are shown in Figure 6. The relative distribution of Fe3+ on octahedral and tetrahedral sites could not be obtained from the present set of experiments. Experiments are planned in future with labeled 57Fe in order to obtain higher resolution data that will allow the Fe ion site selection to be probed.
The title compounds have random substitution of ferric ions, presumably on both the tetrahedral and octahedral sites in the semiconducting host spinel structure. Since there are twice as many octahedral sites as there are tetrahedral sites, if the spins behave as they do in bulk Fe3O4, ferromagnetism can ensue. We believe this to be at the origin of the observed magnetic behavior. Further Mössbauer studies as well as powder neutron diffraction measurements are planned in order to better characterize the title compounds. Our results suggest that dilute ferrimagnetic semiconductors are worthy objects of study.
References
- [1] Awschalom D D, Flatte M E and Samarth N 2002 Sci. Am. (Int. Ed.) 286 66
- [2] Das Sarma S 2001 Am. Sci. 89 516
- [3] Rashba E I 2000 Phys. Rev. B. 61 R16267
- [4] Ohno H 1998 Science 281 951
- [5] Ohno H 1999 J. Magn. Magn. Mater. 200 110
- [6] Kawakami K, Johnston-Halperin E, Chen L F, Hanson M, Guebels N, Speck J S, Gossard A C, and Awschalom D D 2000 Appl. Phys. Lett. 77 2379
- [7] Dietl T, Ohno H, Matsukara F, Cibért J and Ferrand D 2000 Science 287 109
- [8] Pearton S J, Abernathy C R, Overberg M E, Thaler G T, Norton D P, Theodoropolou N, Hebard A F, Ren F, Kim J and Boatner L A 2003 J. Appl. Phys. 93 1
- [9] Ueda K, Tabata H and Kawai, T 2001 Appl. Phys. Lett. 79 988
- [10] Kim J H, Kim, H, Kim D, Ihm Y and Choo W K 2003 Physica B 327 304
- [11] Lim S W, Hwang D K and Myoung J M 2003 Solid State Commun. 125 231
- [12] Sharma P, Gupta A, Owens F J, Rao K V, Sharma R, Ahuja R, Guillen J M O, Johannson B and Gehring G A 2003 Nature Mater. 2 673
- [13] Heo H W, Ivill M P, Ip K, Norton D P, Pearton S J, Kelly J G, Rairigh R, Hebard A F and Steiner T 2004 Appl. Phys. Lett. 84 2292
- [14] Fukumura T, Jin M, Kawasaki T, Shono T, Hasegawa T, Koshihara S and Koinuma, H. Appl. Phys. Lett. 78 958
- [15] Kolesnik S, Dabrowski B and Mais J 2002 J. Supercond. 15 251
- [16] Risbud A S, Spaldin N A, Chen Z Q, Stemmer S and Seshadri R 2003 Phys. Rev. B 68 205202
- [17] Lawes G, Risbud A S, Ramirez A P and Seshadri R cond-mat/0403196
- [18] Kolesnik S, Dabrowski B, and Mais J 2004 J. Appl. Phys. 95 2582
- [19] Spaldin N A 2004 Phys. Rev. B 69 125201
- [20] Chiba H, Atou T and Syono Y 1997 J. Solid State Chem. 132 139
- [21] Kohn K, Inoue K, Horie O and Akimoto S-I 1976 J. Solid State Chem. 18 27
- [22] Garrett J D, Greedan J E and MacLean D A 1981 Mater. Res. Bull. 16 145
- [23] Matthias B T, Bozorth R M and van Vleck J H 1961 Phys. Rev. Lett. 7 160
- [24] Sampath S K and Cordaro F 1998 J. Am. Ceram. Soc. 81 649
- [25] Andeen D, Loeffler L, Padture N and Lange F F 2003 J. Crys. Growth 259 103
- [26] Loeffler L and Lange F F 2004 J. Mater. Res. 19 902
- [27] Spiering H, Deak L, Bottyan L 2000 Hyperfine Interactions 125 197.
- [28] Bérar J F and Garnier P 1992 computer code XND available from the website at http://www.ccp14.ac.uk
- [29] Josties M, O’Neill H S C, Bente K and Brey G 1995 Neus Jahr. Mineral. Monat. 273
- [30] Fleet M E 1982 Acta Crystallogr. B 38 1718
- [31] Sundman B 1991 J. Phase Equil. 127
- [32] Smirnov A V and Tarduno J A 2002 Earth Planet. Sci. Lett. 194 359