Optical properties, electron-phonon coupling, and Raman scattering of vanadium ladder compounds
Abstract
The electronic structure of two V-based ladder compounds, the quarter-filled NaV2O5 in the symmetric phase and the iso-structural half-filled CaV2O5, is investigated by ab initio calculations. Based on the bandstructure we determine the dielectric tensor of these systems in a wide energy range. The frequencies and eigenvectors of the fully symmetric Ag phonon modes and the corresponding electron-phonon and spin-phonon coupling parameters are also calculated from first-principles. We determine the Raman scattering intensities of the Ag phonon modes as a function of polarization and frequency of the exciting light. All results, i.e. shape and magnitude of the dielectric function, phonon frequencies and Raman intensities show very good agreement with available experimental data.
pacs:
71.15.Mb, 63.20.Kr, 78.30.-j, 71.27.+aI Introduction
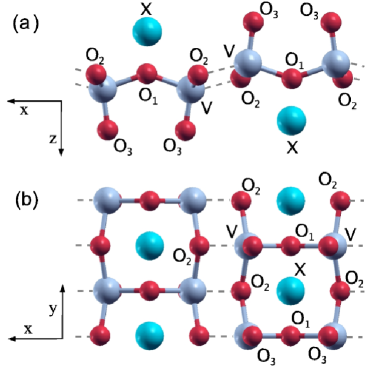
The vanadium-based ladder compounds NaV2O5 and CaV2O5 are interesting examples of systems where charge, spin, and lattice degrees of freedom are coupled to each other. Like materials with magnetically active Cu ions forming ladder-like structures,Dagotto96 ; Lemmens99 they show unusual physical properties due to a strong interaction of all degrees of freedom. The main building block of their unit cells is a ladder formed by V-O rungs and V-O legs, as it is shown in Fig. 1. Both materials crystallize in the orthorhombic space group () with two formula units per unit cell.
Electrons in these systems can move within a rung, between rungs within a ladder, and between different ladders. The upper occupied electron states are formed by electrons of V with a slight admixture of oxygen orbitals. In NaV2O5, one electron of V is shared by two sites within a rung which leads to a quarter-filled characterSmolinski98 and makes this compound a dielectric, since the hopping of an electron between two rungs, which would produce a doubly occupied and an empty rung, requires more energy than can be provided by the hopping matrix element along the ladders. At a critical temperature close to 35 K, NaV2O5 undergoes a transition to a spin-gapped state, as first reported by Isobe and Ueda in Ref. Isobe96, based on the analysis of magnetic susceptibility measurements. Evidence for such a transition was also obtained in Raman scattering experiments.Weiden97 This behavior, in some aspects analogous to the spin-Peierls transition observed in the inorganic chain compound CuGeO3 at K, Hase93 is accompanied by a disproportion of the V charges (), a relatively large lattice distortion, and the formation of an ordered charge pattern. At the ions are displaced from their equilibrium positions in the high-temperature phase by distances of the order of 0.05 Å. These displacements which give evidence for a strong electron-lattice coupling have been observed in X-ray diffractionLuedecke99 ; Smaalen02 ; Nakao00 and can be estimated from infrared Popova02 and Raman scattering experiments.Fischer99 They stabilize the zig-zag ordered phase,Seo98 ; Mostovoy00 being probably the crucial element that determines the physics of the charge ordering in this compound. At the same time, the coupling to dynamical phonons induces strong charge fluctuations near which alter the spin-spin exchange .Sherman99 Also the ordering is not completely static, even at low temperatures, since it is influenced by lattice vibrations, as was found in electron spin-resonance experiments.Nojiri00 At the same time, one could expect that charge ordering accompanied by a lattice distortion will show up, for example, in the dielectric function with decreasing temperature. However, a comparison of optical spectra taken at the low- and high-temperature phase, respectively, exhibits only small differences below ,Presura00 while Raman spectra reveal large changes in the electronic background and show many new peaks which could have either magnetic or phononic origin when going below .Fischer99 New peaks are also clearly seen in the low-temperature infrared spectra.Popova02 A full understanding of these new modes is still lacking.
In CaV2O5, each V ion has spin and it can therefore be described by a generalized Heisenberg model of the spin-spin interaction. In this case, phonons directly influence the exchange constants, and, therefore, lead to a modification of the magnetic properties. The spin gap in this compound, arising due to different exchange along the legs and along the rungs, is of the order of 500 K (0.05 eV).Iwase86 We mention that the Heisenberg spin-spin exchange parameters and, in turn, the strength of spin-phonon coupling depend on the electron on-site energies and the hopping matrix elements which form the bandstructure and influence the dielectric function. For this reason, the experimental and theoretical investigation of the optical conductivity, the lattice dynamics, and the electron-phonon and spin-phonon coupling can provide a clue to the properties of NaV2O5 and CaV2O5 and shed light on the origin of the phase transition in the former.
NaV2O5 and CaV2O5 have been the subject of intensive theoretical investigations, both by first principles based on density functional theory (DFT) and by model calculations.Horsch98 ; Yushankhai01 ; Hubsch01 ; Aichhorn02 ; Mostovoy02 ; Vojta01 In first-principles calculations, the tight-binding linear muffin-tin orbitals (LMTO) methodPopovic99 ; Yaresko00 in the atomic sphere approximation (ASA) and the linear combination of atomic orbitals Wu99 (LCAO) approach, which directly included the Hubbard repulsion on the V sites, were applied to investigate the bandstructure of NaV2O5. More recently, Mazurenko et al. Mazurenko02 combined DFT calculations with dynamical mean field theory aiming at understanding the insulating behavior of this compound in the high-temperature phase. The tight-binding LMTO method was also applied to CaV2O5 to obtain the spin exchange and effective four-band tight-binding model parameters for this compound.Korotin00 In addition, approaches based on quantum chemistry Bernert00 ; Suaud00 ; Suaud02 ; Hozoi02 have been applied to NaV2O5. An interesting feature of the approaches used in Refs. Suaud02, and Hozoi02, is that being based on the strong coupling of V and O1- orbitals, they attribute the phase transition to the ordering of the spin rather than the charge subsystem.
While the bandstructures of NaV2O5 and CaV2O5 are rather well understood on the first-principles basis, the analysis of their optical properties, lattice dynamics, electron-phonon coupling and Raman scattering still rely on various model assumptions. Having been well investigated experimentally, these properties require a detailed theoretical treatment which does not depend on such assumptions. Moreover, the outcome of DFT calculations is further used as realistic input parameters for model calculations such as Quantum Monte Carlo or Exact Diagonalization techniques.Aichhorn03 ; Gabriel03
As far as NaV2O5 is concerned, in this paper we concentrate on the high-temperature phase where V ions in the rungs are equivalent. This enables us to understand its main properties and provides a starting point for the investigation of the low-temperature phase. Since in CaV2O5 no structural phase transition is observed, our treatment there holds at any temperature. The paper is organized as follows: In Section II, we describe the method of calculation and present the bandstructure for NaV2O5 and CaV2O5 and related results like the density of states and the charge density. We provide the calculated dielectric tensor components () for these two compounds in Section III. Section IV includes theoretical phonon frequencies and eigenvectors, as well as electron-phonon and spin-phonon coupling parameters. The phonon-induced changes in the dielectric function and the corresponding phonon Raman spectra will be presented in Section V. Finally, a summary of the results and suggestions for further investigations are given in the Conclusions.
II Calculations of the electronic structure
II.1 Computational Methods
All bandstructure calculations are performed within density functional theory (DFT) using the full-potential augmented planewaves + local orbitals (FP-APW+lo) Sjostedt00 formalism implemented in the WIEN2k code.wien2k Exchange and correlation terms are described within the generalized gradient approximation (GGA).Perdew96 The atomic sphere radii are chosen as 1.6 a.u. for V, 1.4 a.u. for the O atoms and Na, and 1.5 a.u. for Ca. In both compounds, all atomic positions have been relaxed starting from the experimentally measured ones as given in Ref. Onoda96, for CaV2O5 and Ref. Smolinski98, for NaV2O5. In NaV2O5, for example, the shifts of the ions due to the relaxation of the structure are up to approximately 0.015 Å (for O1 and O2 in direction) with an energy gain of roughly 30 meV per unit cell.
Comparing the two materials, they have slightly different lattice constants and ion coordinates. For example, since V is less positively charged in CaV2O5, the lengths of the V-O bonds are slightly larger than those in NaV2O5. Specifically, the optimized values for the V-O3 and V-O1 bond lengths are 1.62 (1.67) Å and 1.82 (1.85) Å in NaV2O5 (CaV2O5). At the same time, the spacing between Ca and the O1 plane (2.39 Å) is smaller than the Na-O1 plane distance in NaV2O5 (2.44 Å), since the bigger Ca ion exhibits a stronger Coulomb interaction with oxygen compared to Na. The geometry relaxation allows to make the calculations not directly relying on the experimentally measured structural data and thereby leads to small quantitative differences compared to the NaV2O5 calculations performed by Smolinski et al.Smolinski98 At the same time, this provides the energy scale related to unit cell distortions as it is realized for example in the low-temperature phase.
We do not include correlational effects by using an LDA+ approach in our calculations, but we have estimated the Hubbard for NaV2O5 and CaV2O5 from our data by the following procedure. Similarly to what is described in Ref. Smolinski98, , we have added a small amount of electronic charge to the system and estimated from the resulting change of the V bands. Charge neutrality was accounted for by two different procedures: When putting the positive charge on the Na sites, the resulting was estimated to be 2.8 eV for NaV2O5 (averaged over the Brillouin zone (BZ)) in good agreement with Smolinski et al.Smolinski98 We preferred, however, to provide the positive charge in terms of a uniform background, which leads to a value of 2.45 eV for both compounds, demonstrating that only weakly depends on the ion’s surrounding. This procedure has the advantage, that the band energy shifts are much more uniform with respect to different points of the BZ than when the additional positive charge is located at the Na sites (differences of hundredths of an eV in the former case compared to tenths of an eV in the latter case).
II.2 Bandstructure and density of states
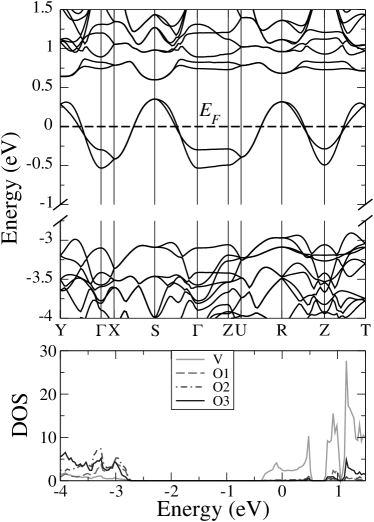
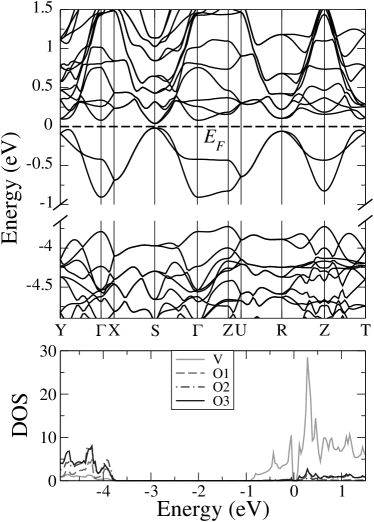
The bandstructures and densities of states of NaV2O5 and CaV2O5 are shown in Figs. 2 and 3, respectively. Focusing on NaV2O5 first, the bands 3-4 eV below the Fermi level are due to O- states. Their smallest distance to the valence band minimum (at the point) will be denoted as later in the text. The unoccupied states exhibit mainly V character with a small admixture of oxygen. The bands intersecting the Fermi level in direction are formed by the bonding combination of V orbitals. Their dispersion is due to hopping along the ladders while the splitting of this pair of bands at the point is due to inter-ladder hopping. The two bands just above the Fermi level originate from the antibonding combination of V- states. The situation for CaV2O5 is similar, where some quantitative differences will be discussed below and in the context of its optical properties.
The bands can be mapped onto a tight-binding model with the one-ladder parameters of the in-rung hopping, and representing the hopping along the ladder. The theoretically determined values for NaV2O5 are eV and eV, which is close to the data of Ref. Smolinski98, . For CaV2O5, we obtained in the same way eV and eV, in agreement with the results of Korotin et al.Korotin00 who applied the LDA+ technique in their calculations. Compared to their results, our hopping matrix elements are slightly increased, which is due to the changes in the interatomic distances as a result of the structural relaxation. We note that both and , are smaller for CaV2O5 than for NaV2O5. At the same time, the splitting of the bonding bands in the point arising from the inter-ladder hopping is much larger in CaV2O5 (0.49 eV) than in NaV2O5 (0.23 eV) since the distance between the ladders is smaller in the former. The corresponding inter-ladder hopping matrix elements between the closest V atoms of neighboring ladders, , are 0.13 and 0.24 eV for NaV2O5 and CaV2O5, respectively. When the lattice is deformed by a displacement of ions corresponding to a phonon mode, the tight-binding parameters as well as the on-site energies change. This kind of electron-phonon coupling will be discussed below.
The influence of the Hubbard term on the properties of V-based ladder compounds is widely discussed in the literature. It is important to mention that the enhanced electron correlation when accouted for by the Hubbard parameter reproduces the semiconducting behavior with the charge gap close to .Horsch98 Correspondingly, the dispersion along the -axis of the band derived from the bonding combination of V- orbitals will be rather than periodic.Kobayashi98 ; Damascelli04 At the same time, we shall see below that the physical properties determined by the electron density, are not strongly influenced by the Hubbard repulsion and can be described reliably within DFT.
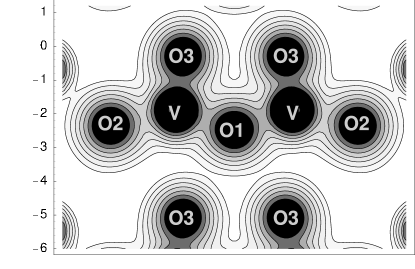
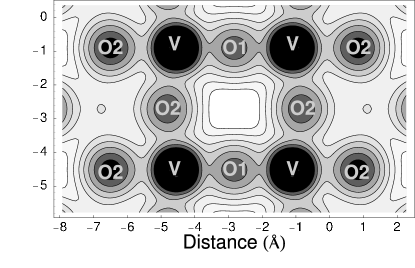
To illustrate the charge density distribution within the unit cell, we exemplarily present the electron charge density for NaV2O5 in Fig. 4 in two perpendicular planes. The upper panel clearly shows the role of the unit cell asymmetry on the charge density arising due to the presence of the apical oxygen O3. This asymmetry, on the one hand, leads to a strong Holstein-like electron-phonon coupling, and, on the other hand, diminishes the overlap of the V orbitals with O1 and O2 states, thus decreasing the hopping matrix elements and correspondingly the components of the dielectric tensor. In addition, the lower panel shows the preferred orientation of the in-ladder oxygen states and a relatively small overlap of the orbitals from different ladders.
III Dielectric function
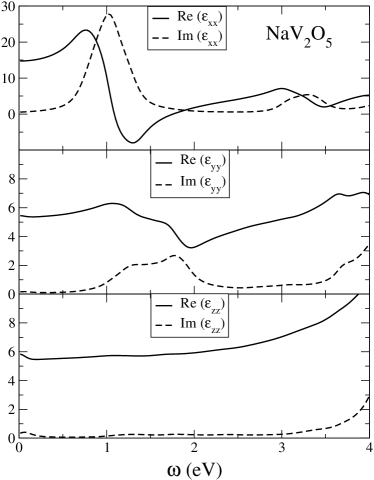
Figures 5 and 6 present the real and imaginary parts of the diagonal dielectric tensor components, and , in the experimentally measured range, where the Cartesian index corresponds to the light polarization directions. was calculated within the Random Phase Approximation (RPA), based on the Kohn-Sham orbitals including a life-time broadening of the optical inter-band transitions of eV, while is obtained by Kramers-Kronig transformation.
Let us first discuss the in-plane response of NaV2O5. The most interesting feature of the component (light polarized along the rungs) is a strong peak at 1.03 eV in agreement with experiment.Presura00 ; Golubchik97 ; Loosdrecht An analysis of the interband momentum matrix elements at different electron wavevectors shows that the first peak in the response arises due to transitions between the bonding and antibonding band states within one V rung. The energy of the peak is larger than 2 because of the band dispersion along the axis and can be estimated to be 2, which is 1.12 eV. Since the transitions between orbitals have very small matrix elements due to the large V-V distance, the admixture of O1- states in the antibonding state is responsible for a sizable intrarung transition matrix element. We mention here that this admixture provides some support to the arguments of Refs. Suaud02, and Hozoi02, . It rapidly decreases, however, with the increase of due to the corresponding decrease of the oxygen contribution, which was first noticed in Ref. Smolinski98, . For this reason the peak mostly originates from transitions in the vicinity of the point.
The component (light polarized along the legs) is dominated by a double-peak structure at 1.27 eV and 1.78 eV, respectively. It is considerably weaker than the response. The analysis of the bandstructure reveals that the shoulder at 1.3 eV comes from in-rung transitions. These can contribute to since at finite values the in-rung states are neither odd nor even with respect to the transformation, and, therefore, can couple to light polarized along the -axis. The broad maximum at eV is related to transitions from the bonding V- states to O2- states admixed to V--derived orbitals at approximately 1.7 eV above the Fermi level.
In both polarizations, the peaks occurring at higher energies ( eV) originate from transitions between O- and V orbitals. For example, the broad feature around 3 eV in the spectra arises from transitions between O1- states at -3.3 eV and bonding V- states around . Comparing to experiment, we want to point out that all theoretically obtained features reproduce the corresponding experimental findings very well.Presura00
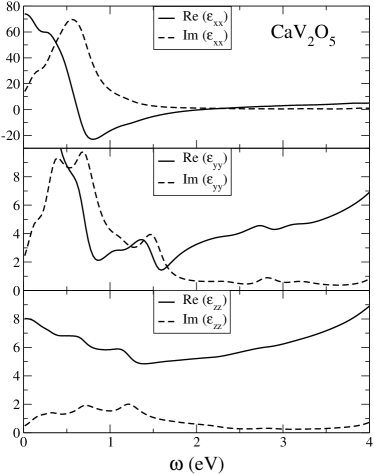
In CaV2O5, the character of the transitions is, in general, the same as in NaV2O5. The fact that Ca provides one more valence electron to the system compared to Na has two obvious effects: First, the optical response is stronger compared to NaV2O5. Second, the peak present in NaV2O5 around 3 eV is missing, since the bonding V- states are occupied and thus don’t provide final states for the transitions. At the same time, since the in-ladder hopping matrix elements are smaller in CaV2O5 than in NaV2O5, the spectrum of unoccupied band states in CaV2O5 is denser, as can be seen in Figs. 2 and 3. For this reason, the low-energy part of the dielectric function ( eV) of CaV2O5 shows a more complicated dependence than that for NaV2O5 since more interband transitions are allowed at this spectral range. A comparison with experiment for this compound which can also provide an experimental test of the applicability of the DFT for the description of optical properties of half-filled ladder compounds is not possible at present since to the best of our knowledge no measured data of the dielectric function of CaV2O5 single crystals are available.
IV Lattice dynamics
IV.1 Phonon modes
| Frequency (cm-1) | Eigenvector | Assignment | ||||||||||
| Experiment | Theory | |||||||||||
| Ref. Fischer99, | Ref. Popovic99ssc, | Vx | Vz | Naz | O1z | O2x | O2z | O3x | O3z | Refs. Popovic99ssc,; Popovic02, | This work | |
| 970 | 969 | 996 | 0.04 | 0.25 | -0.01 | 0.01 | 0.01 | -0.00 | -0.05 | -0.43 | V-O3 stretching | V-O3 stretching |
| 530 | 534 | 512 | 0.16 | -0.07 | 0.01 | 0.16 | 0.45 | 0.06 | -0.05 | -0.01 | V-O2 stretching | V-O2 stretching |
| 450 | 448 | 467 | 0.42 | -0.06 | 0.01 | 0.15 | -0.21 | -0.05 | -0.11 | 0.01 | V-O1-V bending | V-O1-V bending |
| 422 | 423 | 414 | -0.19 | -0.17 | 0.00 | 0.44 | -0.08 | -0.18 | 0.18 | -0.14 | O3-V-O2 bending | O1z+O3-V-O2 bend. |
| 304 | 304 | 308 | 0.02 | 0.19 | -0.04 | 0.18 | -0.07 | 0.39 | 0.19 | 0.09 | O3-V-O2 bending | O3-V-O2 bending |
| 230 | 233 | 232 | 0.17 | 0.06 | 0.03 | -0.13 | 0.06 | -0.16 | 0.42 | -0.00 | O3-V-O2 bending | O3-V-O2 bending |
| 178 | 179 | 176 | -0.02 | 0.28 | -0.40 | 0.10 | 0.04 | -0.22 | -0.06 | 0.18 | Na c | Na c |
| 90 | 90 | 111 | -0.04 | 0.30 | 0.42 | 0.13 | 0.03 | -0.16 | -0.08 | 0.18 | chain rot. | chain rot. |
| Frequency (cm-1) | Eigenvector | Assignment | ||||||||||
| Experiment | Theory | |||||||||||
| Ref. Konstantinovic00, | Ref. Popovic02, | Vx | Vz | Caz | O1z | O2x | O2z | O3x | O3z | Ref. Popovic02, | This work | |
| 935 | 932 | 900 | 0.06 | 0.24 | 0.01 | 0.02 | 0.02 | -0.02 | -0.08 | -0.42 | V-O3 stretching | V-O3 stretching |
| 542 | 539 | 516 | -0.01 | -0.05 | -0.01 | 0.11 | 0.49 | 0.07 | -0.02 | 0.00 | V-O2 stretching | V-O2 stretching |
| 472 | 470 | 446 | 0.36 | -0.16 | 0.00 | 0.39 | -0.09 | -0.05 | -0.08 | -0.00 | V-O1-V bending | V-O1-V bending |
| 421 | 422 | 412 | -0.34 | -0.12 | 0.02 | 0.27 | -0.05 | -0.17 | 0.18 | -0.13 | O3-V-O2 bending | O1z+O3-V-O2 bending |
| 337 | ? | 307 | 0.09 | 0.20 | 0.07 | 0.10 | -0.01 | 0.20 | 0.39 | 0.05 | O3-V-O2 bending | O3-V-O2 bending |
| 282 | 235.6 | 265 | 0.19 | -0.10 | -0.14 | -0.18 | 0.09 | -0.31 | 0.25 | -0.08 | O3-V-O2 bending | O3-V-O2 bending |
| 238 | 138.6 | 201 | 0.02 | 0.21 | 0.39 | 0.03 | 0.06 | -0.31 | -0.05 | 0.17 | Ca c | chain rot. |
| 91 | 90 | 106 | -0.05 | 0.32 | -0.39 | 0.15 | 0.01 | -0.15 | -0.06 | 0.19 | chain rot. | Ca c |

For the calculation of the Ag phonon modes we applied the frozen-phonon approximation. To this extent, the atomic positions have been moved from their equilibrium. Four displacements (two in positive and negative direction, respectively) for each degree of freedom have been taken into account. The resulting forces were used to obtain the energy hyper-surface according to the procedure described in Ref. Ambrosch02, and to set up the dynamical matrix. Since the harmonic fully-symmetric ion vibrations do not change the occupancy of the V sites from single (of fractional) to double, the electron correlations do not significantly influence the elements of the dynamical matrix. At the same time, the correlation effects could be more important for the anharmonic terms relating the lattice forces and ion displacements.
The frequencies of the Ag modes for NaV2O5 and CaV2O5 are presented in Tables 1 and 2, respectively, and compared to experimental data. The corresponding eigenvectors presented in these Tables, , are related to the real displacements by
| (1) |
and are normalized as
| (2) |
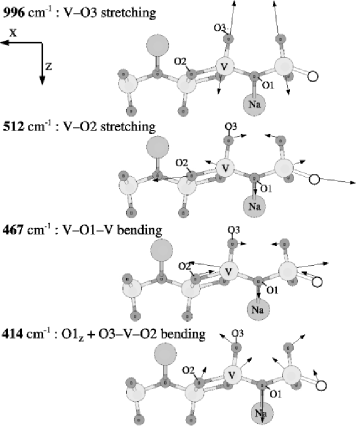
where enumerates the ions with mass , is the number of ions per unit cell, and indicates the phonon mode. In order to visualize the lattice distortions according to the phonon eigenvectors, the corresponding atomic displacements of NaV2O5 are shown in Fig. 7, where the eigenvector components of Table 1 refer to the equivalent positions labeled in the figure. The phonon eigenvectors of CaV2O5 are very similar, up to some differences discussed later.
For the eigenfrequencies of the NaV2O5 Ag modes, good agreement with experimentsFischer99 ; Popovic99ssc ; Popova99 is found, with deviations smaller than 5%. Only for the lowest-energy mode the difference is larger. In full agreement with the results of Refs. Fischer99, ; Popovic99ssc, and Popova99, the eigenvector of the 996 cm-1 mode represents a stretching between V and the apical oxygen. Also the V-O2 stretching of the 512 cm-1 mode and the V-O1-V bending of the 467 cm-1 mode as suggested in Ref. Popovic99ssc, are verified, where we, however, find admixtures of an O1z motion for the former and an O2x movement for the latter, respectively. In the eigenvector of the 414 cm-1 mode, the -displacement of the in-rung oxygen O1 is dominating, while this mode is described as pure O3-V-O2 bending in Ref. Popovic02, . At the same time, our theoretical frequencies are much closer to experiment (2% deviation) than the calculated frequencies in Ref. Popovic02, (9% difference). For the 308 cm-1, the 232 cm-1, the 176 cm-1 and the 111 cm-1 mode, the agreement of our results with the assignment of Popovic et al. Popovic02 is good. However, in most of the modes we find a more pronounced involvement of O1 compared to the interpretation of experimental results.
For the eigenfrequencies of the CaV2O5 Ag modes, the agreement between theory and experimentPopovic02 is very good for the modes above 400 cm-1. For these vibrations, the experimental assignment with respect to their symmetry is unambiguous. The lower frequency of the apical oxygen vibration in CaV2O5 compared to NaV2O5 is due to larger interionic distances, and hence, smaller force constants. A change of 5% can be estimated within the Coulomb picture from the different Vanadium charges in NaV2O5 and CaV2O5 (i.e. 4.5 and 4, respectively), which is in qualitative agreement with experiment.
The two lowest-frequency modes are swapped when Na is replaced by Ca, i.e. the in-phase motion of Ca with the other atoms of the ladder (chain rotation) has higher energy than the out-of-phase vibration, where Ca vibrates c in opposite direction to the ladder. The frequency of the chain rotation mode (201 cm-1) is roughly twice as high as in NaV2O5, representing a difficulty in the interpretation of the measured modes of CaV2O5 which in Refs. Popovic02, and Konstantinovic00, was done in comparison with the phonons of NaV2O5. In Ref. Popovic02, the 138 cm-1 mode of the unpolarized spectrum was interpreted as Ag vibration since its frequency compared to that of the (Na c) mode scales as the inverse square root of the corresponding masses. From our analysis we conclude, that the measured 138 cm-1 mode is not an Ag vibration. The physical origin of the frequency shift of the chain rotation mode is related to the stronger inter-ladder interaction in CaV2O5 which is also reflected in the enhanced tight binding parameter (see Section IV B). On the other hand, the higher Ca mass is mainly responsible for the decrease of the ”Ca c” mode frequency. It is still unclear, however, whether the calculated 201 cm-1 mode corresponds to the experimentally observed 213 cm-1 vibrationPopovic02 or, more probable, to a mode at 235 cm-1 (Ref. Popovic02, ) (or 238 cm-1 according to Ref. Konstantinovic00, ) which has been assigned as an Ag mode in both papers. In the latter case our calculated frequency of 265 cm-1 can be related to the measured 282 cm-1 vibration.Konstantinovic00 A similar problem concerns the interpretation of one more Ag mode somewhat above 300 cm-1, where no clear experimental assignment is available in Ref. Popovic02, . In this context, the interpretation of the Raman scattering intensities could be helpful for an unambiguous assignment as will be discussed in the next section.
IV.2 Electron-phonon and spin-phonon coupling
When ions are shifted from their equilibrium positions, the changes of the bandstructure are a measure for the electron-phonon interaction. Two types of coupling can be considered: The first one is the Holstein coupling, where the site energies change with the ion displacements, while the other one is due to changes of the hopping parameters. At the same time, the exchange path, which is formed by transitions between different sites, is also influenced by the phonons. This effect results in spin-phonon coupling. To investigate the type of the electron-phonon coupling and its strength for each mode, in Tables 3 and 4 we display the changes of various model parameters with the corresponding ion displacements (up to Å). These are the hopping parameters , , and , the charge transfer gap , and the exchange parameters (along the ladders) and (within the rungs). and can be estimated as and , respectively.Sherman99 In this context we introduce the dimensionless phonon coordinate by the relation
| (3) |
It turns out that only the higher-frequency phonons considerably modulate the one-ladder parameters and . The changes of the hopping matrix elements corresponding to are below 0.025 eV, while they can be much larger in the energy shifts . Therefore the main mechanism of electron-phonon coupling can be assigned to Holstein-like interaction. Our results also allow to estimate the strength of spin-phonon coupling arising due to the phonon-induced modulation of the exchange parameters. The corresponding relative changes are summarized in Tables 3 and 4.
| (cm-1) | (eV) | (eV) | (eV) | (eV) | ( | ( |
|---|---|---|---|---|---|---|
| 996 | -0.0021 | -0.0099 | 0.0056 | -0.0936 | 0.0190 | 0.0449 |
| 512 | -0.0210 | 0.0213 | -0.0439 | 0.0905 | 0.2952 | -0.0773 |
| 467 | -0.0016 | -0.0115 | 0.0109 | -0.0037 | 0.0052 | 0.0478 |
| 414 | -0.0110 | -0.0069 | -0.0142 | -0.0010 | 0.1284 | 0.0294 |
| 308 | 0.0000 | -0.0167 | -0.0253 | 0.0554 | 0.0003 | 0.0967 |
| 232 | -0.0012 | -0.0012 | 0.0257 | -0.0340 | 0.0085 | 0.0013 |
| 176 | 0.0019 | 0.0061 | 0.0193 | -0.0185 | -0.0130 | -0.0225 |
| 111 | 0.0008 | 0.0028 | 0.0132 | -0.0117 | -0.0055 | -0.0107 |
| undistorted: = 0.175 eV, = 0.387 eV, = 0.117 eV, = 2.565 eV | ||||||
| (cm-1) | (eV) | (eV) | (eV) | (eV) | ( | ( |
|---|---|---|---|---|---|---|
| 900 | -0.0029 | -0.0089 | 0.0078 | -0.1286 | 0.0316 | 0.0470 |
| 516 | -0.0113 | 0.0120 | -0.0253 | 0.0503 | 0.1863 | -0.0565 |
| 446 | -0.0013 | -0.0232 | 0.0139 | -0.0228 | 0.0052 | 0.1399 |
| 412 | 0.0056 | -0.0094 | 0.0223 | -0.0239 | -0.0815 | 0.0540 |
| 307 | 0.0016 | -0.0017 | -0.0035 | 0.0054 | -0.0141 | 0.0185 |
| 265 | 0.0071 | -0.0050 | -0.0337 | -0.0048 | -0.0895 | 0.0285 |
| 201 | -0.0019 | 0.0035 | 0.0278 | -0.0080 | 0.0269 | -0.0217 |
| 106 | 0.0013 | -0.0055 | -0.0110 | -0.0009 | -0.0227 | 0.0317 |
| undistorted: =0.143 eV, = 0.321 eV, = 0.244 eV, = 2.882 eV | ||||||
The changes in the matrix elements can be understood as a result of the altered interionic distances and the electronic on-site energies. For example, the large phonon-induced decrease of in the 512 cm-1 vibration of NaV2O5 is a consequence of the larger V-O distance in the same leg (see Fig. 7). At the same time, the V-O distance along the axis changes from 0.274 Å to 0.309 Å at . The decrease of for the 308 cm-1 mode is due to an enhanced -axis distance between V and the in-rung oxygen O1 by 0.02 Å going from the relaxed to the distorted structure with . As a consequence, also the energy difference of the V and O1 orbitals is increased, diminishing the hopping parameter . The very strong modulation of the inter-ladder hopping by the 512 cm-1 mode is due to a zig-zag like deformation of the legs in the plane, i.e. a vibration of neighboring vanadium and oxygen atoms of one leg in opposite direction, and hence an increase of this V-O2 distance.
As can be seen in Tables 3 and 4, the biggest change for both and , in NaV2O5 is caused by the V-O2 stretching mode, while in CaV2O5 this mode leads to the most pronounced change only in , but the largest modulation of is due to the V-O1-V mode (446 cm-1). The reason for this can be found in the displacement of the in-rung oxygen O1 along the axis, which is much larger compared to NaV2O5. For both compounds, the biggest effect on is observed for the V-O3 stretching mode.
We emphasize here that both, electron-phonon coupling (leading to a modulation of and the hopping matrix elements) and spin-phonon coupling (leading to a modulation of ) in NaV2O5 and CaV2O5, are considerably strong. Choi03 . For this reason the lattice distortion in the low-temperature phase of NaV2O5 can be related to total-energy changes originating from charge as well as spin Suaud02 ; Hozoi02 degrees of freedom.
V Raman scattering
With the knowledge of the phonon modes and the dielectric functions we can calculate the phonon Raman spectra of NaV2O5 and CaV2O5. For this purpose we use the approach developed in Ref. Ambrosch02, , where at a given exciting light frequency the total Raman intensity at temperature in arbitrary units is:
| (4) |
Here is the Raman shift, the Cartesian indices correspond to the polarizations of incident and scattered light, which are the same due to the orthorhombic symmetry of the crystal. and denote the one-phonon and the phonon-less states, respectively, and is the operator of the phonon coordinate. is the phonon Bose distribution function, and is the Lorentzian shape of the phonon line with a broadening , which was chosen to be 25 cm-1 for all modes.
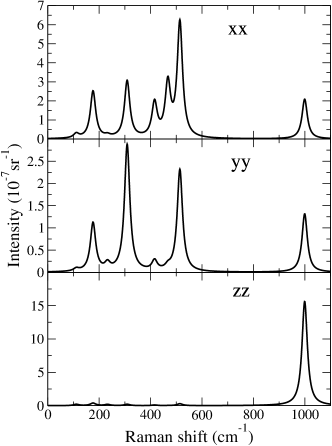
The total Raman intensity, i.e. the sum over all phonon contributions, is presented in Figs. 8 and 9 for NaV2O5 and CaV2O5, respectively, for an incident light energy of 2.41 eV ( nm), which is used in the Raman experiments available in the literature. In the polarization seven out of eight modes are clearly visible, only the 232 cm-1 vibration has negligible intensity, in excellent agreement with experiments.Fischer99 ; Popovic99ssc We note that also the relative peak heights are fully reproduced. This scattering geometry exhibits the highest intensity for all modes except the highest one, which dominates the polarized spectra. The intensity of all other modes in this polarization is two orders of magnitude smaller and hence hardly visible in the measured spectra. The only exception is the 110 cm-1 mode, where theory cannot reproduce the experimentally observed sharp peak. One possible explanation could be provided by the extremely pronounced resonance behavior of most of the vibrations as will be discussed below. The polarization exhibits intensities in between the magnitudes of the and counterparts. In accordance with experiment the 467 cm-1 vibration is absent in this scattering geometry.
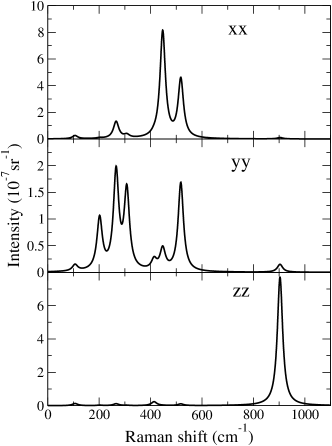
For CaV2O5 the situation is similar. The highest energy mode exhibits the highest intensity in polarization. Between 400 and 600 cm-1 the intensities are dominating. Only below 400 cm-1, the spectra are comparable in magnitude or even bigger.
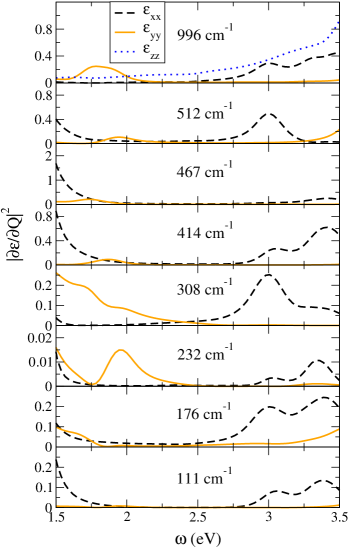
The Raman scattering intensity is governed by the change of the crystal polarizability with the nuclei vibrating around their equilibrium positions. The dependence of the dielectric function on the phonon coordinate arises due to two main reasons, i.e. the dependence of the momentum matrix element and the -dependence of the interband transition energy.Sherman03 The latter contribution leads to a stronger resonance behavior of the Raman intensity than the former. To illustrate the influence of the lattice vibrations on the dielectric function, in Fig. 10 we present for the phonon modes of NaV2O5. In the energy range eV the derivative of the component dominates over for all modes. In the low energy region the latter shows a dramatic resonance behavior for the 232 cm-1 and the 308 cm-1 vibration, and is comparable or even slightly larger in magnitude than around 2 eV for the next three modes higher in energy. All modes but the highest one exhibit extremely strong resonances in the infrared in either of the two polarizations. For the highest mode, the polarization is dominating, while only below 2 eV the component becomes more pronounced. We thus predict much higher Raman scattering intensities for incident light frequencies both higher and lower than those used in experiments so far. We mention in this context, that Fischer et al.Fischer99 observed strong relative intensity changes in geometry when measuring the low temperature phase using different photon energies.
A similarly strong resonance behaviour is also expected for CaV2O5. While with the exception of the highest mode the intensities of the component are small and the influence of the photon energy is negligible in NaV2O5, this scattering geometry is slightly richer for CaV2O5, with generally slightly higher relative intensities and an even more pronounced resonant behavior of the highest mode.
VI Conclusions
In this paper, we have studied optical properties and lattice dynamics of NaV2O5 and CaV2O5 in the phase from first principles. The calculations are based on the theoretically optimized crystal structures obtained within the generalized gradient approximation. Effective bandstructure parameters have been extracted by mapping our results onto a tight-binding model. We have obtained the Hubbard repulsion on the V sites being approximately 2.45 eV, both for NaV2O5 and CaV2O5. The dielectric functions have been determined within the random phase approximation and are in very good agreement with available experiments. Our results show that the 1 eV peak in the component arises due to transitions between the bonding and the antibonding combination of V orbitals within one rung. By diagonalizing the dynamical matrix we have obtained the phonon frequencies for the fully symmetric vibrations which are in very good agreement with measured data. With the knowledge of the phonon eigenvectors and the changes of the bandstructure caused by the phonon modes we have estimated the parameters of electron-phonon and spin-phonon coupling for both compounds. We find that the strongest contribution to the electron-phonon coupling comes from the phonon-modulation of the charge transfer gap . At the same time, other effects arising from altered hopping matrix elements can be important. Finally, we have calculated the phonon Raman spectra of these compounds and analyzed the frequency-dependent dielectric function modulated by the ion displacements according to the lattice vibrations. On this basis we predict a strong resonance behavior for both NaV2O5 and CaV2O5.
As an outlook for further investigations, this detailed analysis provides a basis for comparison with the low-temperature phase. Moreover, the Hubbard parameters extracted in this work can be used as input for further calculations by, e.g., Exact DiagonalizationAichhorn03 ; Edegger or Quantum Monte Carlo simulationsGabriel03
Acknowledgment The work is financed by the Austrian Science Fund (FWF), project P15520. We also appreciate discussions with M. Aichhorn and support by the FWF project P16227 and the EU RTN network EXCITING (contract HCPR-CT-2002-00317). EYS is grateful to R. T. Clay, A. Damascelli, P. Lemmens, S. Mazumdar, and M. N. Popova for interesting discussions and suggestions.
References
- (1) E. Dagotto, and T. M. Rice, Science 271, 618 (1996).
- (2) P. Lemmens, M. Fischer, M. Grove, P. H. M. v. Loosdrecht, G. Els, E. Ya. Sherman, C. Pinettes and G. Güntherodt in ”Advances in Solid State Physics”, R. Helbig Ed., 39, 181 (Vieweg Verlag, Germany, 1999) and P. Lemmens, G. Güntherodt and C. Gros, Physics Reports 375, 1 (2003).
- (3) H. Smolinski, C. Gros, W. Weber, U. Peuchert, G. Roth, M. Weiden, and C. Geibel, Phys. Rev. Lett. 80, 5164 (1998).
- (4) M. Isobe and Y. Ueda, J. Phys. Soc. Jap. 65, 1178 (1996).
- (5) M. Weiden, R. Hauptmann, C. Geibel, F. Steglich, M. Fischer, P. Lemmens, and G. Güntherodt, Z. Phys. B 103, 1 (1997).
- (6) M. Hase, I. Terasaki, and K. Uchinokura, Phys. Rev. Lett. 70, 3651 (1993).
- (7) J. Lüdecke, A. Jobst, S. van Smaalen, E. Morré, C. Geibel, and H.-G. Krane, Phys. Rev. Lett. 82, 3633 (1999).
- (8) S. van Smaalen, P. Daniels, L. Palatinus, and R. K. Kremer, Phys. Rev. B 65, R 060101 (2002)
- (9) H. Nakao, K. Ohwada, N. Takesue, Y. Fujii, M. Isobe, Y. Ueda, M. v. Zimmermann, J. P. Hill, D. Gibbs, J. C. Woicik, I. Koyama, and Y. Murakami, Phys. Rev. Lett. 85, 4349 (2000).
- (10) M. N. Popova, A. B. Sushkov, S. A. Klimin, E. P. Chukalina, B. Z. Malkin, M. Isobe, and Y. Ueda, Phys. Rev. B 65, 144303 (2002), M. N. Popova, A. B. Sushkov, A. N. Vasil’ev, M. Isobe, and Y. Ueda, Pis’ma Zh. Eksp. Teor. Fiz. 65, 711 (1997) [JETP Lett. 65, 743 (1997)]
- (11) M. Fischer, P. Lemmens, G. Els, G. Güntherodt, E. Ya. Sherman, E. Morré, C. Geibel, and F. Steglich, Phys. Rev. B 60, 7284 (1999).
- (12) H. Seo and H. Fukuyama, J. Phys. Soc. Jpn. 67, 2602 (1998).
- (13) M. Mostovoy and D. I. Khomskii, Solid State Commun. 113, 159 (2000).
- (14) E. Ya. Sherman, M. Fischer, P. Lemmens, P. H. M. van Loosdrecht, and G. Güntherodt, Europhys. Lett. 48, 648 (1999).
- (15) H. Nojiri, S. Luther, M. Motokawa, M. Isobe, and Y. Ueda, J. Phys. Soc. Jpn. 69, 2291 (2000) .
- (16) C. Presura, D. van der Marel, A. Damascelli, and R. K. Kremer, Phys. Rev. B 61, 15762 (2000).
- (17) H. Iwase, M. Isobe, Y. Ueda, and H. Yasuoka, J. Phys. Soc. Jap. 65, 2397 (1996).
- (18) P. Horsch and F. Mack, Eur. Phys. J. B 5, 367 (1998).
- (19) V. Yushankhai and P. Thalmeier, Phys. Rev. B 63, 064402 (2001).
- (20) A. Hübsch, C. Waidacher, K. W. Becker, and W. von der Linden, Phys. Rev. B 64, 075107 (2001).
- (21) M. Aichhorn, P. Horsch, W. von der Linden, and M. Cuoco, Phys. Rev. B 65, R 201101 (2002).
- (22) M. V. Mostovoy, D. I. Khomskii, and J. Knoester, Phys. Rev. B 65, 064412 (2002).
- (23) M. Vojta, A. Hübsch, and R. M. Noack Phys. Rev. B 63, 045105 (2001), M. Vojta, R. E. Hetzel, and R. M. Noack Phys. Rev. B 60, R8417 (1999).
- (24) Z. S. Popovic and F. R. Vukajlovic, Phys. Rev. B 59, 5333 (1999).
- (25) A. N. Yaresko, V. N. Antonov, H. Eschrig, P. Thalmeier, and P. Fulde Phys. Rev. B 62, 15538 (2000).
- (26) H. Wu and Q. Q. Zheng, Phys. Rev. B 59, 15027 (1999).
- (27) V. V. Mazurenko, A. I. Lichtenstein, M. I. Katsnelson, I. Dasgupta, T. Saha-Dasgupta, and V. I. Anisimov, Phys. Rev. B 66, 081104 (2002).
- (28) M. A. Korotin, V. I. Anisimov, T. Saha-Dasgupta, and I. Dasgupta, J. Phys.: Condens. Matter 12, 113 (2000).
- (29) A. Bernert, T. Chatterji, P. Thalmeier, and P. Fulde, Eur. Phys. J. B 21, 535 (2001).
- (30) N. Suaud and M.-B. Lepetit, Phys. Rev. B 62, 402 (2000).
- (31) N. Suaud and M.-B. Lepetit, Phys. Rev. Lett. 88, 056405 (2002).
- (32) L. Hozoi, A. H. de Vries, A. B. van Oosten, R. Broer, J. Cabrero, and C. de Graaf Phys. Rev. Lett. 89, 076407 (2002)
- (33) M. Aichhorn, M. Hohenadler, E. Ya. Sherman, J. Spitaler, C. Ambrosch-Draxl, and H. G. Evertz, Phys. Rev. B 69, 245108 (2004)
- (34) C. Gabriel, E. Ya. Sherman, T. Lang, and H. G. Evertz, cond-mat/0406715
- (35) E. Sjöstedt, L. Nordström, and D. J. Singh, Solid State Commun. 114, 15, (2000).
- (36) P. Blaha, K. Schwarz, and J. Luitz, WIEN2k, Vienna University of Technology (2000) (Improved and updated Unix version of the original copyright WIEN code, published by P. Blaha, K. Schwarz, P. Sorantin, and S. B. Trickey, Comp. Phys. Commun. 59, 399 (1990)).
- (37) J. P. Perdew, K. Burke, and M. Ernzerhof, Phys. Rev. Lett. 77, 3865 (1996).
- (38) M. Onoda and N. Nishiguchi, J. Sol. State Chem. 127, 359 (1996).
- (39) K. Kobayashi, T. Mizokawa, A. Fujimori, M. Isobe, and Y. Ueda, Phys. Rev. Lett. 80, 3121 (1998), K. Kobayashi, T. Mizokawa, A. Fujimori, M. Isobe, Y. Ueda, T. Tohyama, and S. Maekawa, Phys. Rev. Lett. 82, 803 (1999)
- (40) A. Damascelli, private communication
- (41) S. A. Golubchik, M. Isobe, A.N. Ivlev, B.N. Mavrin, M. N. Popova, A. B. Sushkov, Y. Ueda, and A.N. Vasil’ev, Journal of the Physical Society of Japan 66, 4042 (1997)
- (42) P. H. M. van Loosdrecht, unpublished results
- (43) C. Ambrosch-Draxl, H. Auer, R. Kouba, E. Ya. Sherman, P. Knoll, and M. Mayer Phys. Rev. B 65, 064501 (2002).
- (44) Z. V. Popovic, M. J. Konstantinovic, R. Gajic, V. N. Popov, Y. S. Raptis, A. N. Vasil’ev, M. Isobe and Y. Ueda Solid State Commun. 110, 381(1999).
- (45) M. J. Konstantinovic, Z. V. Popovic, M. Isobe, and Y. Ueda, Phys. Rev. B 61, 15185 (2000).
- (46) Z. V. Popovic, M. J. Konstantinovic, R. Gajic, V. N. Popov, M. Isobe, Y. Ueda, and V. V. Moshchalkov, Phys. Rev. B 65, 184303 (2002).
- (47) M. N. Popova, A. B. Sushkov, S.A. Golubchik, B.N. Mavrin, V.N. Denisov, B. Z. Malkin, A.I. Iskhakova, M. Isobe, and Y. Ueda, Zh. Eksp. Teor. Fiz. 115, 2170 (1999) [JETP 88, 1186 (1999)]
- (48) This strong modulation of the interrung exchange by phonons can be a generic feature of spin 1/2 systems: E. Ya. Sherman, P. Lemmens, B. Busse, A. Oosawa, and H. Tanaka Phys. Rev. Lett. 91, 057201 (2003), K.-Y. Choi, G. Güntherodt, A. Oosawa, H. Tanaka, and P. Lemmens Phys. Rev. B 68, 174412 (2003).
- (49) A review of different mechanisms of phonon Raman scattering in solids can be found in E. Ya. Sherman, O. V. Misochko, P. Lemmens, in ”Spectroscopy of High- Superconductors”, Ed. N.M. Plakida, Taylor & Francis Publ., London and New York (2003), pp. 97-158.
- (50) B. Edegger, R. Noack, and H.G. Evertz, in preparation; M. Aichhorn, H.G. Evertz, W. von der Linden, and M. Potthoff, in preparation.