Expansion of Solid Helium into Vacuum: the Geyser Effect
Abstract
The particle flux through a two micron diameter orifice into vacuum from a source chamber filled with solid 4He exhibits a striking periodic behavior similar to that of a geyser. This phenomenon is attributed to a periodic collapse of the solid inside the source induced by the accumulation of excess vacancies injected at the orifice. The flux-time curves agree well with a kinetic model and provide direct information on the diffusivity of vacancies in solid 4He.
pacs:
64.80.-s, 67.80.MgLattice vacancies are always present in an otherwise perfect crystal in thermal equilibrium because of the corresponding increase in entropy. Regarded classically, these vacant sites are localized defects which move only occasionally in a thermally activated diffusion process. In solid helium, however, as a consequence of the light atomic mass and weak attractive interaction potential the particles execute zero-point oscillations which cover a large fraction of the cell sizeAndreev82 . Owing to the large amplitude of the zero-point motion tunneling of a vacancy into a neighbor lattice site is expected to occur at significant rates. Vacancies thus become delocalized entities which can be treated as elementary quasi-particle excitations of the crystal occupying a finite band of energy statesHetherington68 ; Andreev69 ; Guyer72 , which is a unique feature of quantum solids.
Despite several decades of intensive experimental effort the present understanding of the underlying mechanism of vacancy diffusion in quantum solids is still incomplete, as demonstrated by the variety of conflicting data for the basic vacancy parameters (see Burns94 ; Simmons94 and references therein). Very likely this arises from the difficulties in the interpretation of results obtained by indirect methods, especially in the absence of a realistic model of a vacancyGalli03 ; Gov99 . Furthermore, the previous experiments afforded little control over the vacancy concentration, which drops exponentially with decreasing temperature and is thus probably too low to reveal significant quantum effects.
This letter reports on a quite surprising discovery related to the above issues. In the expansion of solid 4He into a vacuum system through a small pinhole orifice the particle flux exhibits a periodic sequence of Geyser-like bursts. The periods are in the range of seconds or minutes, depending on the pressure and temperature. The phenomenon is interpreted in terms of excess vacancies injected into the solid at the orifice which diffuse inwards eventually causing a periodic collapse of a macroscopic portion of the solid, thereby resetting the initial conditions. The observed temporal behavior is shown below to be closely related to the high mobility of the vacancies, and provides direct information on vacancy diffusion in solid 4He.
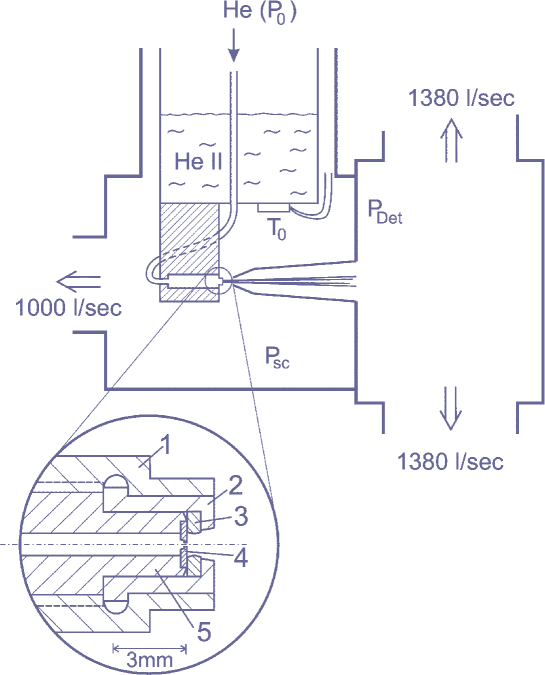
A standard molecular beam source in which the gas is replaced by solid 4He is used in these experiments. This simple arrangement represents an idealization of previous studies of plastic flow of solid 4He for the determination of vacancy diffusivityZuev98 ; Berent98 . In the apparatus, shown in Fig. 1, the helium initially in the gas state is admitted into the source at a pressure and a temperature maintained by a liquid-He bath cryostatGrisenti03 . The temperature was determined from the He vapor pressure above the liquid helium bath. The pinhole orifice with cross section has a diameter m and a comparable length, and is located coaxially at the end of a long 1 mm-dia. copper tube with cross section . After passing through a separately pumped source chamber the narrow beam reaches the detector chamber through a 2.5 cm-dia. aperture, located about 10 mm beyond the orifice. The beam flux is proportional to the detector chamber pumping speed times the measured pressure increase in the detector chamber, which is between and mbar.
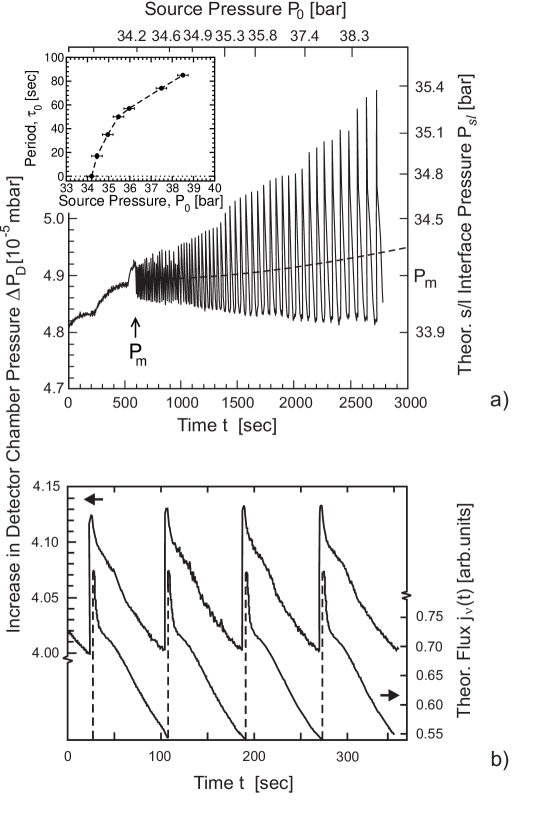
In experiments at a constant source temperature [Fig. 2(a)], the beam flux is measured as the source pressure is gradually increased stepwise from below to above the melting pressure . At the liquid flows at a constant rate steadily increasing with increasing Grisenti03 . As soon as exceeds the flux exhibits bursts with period , each burst being characterized by a sudden increase in intensity followed by a slowly decaying tail. The period is found to increase with increasing source pressure [see inset of Fig. 2(a)] and, as shown in Fig. 2(b) at a given temperature and pressure, is constant within , even in experiments over several hours.
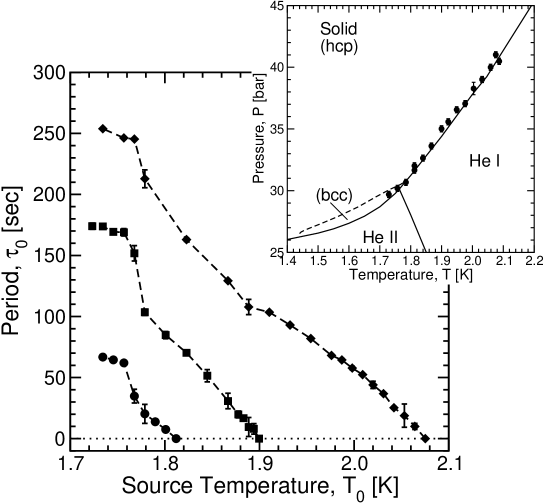
The plots of the period as a function of pressure at constant temperature [inset in Fig. 2(a)] or of temperature at constant pressure (Fig. 3) show that the period vanishes at either the melting pressure or the melting temperature . The critical points at which vanishes follow, within the experimental error, the melting curve (see inset of Fig. 3).
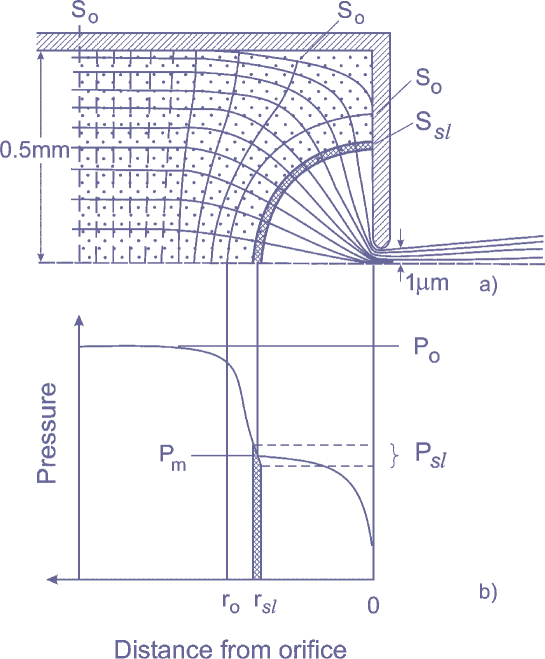
Optical observations like those reported in Ref. Grisenti03 indicate clearly a narrow liquid jet at the nozzle exit for all of the source conditions considered here. This indicates that there must be a solid-liquid (s/l) interface with an effective cross section () at some intermediate distance from the nozzle where the pressure approaches the melting pressure , as shown schematically in Fig. 4. In the liquid layer the pressure obeys Bernoulli’s equationGrisenti03 , with the average velocity of the liquid increasing from the s/l interface to the orifice exit inversely proportional to the reduction in cross section . The exit liquid velocity is simply related to by m/s, where is the atomic volume of the liquid and is an apparatus constant.
The near equality of the time averaged fluxes above [broken line in Fig. 2(a)] and below the melting point suggests a plastic flow of the solid inside the source cylinder similar to that of a liquidSuzuki73-77 . A crucial difference between the dynamics of the solid and liquid, however, is expected in the region where the flux cross section shrinks from the source cylinder area to . In this region the plastic flow of the solid is ensured by two mechanisms involving the motion of defects: one is the plastic deformation allowed by the motion of dislocations; the other is the injection into the solid of vacancies generated at the s/l interface with a corresponding release of atoms from the solid into the liquid. Driven by their inward relaxationChaudhuri99 the vacancies climb up the strong pressure gradient. Although many vacancies segregate at extended defects, e.g., at the axis of edge dislocations causing dislocation climbingNabarro:book a large fraction will be pinned in the upstream region at where the pressure gradient drops to zero and the pressure quickly approaches (see Fig. 4). While dislocation climbing will support a constant flow, the accumulation of excess vacancies around is held responsible for the periodic bursts in the beam flux intensity. A periodic behavior of the particle flux due to a stick-slip motion of the solid inside the source is ruled out since in this case one would expect a decrease of with increasing Rozman96 , whereas in the present experiments the period increases with increasing source pressure [see inset of Fig. 2(a)].
To model the oscillatory part of the flow it is assumed that a percolative collapse, occurring at some critical vacancy concentration , leads to a bleaching of vacancies and resets the initial conditions. By equating the total flux of the liquid at the orifice to that at the s/l interface, the time dependent liquid exit velocity can be written as
| (1) |
where is the stationary velocity due to the plastic flow of the solid inside the source tube and the second term accounts for the time dependent vacancy current density at the s/l interface. consists of a diffusive and a drift term
| (2) |
where is the excess in the vacancy concentration with respect to the local equilibrium value in the thin solid layer of thickness (Fig. 4) and its space derivative. is determined by solving the kinetic equation in one dimensionWolfe_et_al:book
| (3) |
In Eqs. (2) and (3) the vacancy diffusion coefficient is related to the mobility through the Nernst-Einstein relation , and is the vacancy drift velocity with respect to the laboratory frame under the action of a force . The inward relaxation of the lattice surrounding a vacancy is characterized by a local change in the vacancy volume and causes a net force field on the vacancy driving it towards higher pressures. Thermal generation and recombination processes are included in Eq. (3) through the vacancy recombination time . The external generation function , where is the Heaviside step function, consists of two terms. The first term models the sudden depletion of vacancies by an amount occurring in the narrow region at time . By assuming a depletion of all the vacancies, is approximately given by an average equilibrium vacancy concentration of cm-3Zuev98 . The second term describes the subsequent vacancy injection at the s/l interface with a vacancy generation velocity Note .
Equations (2) and (3) predict in good agreement with the experiment the temporal behavior of the flux within a single period. For simplicity, in Eq. (2) has been assumed to be constant in the solid layer . Figure 2(b) compares the calculated and experimental flux curves for K and bar. The best fit was obtained with cm2/s (corresponding to s/g), cm/s, s, and with Note . The order of magnitude of , which is consistent with earlier measurementsZuev98 , is typical of a liquid, thereby indicating non-classical diffusion of vacancies in the solid.
Since the liquid is incompressible the exit velocity is related to the pressure of the liquid at the s/l interface, , by the Bernoulli equation , where is the mass of a He atom. Thus, the oscillations in the detected signal correspond directly to small oscillations of the pressure at the s/l interface [Fig. 2(a)], right-hand ordinate scale]. The oscillations of with respect to are in turn a natural consequence of the variable concentration of vacancies in the solid which affects the local melting pressure.
The excess critical vacancy concentration causing the collapse of the solid can be estimated from the measured . Within the present kinetic model the period is approximately given by , where and is the diffusion length. By assuming Chaudhuri99 , it follows that m and hence . Since the integrated intensity over a full period is a measure of the amount of injected vacancies, the observed growth of the oscillation amplitude with increasing source pressure [Fig. 2(a)] suggests that at higher a larger excess vacancies concentration is needed to induce the collapse of the solid in the source. This is consistent with the expected decrease of the equilibrium vacancy concentration with increasing pressureZuev98 .
In conclusion, the temporal behavior of the beam intensity in expansions of solid 4He into vacuum through a pinhole orifice provides a remarkably direct way to explore vacancy diffusion and mobility. The orifice acts as a well defined source of vacancies, which gradually diffuse into the solid and accumulate in the region where the local pressure approaches the externally applied source pressure. Periodically, the concentration of vacancies in this region reaches some critical value at which the solid collapses, resetting the initial conditions. The extreme simplicity allows this type of experiment to be easily extended to a systematic study of vacancy diffusion in systems other than helium. A particularly intriguing case is represented by solid p-H2, for which previous studies suggest at K the transition from a thermally activated to a purely quantum mechanical vacancy diffusion processZhou89 . The present experiments are also ideally suited to address the exciting possibility of Bose-Einstein condensation of vacancies in bulk solid 4HeAndreev69 ; Chester70 ; Leggett70 . Despite many attemptsMeisel92 , only indirect evidence has so far been found for this “supersolid” stateGoodkind02 , perhaps because, if it exists, the equilibrium vacancy concentration is too small to make it detectable. In the present experiments a much larger vacancy concentration is achieved under non-equilibrium conditions, thereby enhancing the possibility of BEC in solid 4He. Indeed, the probable observation of a supersolid phase in solid helium confined in Vycor, a configuration that is likely to be more heavily populated with vacancies than bulk helium, has recently been reportedKim04
Useful discussions with L. Reatto, F. Pederiva, and W. Schröter are gratefully acknowledged. We thank R. Dörner for carefully reading the manuscript. R. E. G. and M. K. thank BMBF/GSI and DFG for financial support.
References
- (1) See, e.g., A. F. Andreev, in Progress in Low Temperature Physics, Vol. VIII, edited by D. F. Brewer (North-Holland, New York, 1982), Chap. 2
- (2) J. H. Hetherington, Phys. Rev. 176, 231 (1968)
- (3) A. F. Andreev and I. M. Lifshitz, Sov. Phys. JETP 29, 1107 (1969)
- (4) R. A. Guyer, J. Low Temp. Phys. 8, 472 (1972)
- (5) C. A. Burns and J. M. Goodkind, J. Low Temp. Phys. 95, 695 (1994)
- (6) R. O. Simmons, J. Phys. Chem. Solids 55, 895 (1994)
- (7) D. E. Galli and L. Reatto, Phys. Rev. Lett. 90, 175301 (2003)
- (8) N. Gov and E. Polturak, Phys. Rev. B 60, 1019 (1999)
- (9) N. V. Zuev, V. V. Boiko, N. E. Dyunin, and V. N. Grigor’ev, J. Low Temp. Phys. 111, 597 (1998)
- (10) I. Berent and E. Polturak, Phys. Rev. Lett. 81, 846 (1998)
- (11) R. E. Grisenti and J. P. Toennies, Phys. Rev. Lett. 90, 234501 (2003)
- (12) H. Suzuki, J. Phys. Soc. Jpn. 35, 1472 (1973)
- (13) B. Chaudhuri, F. Pederiva, and G. V. Chester, Phys. Rev. B 60, 3271 (1999)
- (14) F. R. N. Nabarro, Theory of Crystal Dislocations (Oxford University Press, London, 1967)
- (15) M. G. Rozman, M. Urbakh, and J. Klafter, Phys. Rev. Lett. 77, 683 (1996)
- (16) C. M. Wolfe, N. Holonyak, Jr., and G. E. Stillman, Physical Properties of Semiconductor (Prentice-Hall, Englewood Cliffs, 1989), Chap. 8
- (17) The vacancy surface generation velocity describes the injection of vacancies within a surface layer of thickness as a result of the transfer of atoms from the solid to the liquid phase at a net rate . In a stationary state is balanced by the recombination and the sweeping away of vacancies by the inward pressure gradient. Fast surface recombination yields a vacancy depletion layer within . The integration over in Eq. (3) for a stationary state, , gives , where the second (recombination) term can be neglected at high pressure gradients.
- (18) D. Zhou, C. M. Edwards, and N. S. Sullivan, Phys. Rev. Lett. 62, 1528 (1989)
- (19) G. V. Chester, Phys. Rev. A 2, 256 (1970)
- (20) A. J. Leggett, Phys. Rev. Lett. 25, 1543 (1970)
- (21) For a comprehensive review see M. W. Meisel, Physica B 178, 121 (1992)
- (22) J. Goodkind, Phys. Rev. Lett. 89, 095301 (2002)
- (23) E. Kim and M. H. W. Chan, Nature 427, 225 (2004)