Structure and dynamics of oxygen adsorbed on Ag(100) vicinal surfaces
Abstract
The structure and dynamics of atomic oxygen adsorbed on Ag(410) and Ag(210) surfaces has been investigated using density functional theory. Our results show that the adsorption configuration in which O adatoms decorate the upper side of the (110) steps forming O–Ag–O rows is particularly stable for both surfaces. On Ag(210), this arrangement is more stable than other configurations at all the investigated coverages. On Ag(410), adsorption on the terrace and at the step edge are almost degenerate, the former being slightly preferred at low coverage while the latter is stabilized by increasing the coverage. These findings are substantiated by a comparison between the vibrational modes, calculated within density-functional perturbation theory, and the HREEL spectrum which has been recently measured in these systems.
pacs:
68.43.-hI Introduction
The interaction of oxygen with silver surfaces has been intensively studied because of the key role of silver in many important industrial oxidation reactions such as, for example, partial oxidation of methanol to formaldehyde or ethylene epoxidation.vanSanten_AC35 These reactions occur very efficiently when Ag powders are employed as a catalyst. Since the particles which compose these powders are affected by many surface defects of different nature and with different concentrations, their chemistry can be extremely different from that of perfect low-Miller-index surfaces. Indeed the presence of various inequivalent adsorption sites suggests that atomic and molecular oxygen can adsorb forming species of different chemical nature. The microscopic characterization of such adsorbed species is a fundamental issue to understand the catalytic activity of Ag powders.
A large amount of experimental and theoretical results clearly indicates that steps, kinks, and other surface imperfections play a crucial role in surface chemistry. For example, the study of many systems such as N and O adsorbed on Ru(0001),hamm00 O on Pt(111),feib96 or C2H4 on Ag(100)koka02 has shown that monoatomic steps can bind adsorbates more strongly than terrace sites. Moreover it has been shown that this kind of defects can completely determine the kinetics of dissociation in systems such as, for example, N2 and NO on Ru(0001),dahl99 ; zamb96 O2 on Pt(111),gamb01 N2 on Fe(110) and Fe/Ru(0001).egeb01
The role of steps in the dynamics of O2/Ag interaction has been recently investigated by Rocca and coworkerssavi01 ; savi02 ; vatt03 who have studied the Ag(410) and Ag(210) surfaces. These surfaces are vicinal of Ag(100) and are characterized by open (110) steps and three-atom- and one-atom-row wide (100) terraces, respectively. Using a supersonic molecular beam to dose O2 onto Ag surfaces at selected angles of incidence and different kinetic energies, and characterizing the adsorbed species by vibrational spectroscopy (HREEL), these authors have investigated the various oxygen species which form on these surfaces. It was concluded that O2 dissociation occurs mainly at the steps and that atomic oxygen adsorbs at different surface sites. In particular, HREEL spectra show two peaks in the frequency region of the O/Ag stretch modes, at about 32 and 40 meV. These frequencies are quite similar to those observed in O/Ag(100) (33 meV)baut99 and on the added-row reconstructed O/Ag(110) surface (40 meV).vatt94 It was thus proposed to assign the low energy peak to adatoms occupying (100) terrace sites and the one at higher energy to atomic oxygen adsorbed at the step edges forming O–Ag–O chains similar to the added rows found in reconstructed O/Ag(110) surfaces.cour97 ; schi93 In O/Ag(210) an additional peak around 56 meV was found, and it was proposed that it is due to the vibration of an oxygen atom occupying a subsurface site.
Motivated by these results we have performed ab initio calculations aimed at understanding the role of the steps in the adsorption of atomic oxygen on the Ag(410) and Ag(210) surfaces. In the present work we limit our investigation to on-surface atomic oxygen, subsurface and molecular adsorption will be addressed in separate papers. Our results show that on these vicinal surfaces the adsorption configuration in which the adatoms decorate the steps in a (11) geometry is particularly stable. The oxygen adsorption on the two surfaces presents however significant differences related to the availability of adsorption sites on terraces. Indeed, on Ag(410), terrace and step edge sites have comparable chemisorption energies and, in particular, the hollow sites on terraces are slightly more favored than the step edge sites when the adatoms are far apart from each other. At higher coverage, instead, adatoms slightly prefer to decorate the steps. On Ag(210), the absence of favorable terrace sites makes the step decoration much more stable than any other adsorption configurations. The formation of these O–Ag–O chains at step edges will be shown to significantly affect both the geometrical structure and the electronic properties of the surface. As we have already mentioned, the occurrence of adsorption on both the terraces and steps of vicinal Ag(100) surfaces was also proposed based on an analysis of the HREEL spectra, recently measured for these systems.savi01 ; savi02 ; vatt03 Our calculation of the vibrational properties of these systems—performed within density-functional perturbation theory—provides a further support to this analysis.
The paper is organized as follows. In Section II we describe the theoretical approach and computational details of our work. Section III contains our results for the energetics, the geometrical and electronic structures, and for the vibrational properties of the systems we have investigated. The last Section is devoted to our conclusions.
II Computational framework
All the calculations have been performed within density functional theory (DFT) using the generalized gradient approximation (GGA) with the Perdew-Burke-Ernzerhof (PBE) exchange-correlation functional.PBE Vibrational properties have been calculated using density-functional perturbation theory (DFPT).baro87 ; gian91 ; dalc97 ; baro01 We have used the pseudopotential method with ultra-soft pseudopotentials vand90 and plane-wave basis sets up to a kinetic-energy cutoff of 27 Ry (216 Ry for the charge-density cutoff). Details about the Ag and O pseudopotentials are reported in Ref. cipr02, . Brillouin zone (BZ) integrations have been performed with the Gaussian-spreading special-point techniquemonk76 ; meth89 with a smearing parameter of 0.03 Ry. All the calculations have been performed using the PWscf and PHONON packages,PWSCF_WEB while molecular graphics has been generated with the XCRYSDEN package.XCRYSDEN
Surfaces are modeled with periodic super-cells. For the Ag(410) and Ag(210) surfaces we have used slabs of 20 (410) layers and 14 (210) layers, respectively. For the Ag(100) surface and the (21) added-row reconstructed Ag(110) surface [Ag(110)p(21)O] we have used slabs of 7 layers. Adjacent slabs are separated by a vacuum region of at least 16 a.u. and O atoms are adsorbed on both sides of the slabs. All the structures have been fully relaxed until the Hellmann-Feynman forces were smaller than Ry/a.u. Atomic oxygen adsorption on Ag(410) and Ag(210) has been modeled by (11) and (21) surface super-cells. For the Ag(410) surface the BZ integrations have been performed using a (841) and a (441) uniform shifted -meshkmesh for the (11) and (21) structures, respectively, while for Ag(210) () and () meshes have been used for (11) and (21) structures, respectively. For the c(22) cell on Ag(100) we have used a () mesh, while for the Ag(110)p(21)O surface we have used a () mesh. Spin polarization effects have been neglected after checking that the interaction between O and Ag substrate results in a negligible spin moment on the O atom.
The chemisorption energies, , are referred to the clean Ag(10), or , surface and the isolated oxygen molecule:
| (1) |
where the total energy of the adsorbate–substrate system, of the clean surface, of the isolated O2 molecule, and the number of adsorbed oxygen atoms are represented by , , and , respectively. With this definition, stable adsorbates have negative chemisorption energies. Considering the errors in the structural relaxation and the energy convergence with respect to the plane wave cutoff energy and the k-point density, we estimate an overall numerical accuracy for the chemisorption energies of about 30 meV.
The PBE GGA functional used in the present work slightly overestimates the binding energy of the O2 molecule: 5.50 eV, as calculated using spin-polarized GGA with a 15 Å-wide cubic box, while the experimental value is 5.23 eV.O2 Molecular overbinding is a common drawback of current implementations of DFT. This fact, of course, does not affect the conclusions of the present work which mainly concerns the relative stability of different adsorption configurations.
Vibrational frequencies are calculated by diagonalizing the dynamical matrices of large slabs containing more that 50 atomic layers. The common procedure for calculating the dynamical matrices of such large slabs is to patch the dynamical matrices obtained for much smaller slabs (in fact, the same which were used to determine the structural properties, as described above) with the interatomic force constants calculated for the bulk metal.baro01 The dynamical matrices of the Ag bulk have been calculated on a 444 grid of q-points in the BZ and the interatomic force constants have been obtained by a Fourier transform.baro01 For the thin slabs, we have computed only the parts of the dynamical matrices which refer to the displacements of the adsorbates and of the uppermost Ag layers. Diagonalizing the dynamical matrix of the extended slab we have calculated the vibrational modes of the systems and we have identified the adsorbate-substrate modes from the displacements eigenvectors. The estimated numerical accuracy of the vibrational frequencies so obtained is of about 1 meV.
III Results
III.1 Energetics
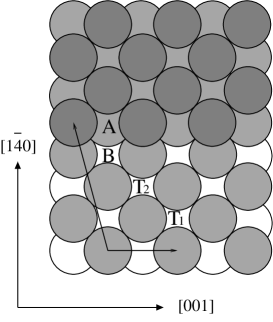
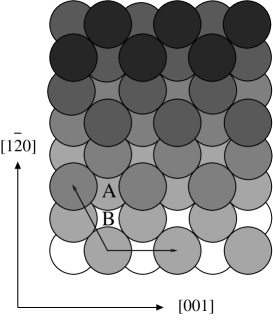
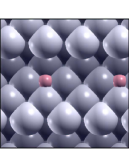
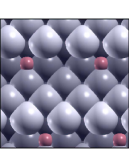
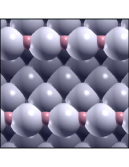
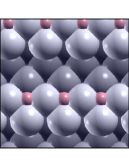
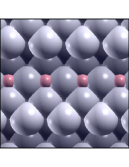
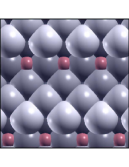
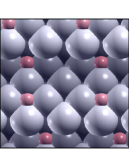
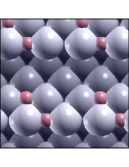
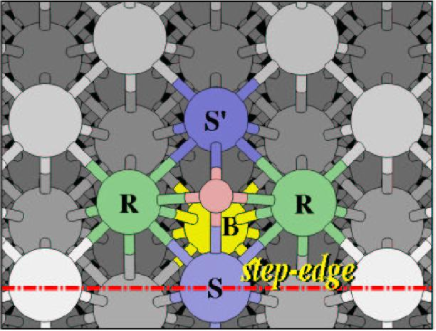
In Fig. 1 we display the four adsorption sites that we have considered in the present work: site A with O just above the step and coordinated with three Ag surface atoms; sites T1 and T2 with the adatom in the hollow sites on the (100) terrace; site B where O adatom lies in the hollow site just below the step. Note that no terrace T1 and T2 sites are available on the Ag(210). Top and bridge sites are not considered here since we have found that they are much less stable than hollow sites, as on Ag(100) surface.cipr02
III.1.1 O/Ag(410)
Let us first consider the adsorption of atomic oxygen on the Ag(410) surface. In Table 1 we present the chemisorption energies corresponding to different adsorption configurations (see Fig. 2). At low coverage ( 1/8 ML)cover where the adatoms stay far apart from each other, the hollow sites on terraces (T1 and T2) and the step-edge site (A) are almost degenerate in energy, with terrace sites being only slightly more favored than site A, while site B is much less stable. In these configurations the distances between the O atoms are quite large (8.32 Å) and this suggests a negligible interaction between the adatoms, as confirmed by test calculations done at lower coverages in which the OO distance is increased. At higher coverage ( 1/4 ML) we have examined various possible geometries which we indicate with the notation ‘S1–S2’, where the S’s stand for two near A, B, T1 and T2 sites being occupied by two O adatoms in a (21) super-cell. The S1–S1 arrangements correspond to a (11) periodicity where O adatoms form rows parallel to the steps. Those configurations in which the separation between the adatoms is larger than 5 Å are not considered since we expect that their adsorption energies should be very similar to those at low coverage. Indeed, as we will show, already for O–O distances as small as 4 Å the interaction between the adsorbates has small effects on the chemisorption energies. Our results show that the S1–S1 configurations with both the adatoms on the terrace or above the step and the A–T2 arrangement are the most stable adsorption geometries. As in the case of low coverage the differences in chemisorption energy between these sites are quite small, but in this case we find that oxygen adatoms slightly prefer to decorate the step edges. One expects that occupying adjacent sites should be unfavorable because of the electrostatic repulsion between negatively charged oxygen adatoms. Indeed, for example, Feibelman and co-workersfeib96 have shown that O adatoms on Pt(211) vicinal surface decorate the steps in a (21) adsorption geometry while the (11) structure—where the distance between adjacent oxygens is about 2.8 Å—is significantly less stable. Our results indicate that this effect on Ag(410) surface is important only when nearest neighbor sites are occupied, i.e. when the distance between the adatoms is less than 4 Å (as in A–T1, T1–T2, T2–B and A–B, configurations), while it is weak and uneffective in the other geometries. Compare for example the A–T2 and A–T1 configurations which consist of one adatom sitting above the step while the other sits at a terrace site. In the A–T2 arrangement the distance between the O atoms is 4.23 Å and their chemisorption energy (0.80 eV) is quite close to the values found for oxygen adsorption at sites A and T2 at low coverage (0.75 eV and 0.83 eV), indicating a small adsorbate-adsorbate interaction. In the A–T1 configuration, instead, the O–O distance is only 3.26 Å and the adsorption energy of the adatoms (0.59 eV) is strongly reduced with respect to when oxygen is adsorbed at sites A and T1 at low coverage (0.75 eV and 0.80 eV). Moreover, it is interesting to observe that in the A–T1 geometry the electrostatic repulsion strongly affects also the locations of the adatoms. Indeed we find that the adsorbates are slightly displaced from the hollow positions and that their distance, 3.26 Å, is considerably larger than the separation between two nearest hollow sites of the clean surface (about 2.9 Å). This is a clear indication that the two adatoms repel each other.
III.1.2 O/Ag(210)
Similar calculations have been performed also for the Ag(210) surface. The two surfaces differ in the width of the terrace (see Fig. 1). No terrace hollow sites are available on the Ag(210) surface. In Table 2 we report the chemisorption energies for O adsorbed in various configurations on this surface. These results display the same trend as obtained for Ag(410), although the chemisorption energies are somewhat smaller here. Due to the lack of stable adsorption sites on the terraces, the formation of O–Ag–O rows at the step edges (i.e. the A–A configuration) is by far energetically favored on this surface. The second most stable configuration at higher coverage ( ML) is therefore A–B, which is 0.24 eV less bound than A–A. In contrast, on Ag(410) several other configurations that involve terrace sites are more stable than A–B and much closer in energy to the A–A configuration. Comparing the chemisorption energies of various configurations, irrespective of the O coverage, we find that the difference between the most favored A–A configuration and the second most stable one is 0.03 and 0.12 eV for Ag(410) and Ag(210) surfaces, respectively.
III.1.3 The stability of O–Ag–O rows
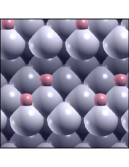
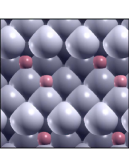
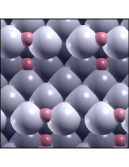
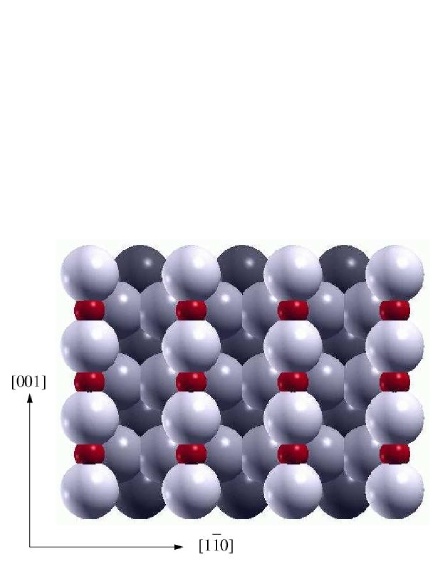
One of the most peculiar results of our calculations is the increase of the stability of oxygen adatoms when they decorate the step edge in a (11) geometry. We believe that the mechanism responsible for this behavior could be related to the arrangement of O adatoms to form O–Ag–O chains at the upper side of the (110) steps. Indeed, the A–A adsorption configuration is similar to that occurring in the reconstruction of the Ag(110) surface upon oxygen adsorption, in which O atoms align in added-rows along the [001] direction, thus forming stable O–Ag–O structurescour97 ; schi93 (the Ag(110)p(21)O surface is shown in Fig. 3). As we have pointed out in the introduction, this similarity between the two structures was first suggested from a comparison of the vibrational properties of the two surfaces.savi02
Before analyzing in detail the structural and electronic features related to the formation of these chains, it is interesting to consider the effects of the substrate relaxation on the chemisorption energies. For this reason we have repeated some calculations for O/Ag(410) keeping the substrate fixed in the optimized clean surface geometry and allowing the adatoms to relax (see values in parentheses in Table 1). Our results show that at low coverage the T2 site is more stable than A site even if substrate relaxation is not considered. On the other hand, in the (11) periodicity O adatoms in A–A and T2–T2 configurations have the same chemisorption energy on a fixed substrate. This result indicates that the enhanced stability of atomic oxygen on the step in the (11) geometry is mainly determined by the energy gain due to surface relaxation allowed by the presence of the steps.
III.2 Geometrical structure
In order to illustrate the characteristic features of the O–Ag–O chain formation at the step edges, we discuss now the effects of oxygen adsorption on the geometry of the surface. To facilitate the discussion, we first define a few labels for silver atoms—AgR, AgS, and AgB—as in Fig. 4.labels-note
III.2.1 O/Ag(410)
In table 3 we report the optimized structural parameters describing the oxygen adsorption on Ag(410) at 1/8 ML and at 1/4 ML for the S1–S1 configurations. First of all it is interesting to observe the dependence of the bond lengths between the adsorbate and the nearest metal atoms on the number of neighboring substrate atoms. As predicted by effective medium theory, hamm97 the larger the number of nearest metal atoms the longer the bond length. Indeed the results in Table 3 (observe in particular and ) show that the three-fold coordinated step-edge is the site in which O is closest to the surrounding silver atoms; O in the two four-fold coordinated terrace sites has similar structural features, while O—when sitting in the site just below the step, close to four atoms of the terrace and to two atoms of the step—is the furthest from neighboring metal atoms.
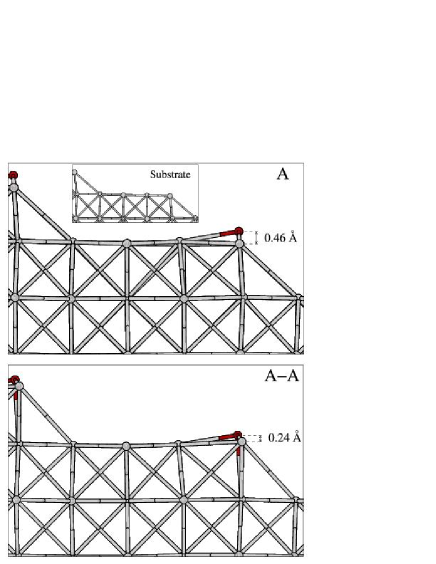
We now focus on the structural features of oxygen adsorption at sites A and T2. In Fig. 5 we compare the structure of the first three layers of the substrate for the A and A–A geometries. At low coverage the main substrate distortions due to the presence of the adatom are a shift of 0.18 Å of the nearest Ag terrace atom towards the center of the terrace (see in Table 4) and an expansion of 0.16 Å of the distance between the two Ag atoms on the step near oxygen (see in Table 4). The result is that the adatom sits in a site equidistant ( = 2.21 Å) from the three Ag surface atom surrounding it. In the A–A configuration the distortion has different features. In this case symmetry does not allow the two Ag step atoms near oxygen to be displaced parallel to the step, so that these atoms move only outward. This is indicated by a marked expansion of the bond lengths between the Ag step atom and the Ag atoms on terrace (by 0.25 Å) and below the adatom (by 0.16 Å). In this case the oxygen is closer to the Ag step atoms ( = 2.10 Å) than to the nearest Ag atom on terrace ( = 2.24 Å). Note also that the angle, , between the bonds of oxygen with the two Ag atoms of the step—which directly measures the alignment of the Ag–O–Ag structures—is larger at high than at low coverage (164∘ versus 156∘). Thus, in the A–A geometry oxygen and silver atoms on the step tend to align forming an almost straight O–Ag–O chain which is more stable than other adsorption configurations. As we have already pointed out, the O–Ag–O chains at the step edges have a similar structure as the added rows in the reconstructed O/Ag(110) surface, so it is interesting to compare the geometries of the two systems. In Table 3 we report some predicted structural quantities for the Ag(110)p(21)O surface. Our results are in good agreement with experimentscane93 and previous DFT calculations.kata99 As we can observe, the alignment of O and Ag atoms in the added rows on Ag(110) is more pronounced than in the A–A configuration (compare, for example, the angle in the two geometries), but the similarity between the two structures is clear.
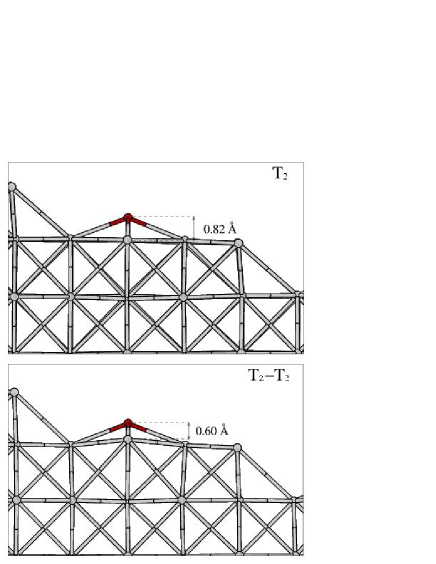
Fig. 6 shows the structures of T2 and T2–T2 configurations. In these systems the height of the adatom with respect to the terrace is larger than when the oxygen is chemisorbed on the step. Also in this case in the (11) geometry the silver atoms in the row of oxygens move up towards adatoms, but here the alignment between O and Ag atoms is less pronounced than when oxygen atoms are on the step.
III.2.2 O/Ag(210)
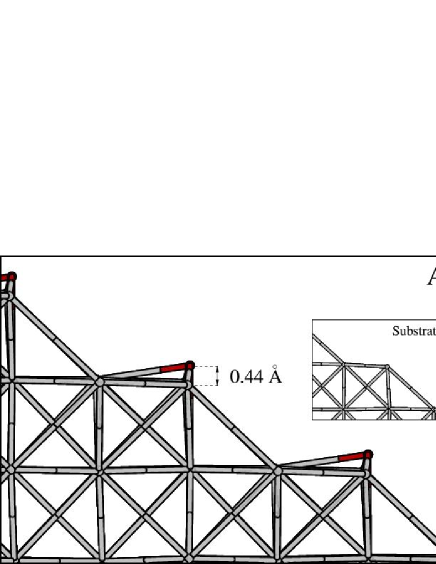
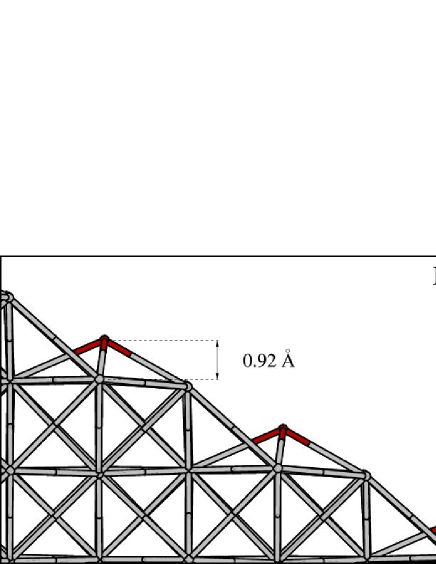
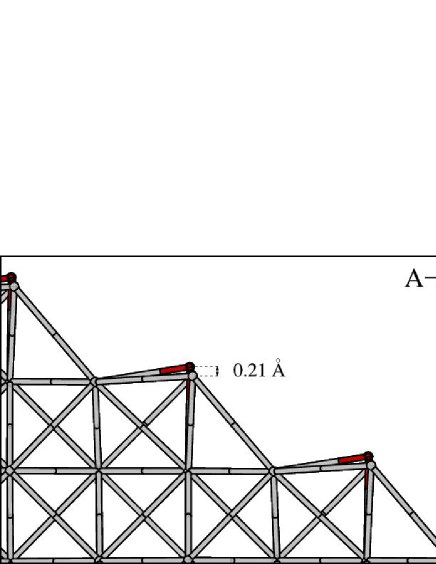
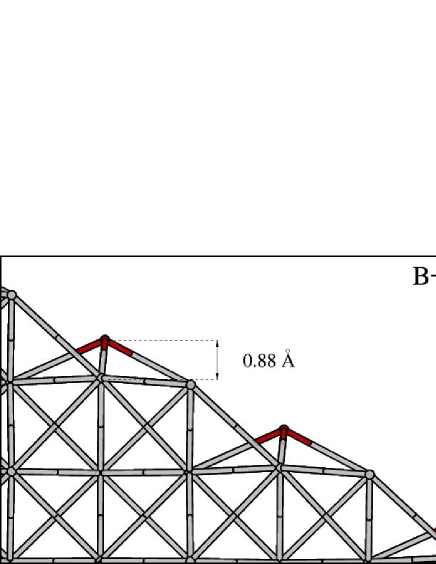
In Table 5 we report the optimized structural parameters describing the oxygen adsorption on Ag(210) at 1/4 ML and at 1/2 ML for the S1–S1 configurations, while Fig. 7 shows the side views of the corresponding optimized O/Ag(210) structures. These data and plots reveal the same trend as for Ag(410) surface. The most apparent feature is that the height of the O adatoms above the surface is much smaller for A and A–A sites than for the B and B–B sites. Note also the difference between the pattern of the substrate reconstruction for A (low coverage) and A–A (high coverage) configurations. Like on the Ag(410) surface, the adsorption of O adatoms induces an outward relaxation of step Ag atoms for both the A and A–A configurations. In the case of the A configuration this relaxation is not large enough to compensate the inward relaxation of the clean substrate (see the inset of top-left panel of Fig. 7), therefore Ag atoms at the step appear to be pushed somewhat inward, like in the case of the clean Ag(210) substrate. On the contrary, this relaxation is quite significant in the A–A configuration, resulting in a marked expansion of the bond length between the Ag step and terrace atoms ( Å), and between the Ag step atom and Ag atom located below the O adatom ( Å). Note that the step Ag atoms appear to be pushed outwards. Contrary to the A–A geometry, in the A configuration the step Ag atoms also relax laterally along the step-edge direction away from O adatom—the distance between the two step Ag atoms that are bound to the same O adatom being increased by 0.17 Å.
III.3 Electronic structure
In order to better characterize the different behavior of oxygen on the step in A and A–A configurations we have analyzed the corresponding electronic structure. Here we present the analysis of the electronic structure of O/Ag(410) only—the conclusions for O/Ag(210) being similar.
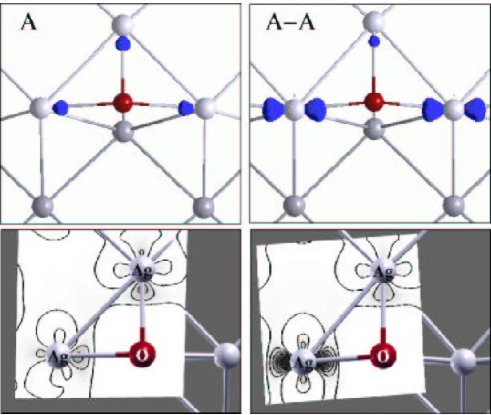
The interaction between oxygen and silver removes electronic charge from the silver atoms neighboring the O adatom. The electron deficit regions around the silver atoms are shown in Fig. 8 (blue isosurfaces). It is interesting to observe that while at low coverage the deficit regions around the three Ag atoms are very similar, thus indicating a similar donation of charge, in the A–A configuration the flow of charge to oxygen adatoms is mainly due to silver atoms on the step. This suggests that the O–Ag–O chains that form in the (11) geometry have the structure of electrostatically stable strings.
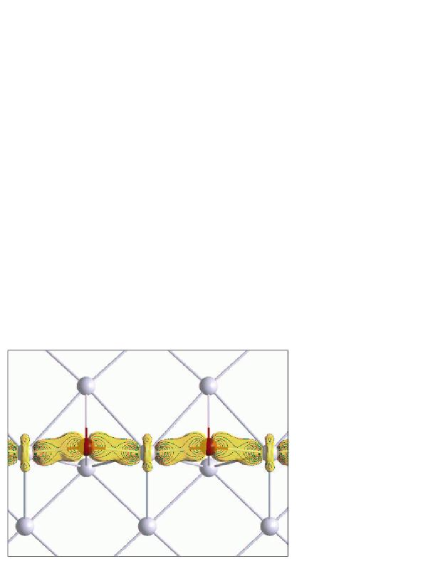
The analysis of the density of states reveals that the bond between oxygen and silver is not purely ionic. In Fig. 9 we display the density of states projected (PDOS) onto the oxygen adatom and onto the nearest silver atoms for both the A and A–A geometries. The PDOS on O atoms shows that the interaction of the O 2 state with the 4 metal band results in the formation of two regions of high density of states, which correspond to bonding and antibonding states. The bonding states are located at the bottom of the 4 Ag band while the antibonding ones are mainly below the Fermi level. Note that the O 2 level lies below the bottom of the valence band (at about 17 eV with respect to the Fermi level) and it is not shown in the figures. The main difference between the PDOS in the two geometries is that at high coverage additional features appear 6–7 eV below the Fermi level. The figure clearly shows that these states are due the hybridization of oxygen 2 orbitals and 4 orbitals of the silver atoms on the step (AgR). By inspection of the components of these orbitals we find that the mixing is mainly between O 2 orbital parallel to the step-edge and Ag 4 orbital parallel to the terrace plane. This hybridization is very efficient because of the good alignment between O and Ag atoms on the step. The spatial distribution of these states is illustrated in Fig. 10, where we display the integrated local density of states (ILDOS)koka02 in the energy window (7.0, 6.0) eV comprising the two small peaks in the PDOS. The figure shows quite clearly the bond between oxygen and silver atoms on the step. It is worth noting that in the other S1–S1 configurations there are no states in this energy region even if we find an increase of the density of states around eV, especially in the T2–T2 geometry.
The study of the electronic structure of the added-row reconstructed Ag(110) surface confirms that the presence of bonding states 6–7 eV below the Fermi level is related to the formation of aligned O–Ag–O–Ag structures. Indeed we find similar spectral features also in the DOS of Ag(110)p(21)O and their spatial distribution closely resembles that shown in Fig. 10. Note that the results of experimental studiescour97 ; seki00 show a quite weak oxygen-induced feature in this energy range.
III.4 Oxygen vibrational modes
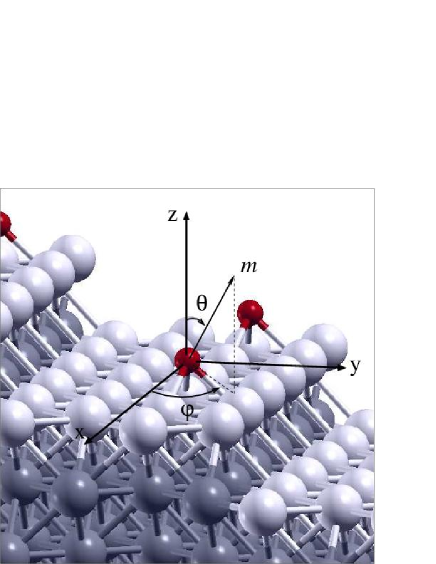
In Table 7 we present the frequencies of the adsorbate modes and the directions of the corresponding displacement eigenvectors (the angles are defined in Fig. 11) for different O/Ag systems. Before analyzing the vibrational modes of oxygen on Ag(410) and Ag(210), it is useful to discuss the vibrational properties of the O/Ag(100) system with oxygen adsorbed in hollow sites and of the added-row reconstructed Ag(110) surface. Data for the Ag(100)c(22)O structure—which had already been calculated in Ref. loff03, in the local density approximation (LDA)—have been recalculated within the present GGA approach, giving quite similar results (not unusually, GGA frequencies result to be slightly red-shifted with respect to LDA). The mode perpendicular to the surface vibrates at 30 meV in agreement with the peak at 30-32 meV observed in the HREEL spectra of the non-reconstructed O/Ag(100) surface.loff03 The modes and at 50 meV are two in-plane degenerate modes. For the Ag(110)p(21)O structure we find a vibrational mode, , perpendicular to the surface at 38 meV. This value has to be compared with the feature around 41 meV observed in HREEL spectra.vatt94 ; stie94 Besides this dipole-active mode two other adsorbate modes exist, at 28 meV and at 73 meV, in which the adatom vibrates parallel to the surface plane. The polarization of the softer mode is perpendicular to the added row while the other one is parallel to it. It is interesting to observe that the mode is even harder than the in-plane modes ( and ) of Ag(100)c(22)O because the oxygen atom sits closer to the nearest silver atoms in the added row reconstructed Ag(110) surface ( = 0.10 Å) than in the Ag(100)c(22)O structure ( = 0.71 Å)cipr02 .
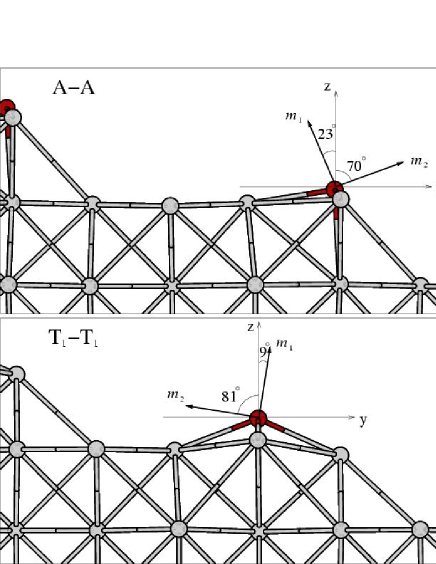
We now focus on the vibrational properties of the A-A adsorption geometry on Ag(410) and Ag(210). The mode at higher frequency ( at 68 meV and 71 meV for Ag(410) and Ag(210) respectively) in which the adatom vibrates parallel to the Ag–O–Ag chain at the step is very similar to the mode of the Ag(110)p(21)O structure. The softer modes are due to vibrations of the adsorbate in a plane perpendicular to the step edge (these two modes for the Ag(410) surface are shown in the upper panel of Fig. 12). The mode at 24 meV is nearly parallel to the (110) plane of the step while the mode at 37 meV is almost perpendicular to it. These modes resemble very closely the and modes of the Ag(110)p(21)O surface. The displacement pattern of these two modes suggests that they could both be dipole active. In particular the mode could be responsible of the spectral feature around 40 meV observed in the HREEL spectra of these surfaces.
For the Ag(210) surface we have also investigated the A configuration to understand the effect of the Ag–O–Ag chain formation at the step on the vibrational properties. In this case both the frequency and the displacement eigenvectors of the softer modes, and , change very little with respect to the A–A arrangement. The mode is polarized parallel to the step and is significantly softer than in the A–A structure (46 versus 71 meV) mainly because in this case the height of the adatom with respect to the step Ag atoms is larger than in the A–A geometry.
Since the hollow terrace sites on Ag(410) compete in energy with the step edge sites, we have also investigated the vibrational properties of a very stable adsorption configuration which involves terrace sites, namely the T1–T1 geometry. In the lower panel of Fig. 12 we show the and modes in the plane perpendicular to the step. The mode at 29 meV is due to the vibration of O nearly perpendicular to the (100) terrace plane while the mode at 32 meV is due to O vibrating almost parallel to this plane. The harder mode, , is at 58 meV and it corresponds to the oxygen vibration parallel to the step edge. Our calculations show clearly that the mode is very similar to the dipole active mode of the c(22) O adsorption geometry on Ag(100). It seems thus reasonable to expect that the spectral feature around 32 meV observed in HREEL spectra on Ag(410) could be due to this stretching mode.
Finally we have calculated the vibrational modes for the B–B adsorption geometry on Ag(210). An adatom at site B is significantly less stable than at the step edge, but it is interesting to investigate its vibrational properties since this is the only terrace site available on Ag(210) and the HREEL spectra of this surface show, in addition to the 40 meV peak, other spectral features around 30 meV and 56 meV. As it is shown in Table 7, the higher frequency mode, at 37 meV, is parallel to the step edge, while the other two modes are in the plane perpendicular to it. In particular the mode at 27 meV is nearly perpendicular the (110) step plane, while the other, at 34 meV, is almost parallel to it.
Two important results emerge from this analysis. The mode in the T1-T1 configuration of O/Ag(410) at 29 meV lies very close to the mode of O/Ag(100) (30 meV), in correspondence with the spectral feature around 32 meV observed in HREEL spectra on Ag(410).savi01 ; savi02 ; vatt03 The modes of the A-A configuration in O/Ag(210) and O/Ag(410) (both at 37 meV) lie close to the frequency in the added-row O/Ag(110) surface [Ag(110)p(21)O] at 38 meV, in correspondence with the spectral feature around 40 meV observed in the HREEL spectra of O/Ag(410) and O/Ag(210) surfaces.savi01 ; savi02 ; vatt03 We believe that this correspondence between infrared-active vibrational modes, calculated for specific configurations, and the features found in the experimental HREEL spectra supports the proposed assignment of those spectral features to atomic species adsorbed on terraces and at step edges. Problems still remain in the interpretation of the HREEL spectra of O/Ag(210). On one hand, the feature experimentally found at 32 meV could be due to the vibration of oxygen occupying the only available terrace sites (site B), but this assignment remains uncertain since the adsorption on these sites is energetically unfavored. On the other hand, no vibration is predicted near 56 meV, where a feature in the experimental spectrum is also found. This feature could be the signature of other O species, possibly adsorbed subsurface, which we have not investigated in the present work. For sure, these issues call for further theoretical and, possibly, experimental work.
IV Conclusions
In this paper we have investigated the adsorption of oxygen on Ag(410) and Ag(210) surfaces. Our results show that the step edge decoration is particularly stable on both surfaces. While on Ag(410) adsorption on terrace and at the step edge compete in energy and no clear preference is predictable, on Ag(210) the step decoration is significantly favored with respect to other adsorption configurations. The formation of this stable O–Ag–O rows at the step edges strongly affects both the structural and the electronic properties of the surface, and leaves a clear fingerprint in the HREEL spectrum of these systems at 40 meV.
The situation is less clear for the HREEL peak at 32 meV. On Ag(410) it is reasonable to assign this spectral feature to adatoms occupying terrace sites. On Ag(210) instead this O–Ag stretch mode could be due to O atoms adsorbed on terraces at the step foot, which however are predicted to be metastable adsorption sites. Among the adsorption configurations that we have investigated, no candidate was found to support the vibrational mode experimentally found at 56 meV. This suggests that other O species, possibly adsorbed subsurface, would be responsible for this spectral feature.
Acknowledgments
This work has been supported by INFM (Iniziativa trasversale calcolo parallelo, Sezioni F e G, and PAIS Chemde) and by the Italian MIUR through PRIN. All numerical calculations were performed at the CINECA national supercomputing center in Bologna (Italy).
References
- (1) R. A. van Santen and H. P. C. E. Kuipers, Adv. Catal. 35 (1987) 265.
- (2) B. Hammer, Surf. Sci. 459, 323 (2000).
- (3) P. J. Feibelman, S. Esch, and T. Michely, Phys. Rev. Lett. 77, 2257 (1996).
- (4) A. Kokalj, A. Dal Corso, S. de Gironcoli, and S. Baroni, J. Phys. Chem. B 106, 9839 (2002).
- (5) S. Dahl, A. Logadottir, R. C. Egeberg, J. H. Larsen, I. Chorkendorff, E. Törnqvist, and J. K. Nørskov, Phys. Rev. Lett. 83, 1814 (1999).
- (6) T. Zambelli, J. Wintterlin, J. Trost, and G, Ertl, Science 273, 1688 (1996).
- (7) P. Gambardella, Ž. Šljivančanin, B. Hammer, M. Blanc, K. Kuhnke, and K. Kern, Phys. Rev. Lett. 87, 056103 (2001).
- (8) R. C. Egeberg, S. Dahl, A. Logadottir, J. H. Larsen, J. K. Nørskov, and I. Chorkendorff, Surf. Sci. 491, 183 (2001).
- (9) L. Savio, L. Vattuone, and M. Rocca, Phys. Rev. Lett. 87, 276101 (2001).
- (10) L. Savio, L. Vattuone, and M. Rocca, J. Phys. Condens. Matter 14, 6065 (2002).
- (11) L. Vattuone, L. Savio, and M. Rocca, Phys. Rev. Lett. 90, 228302 (2003).
- (12) F. Bautier de Mongeot, A. Cupolillo, U. Valbusa, and M. Rocca, Chem. Phys. Lett. 302, 302 (1999).
- (13) L. Vattuone, U. Valbusa, and M. Rocca, Surf. Sci. Lett. 317, L1120 (1994).
- (14) R. Courths, S. Hüfner, P. Kemkes, and G. Wiesen, Surf. Sci. 376, 43 (1997).
- (15) T. Schimizu and M. Tsukada, Surf. Sci. Lett. 295, L1017 (1993).
- (16) J. P. Perdew, K. Burke, and M. Ernzerhof, Phys. Rev. Lett. 77, 3865 (1996).
- (17) S. Baroni, P. Giannozzi, and A. Testa, Phys. Rev. Lett. 58, 1861 (1987).
- (18) P. Giannozzi, S. de Gironcoli, P. Pavone, and S. Baroni, Phys. Rev. B 43, 7231 (1991).
- (19) A. Dal Corso, A. Pasquarello, and A. Baldereschi, Phys. Rev. B 56, R11369 (1997); A. Dal Corso, Phys. Rev. B 64, 235118 (2001).
- (20) S. Baroni, S. de Gironcoli, A. Dal Corso, and P. Giannozzi, Rev. Mod. Phys. 73, 515 (2001).
- (21) D. Vanderbilt, Phys. Rev. B 41, R7892 (1990).
- (22) G. Cipriani, D. Loffreda, A. Dal Corso, S. de Gironcoli, and S. Baroni, Surf. Sci. 501, 182 (2002).
- (23) H. J. Monkhorst and J. D. Pack, Phys. Rev. B 13, 5188 (1976).
- (24) M. Methfessel and A. T. Paxton, Phys. Rev. B 40, 3616 (1989).
- (25) S. Baroni, A. Dal Corso, S. de Gironcoli, and P. Giannozzi, PWscf and PHONON: Plane-wave pseudo-potential codes, http://www.pwscf.org/ (2001).
- (26) A. Kokalj, J. Mol. Graphics Modelling 17, 176 (1999). A. Kokalj, and M. Causà, http://www.xcrysden.org/ (2003).
- (27) The BZ integrations have been performed using the uniformly spaced and shifted -meshes. Such a mesh is generated by the following recipe: (i) define the sequence of numbers ; and (ii) generate the following distinct points: , where , , and are reciprocal lattice vectors. It can be shown, taking into account the tranlational symmetry, that in case of even mesh (i.e. even set of values) such mesh coincides with the Monkhorst-Pack mesh. monk76
- (28) Our value for the bond energy of O2 is smaller than other DFT-PBE results. For example, Hammer et al.hamm99 obtained 5.81 eV and 5.99 eV with pseudopotential calculations, while Perdew et al.PBE obtained 6.24 eV with an all-electron calculation. In agreement with the results reported in Ref. hamm99, , we have found that the bond energy of O2 is quite sensitive to the details of the pseudopotential. However the conclusions of the present work are not affected by the pseudopotential approximation, as confirmed by test calculations performed with an harder pseudopotential for O which gives a O2 bond energy closer to the values reported by Hammer.hamm99 Note that in our calculation the nonspherical density for the oxygen atom is taken into account.
- (29) B. Hammer, L. B. Hansen, and J. K. Nørskov, Phys. Rev. B 59, 7413 (1999).
- (30) The coverage is defined as the number of oxygen atoms divided by the number of Ag surface atoms in the unit-cell.
- (31) Although the Ag(10) substrate possesses the mirror-plane symmetry, which is parallel to [] crystal axis and perpendicular to [001] axis (i.e. the plane passes through the AgS and Ag atoms in Fig. 4), we have not imposed this symmetry in our calculations. Therefore the two R atoms in Fig. 4 are located in slightly asymmetric positions, and in Tabs. III–VI the distances labeled as , , , and are averaged distances.
- (32) B. Hammer and J. K. Nørskov, in Chemisorption and Reactivity on Supported Cluster and Thin Films, edited by R. M. Lambert and G. Pacchioni (Kluwer Academic, The Netherlands, 1997), pp. 285–351.
- (33) M. Canepa, P. Cantini, F. Fossa, L. Mattera, and S. Terreni, Phys. Rev. B 47, 15823 (1993).
- (34) H. Katagiri, T. Uda, and K. Terakura, Surf. Sci. 424, 322 (1999).
- (35) D. Sekiba, H. Nakamizo, R. Ozawa, Y. Gunji, and H. Fukutani, Surf. Sci. 449, 111 (2000).
- (36) F. Stietz, A. Pantförder, J. A. Schaefer, G. Meister, and A. Goldmann, Surf. Sci. 318, L1201 (1994).
- (37) D. Loffreda, A. Dal Corso, S. Baroni, L. Savio, L. Vattuone, and M. Rocca, Surf. Sci. 530, 26 (2003).
| (ML) | Configuration | (Å) | (eV) |
|---|---|---|---|
| A | 8.32 | 0.75 (0.66) | |
| 1/8 | T1 | 8.32 | 0.80 |
| T2 | 8.32 | 0.83 (0.76) | |
| B | 8.32 | 0.60 | |
| A–A | 4.16 | 0.86 (0.70) | |
| T1–T1 | 4.16 | 0.78 | |
| T2–T2 | 4.16 | 0.79 (0.69) | |
| B–B | 4.16 | 0.54 | |
| 1/4 | A–T2 | 4.23 | 0.80 |
| T1–B | 4.22 | 0.63 | |
| A–T1 | 3.26 | 0.59 | |
| T1–T2 | 3.22 | 0.66 | |
| T2–B | 3.23 | 0.54 | |
| A–B | 3.30 | 0.56 |
| (ML) | Configuration | (Å) | (eV) |
|---|---|---|---|
| 1/4 | A | 5.10 | 0.68 |
| B | 5.10 | 0.49 | |
| A–A | 4.16 | 0.80 | |
| 1/2 | B–B | 4.16 | 0.42 |
| A–B | 3.62 | 0.56 |
| (ML) | Configuration | (Å) | (Å) | (Å) | (Å) | (Å) | (∘) |
| A | 2.21 | 2.21 | 2.43 | 0.46 | 156 | ||
| 1/8 | T1 | 2.27 | 2.26 | 2.29 | 2.97 | 0.80 | 138 |
| T2 | 2.28 | 2.25 | 2.25 | 2.99 | 0.82 | 138 | |
| B | 2.30 | 2.24 | 2.37 | 3.08 | 0.88 | 134 | |
| A–A | 2.10 | 2.24 | 2.40 | 0.24 | 164 | ||
| 1/4 | T1–T1 | 2.15 | 2.31 | 2.30 | 2.91 | 0.55 | 150 |
| T2–T2 | 2.17 | 2.28 | 2.29 | 2.92 | 0.60 | 148 | |
| B–B | 2.20 | 2.27 | 2.37 | 2.99 | 0.71 | 142 | |
| Ag(110)p(21)O | 2.08 | 0.10 | 175 |
| (ML) | Configuration | (Å) | (Å) | (Å) | (Å) |
|---|---|---|---|---|---|
| A | 4.32 (4.16) | 3.08 (2.90) | 2.93 (2.84) | ||
| 1/8 | T1 | 4.26 | 2.97 (2.91) | 2.98 (2.90) | 3.07 (2.91) |
| T2 | 4.26 | 2.98 (2.92) | 3.00 (2.92) | 3.04 (2.92) | |
| B | 4.24 | 2.99 (2.92) | 2.98 (2.91) | 3.06 (2.96) | |
| A–A | 4.16 | 3.15 | 3.00 | ||
| 1/4 | T1–T1 | 4.16 | 3.00 | 2.99 | 3.15 |
| T2–T2 | 4.16 | 2.99 | 2.99 | 3.12 | |
| B–B | 4.16 | 3.02 | 2.98 | 3.08 |
| (ML) | Configuration | (Å) | (Å) | (Å) | (Å) | (Å) | (∘) |
|---|---|---|---|---|---|---|---|
| 1/4 | A | 2.21 | 2.21 | 2.42 | 0.44 | 158 | |
| B | 2.31 | 2.23 | 2.40 | 3.11 | 0.92 | 132 | |
| 1/2 | A–A | 2.09 | 2.24 | 2.42 | 0.21 | 168 | |
| B–B | 2.26 | 2.25 | 2.41 | 3.09 | 0.88 | 134 |
| (ML) | Configuration | (Å) | (Å) | (Å) | (Å) |
|---|---|---|---|---|---|
| 1/4 | A | 4.33 (4.16) | 3.04 (2.89) | 2.95 (2.85) | |
| B | 4.22 | 2.96 (2.89) | 2.97 (2.91) | 3.04 (2.95) | |
| 1/2 | A–A | 4.16 | 3.09 | 3.04 | |
| B–B | 4.16 | 2.95 | 2.97 | 3.03 |
| Surface | Configuration | Mode | (meV) | (∘) | (∘) |
|---|---|---|---|---|---|
| 30 (35) | 0 | - | |||
| Ag(100) | c(22) | 50 (55) | 90 | - | |
| 50 (55) | 90 | - | |||
| 28 | 90 | 90 | |||
| Ag(110) | added row | 38 | 0 | - | |
| 73 | 90 | 0 | |||
| 24 | 23 | 270 | |||
| A–A | 37 | 70 | 90 | ||
| 68 | 90 | 0 | |||
| Ag(410) | 29 | 9 | 90 | ||
| T1–T1 | 32 | 81 | 270 | ||
| 58 | 90 | 0 | |||
| 24 | 23 | 270 | |||
| A–A | 37 | 69 | 90 | ||
| 71 | 90 | 0 | |||
| 25 | 30 | 270 | |||
| Ag(210) | A | 40 | 64 | 90 | |
| 46 | 90 | 0 | |||
| 27 | 39 | 90 | |||
| B–B | 34 | 49 | 270 | ||
| 37 | 90 | 0 |
| Ag(410) | Ag(210) |
|---|---|
 |
 |
| A | T1 | T2 | B |
 |
 |
 |
 |
| A–A | T1–T1 | T2–T2 | B–B |
 |
 |
 |
 |
| A–T2 | T1–B | A–T1 | T1–T2 | T2–B | A–B |
|---|---|---|---|---|---|
 |
 |
 |
 |
 |
 |
 |
 |
 |
 |