Relation between the High Density Phase and the Very-High Density Phase of Amorphous Solid Water
Abstract
It has been suggested that high-density amorphous (HDA) ice is a structurally arrested form of high-density liquid (HDL) water, while low-density amorphous (LDA) ice is a structurally arrested form of low-density liquid (LDL) water. Recent experiments and simulations have been interpreted to support the possibility of a second “distinct” high-density structural state, named very high-density amorphous (VHDA) ice, questioning the LDL-HDL hypothesis. We test this interpretation using extensive computer simulations, and find that VHDA is a more stable form of HDA and that in fact VHDA should be considered as the amorphous ice of the quenched HDL.
The most common form of water in the universe is not a liquid but is a disordered solid named glassy water astro . Depending on the glass formation route—vapor deposition, hyperquenching of the liquid, pressure induced crystal amorphization—water forms amorphous solids of quite different structure, with the density varying by as much as 40 percent between the lowest density form and the highest angellrev ; pablo . The structural and thermodynamical properties of the different amorphous forms of glassy water have been the focus of many recent experimental loerting2 ; finneyHDAVHDA ; soperHDA100 ; science ; loerting ; finneyLDAHDA ; mishimanature02 ; new , numerical and theoretical studies french ; brazhkin ; ourPRL . However, a clear picture of the phase diagram of glassy water is still missing. This is in part because the properties of glasses change drastically with agingscience ; mishimanature02 and because experiments at high pressure are difficult to perform. Glassy water can be found in at least two different forms, low-density amorphous (LDA) and high-density amorphous (HDA) ice visual ; mishimaNature85 . If a glass is formed by extremely rapid cooling of a liquid, then one can naturally associate the glass with the liquid state. LDA can be obtained experimentally by very fast quenching of low-density liquid (LDL) water at normal pressureHGW . However, the generation of an HDA glass via high pressure cooling of the liquid have proved an elusive goal; in fact, HDA is experimentally formed not by quenching but rather by compression either of LDA or of crystalline ice mishimaNature85 . Therefore, the actual relationship of glassy water to the liquid at high pressure remains unknown. On the other side, computer simulations poole ; poolepre indicate that HDA is a structurally arrested form of high-density liquid (HDL) water, and therefore, HDA can be obtained by quenching of HDL at high pressure. A second “distinct” high-density structural state, named very high-density amorphous solid (VHDA) has been recently discovered. The density of VHDA is 7-8% higher than the density of HDA. VHDA is generated by heating HDA under pressure. The resulting glass does not convert back to HDA when recovered at ambient pressure at K. The possibility of a VHDA phase in addition to an HDA phase raises many interesting questions klug , such as the relation between VHDA and HDA; this relation is important to elucidate the hypothesis that below a critical temperature there are two distinct phases of liquid water, LDL and HDL poole . Which phase, HDA or VHDA, more resembles liquid water at high pressure is particularly interesting, and it appears that the structural properties of VHDA are closer to liquid water at high pressure than those of HDA finneyHDAVHDA ; french . On the other side, the presence of two different high-density amorphous ices could imply the existence of more than one form of HDL as recently suggested by computer simulations geiger .
Computer simulations offer a potentially useful tool to probe the relation between HDA, VHDA and liquid water, since the time scale of most simulations is sufficiently short that liquid and glassy states can be studied for a wider range of state points than is accessible experimentally. Here we report a set of extensive simulations that suggest that VHDA not HDA, may be considered as a physical manifestation of the quenched high pressure liquid. Further, our simulations suggest that VHDA is not a new thermodynamically distinct structure but rather VHDA results from partial annealing of the HDA structures made possible by the higher annealing temperature. Hence HDA is not stable but rather is highly metastable, relaxing to VHDA in a fashion analogous to the way that, on slow heating, glasses generated with hyperquenched methods relax to glasses generated with standard cooling rates.
Simulations offer the unique possibility of comparing (i) the glass resulting from conversion of HDA to VHDA with (ii) the glass generated by isobaric cooling of the liquid. However, a note of caution is in order, since in comparing experiments and simulations for glasses, one must carefully account for the significantly different time scales probed. State-of-the-art simulations probe time scales of 10–100 ns, so when the characteristic relaxation time becomes comparable to this time, the system glassifies. Since the experimental homogeneous nucleation time is longer than 100 ns, glass configurations can be generated in simulations by cooling the liquid both at low and at high pressure. We shall exploit this fact in the present study.
We simulate a system of 216 molecules, using the simple point charge extended (SPC/E) model of water berensen . This model has been studied extensively, and the and dependence of structural and dynamic properties in equilibrium are known. In particular, the SPC/E model reproduces the thermodynamic anomalies of water—e.g., it produces a maximum in pooleSPC/E . At g/cm3 at low , the model describes well the LDA structure. We integrate the equation of motion using a time step of fs and implement the reaction field method to account for long range forces. Results are averaged over 16 independent realizations. LDA ice configurations are generated by cooling to 77 K equilibrium liquid configurations at g/cm3. To generate HDA configurations, we compress LDA at K to GPa at a rate of g/cm3/ps ourPRL . The HDA to VHDA transition is studied heating HDA at constant pressure from K using a heating rate of K/ns. We have used the same heating/cooling and compression/decompression rates in all our calculations.
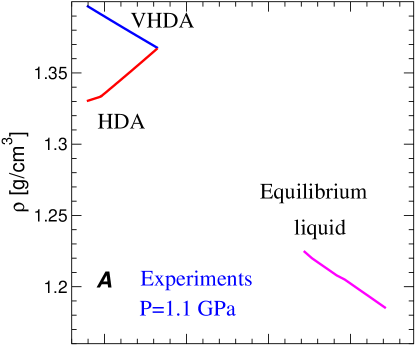
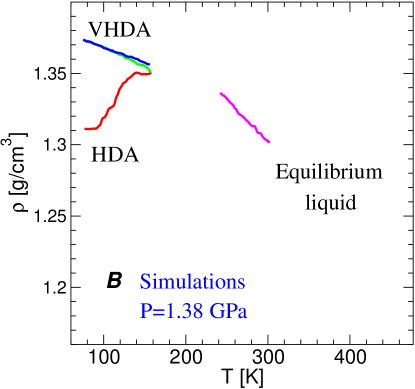
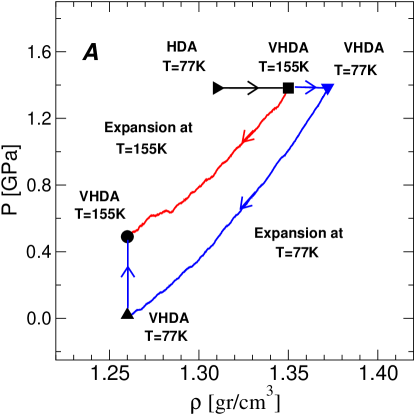
Figure 1 compares, for a high pressure isobar, available experimental data (Fig. 1A) and simulation results (Fig. 1B). In Fig. 1A, the density vs. temperature for equilibrium liquid water is complemented with the vs. data of Ref. loerting2 obtained by heating HDA from 77 K up to 165 K, and then cooling back to 77 K. VHDA is the glass that results from densification of HDA during heating under high pressure. VHDA can be cycled, at constant pressure, between 77 K and 165 K without significant further density changes, leading us to hypothesize that VHDA is the more stable form of HDA. Our hypothesis is consistent with Mishima’s observation that HDA samples annealed to 130-150 K at 1-1.5 GPa are characterized by identical scattering patterns mish2 . Relaxation of HDA to VHDA, and the irreversibility of such transformation upon further temperature-cycling, are facts reminiscent of slow heating of hyperquenched glasses, so the conversion of HDA to VHDA can be interpreted as a temperature-driven partial equilibration of the sample.
In simulations HDA is generated—in analogy with the experimental procedure—by compressing LDA or ice Ih at tse , while LDA is generated by cooling of the liquid at ambient pressure. Figure 1B shows as HDA is heated. At about K, begins to increase, reaching at around K a value g/cm3 larger than the density of HDA at K. Decreasing back to K does not regenerate the HDA density, but instead increases, in agreement with experimental results. The resulting denser material—which we identify with VHDA—can be cycled back and forth without significant changes in .
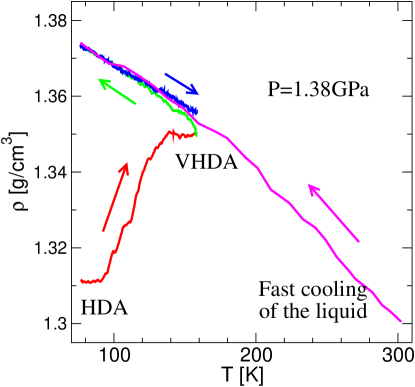
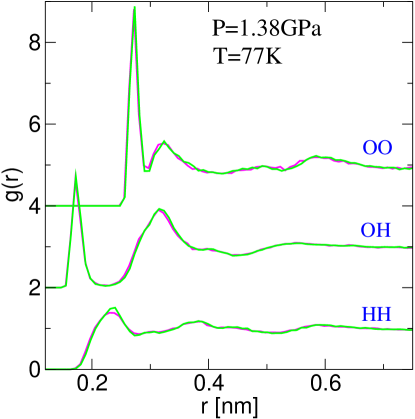
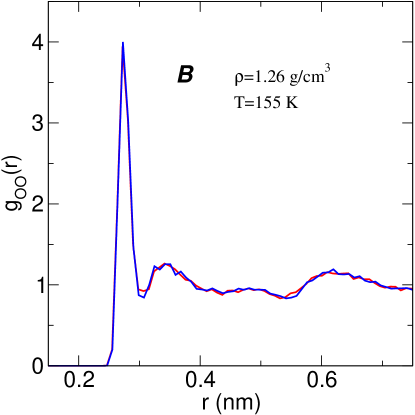
Next we test the hypothesis that VHDA is the glass that would be generated by cooling the high pressure liquid. To this end, Fig. 2 compares for isobaric cooling of the liquid with for VHDA, two systems generated by completely different thermal and pressure histories. The data display remarkable similarity, supporting the possibility that VHDA is indeed the physical realization of the glass generated by quenching the high pressure liquid. To further support this interpretation, Fig. 3 shows that the radial distribution functions of VHDA and of the glass obtained by isobaric cooling of the liquid are indeed indistinguishable.
The results presented in Figs. 2 and 3 indicate that compression of LDA at 77 K generates a system that is kinetically trapped due to the low temperature. This system relaxes to the more stable VHDA, whose structure is identical to the glass generated by quenching the high pressure supercooled liquid. In this respect, not HDA and LDA but rather VHDA and LDA should be thought of as the two distinct glassy states arising from the two distinct liquids associated with the hypothesized line of liquid-liquid phase transitions.
If indeed HDA is a partially-equilibrated glass generated by the compression technique, then one expects that VHDA should not convert to HDA under any transformation which does not involve a different “intermediate” phase (such as LDA, or a crystal phase). To confirm this expectation, we recover VHDA at and ambient pressure with g/cm3. Next we isochorically heat this system to K (Fig. 4). We compare the structure of the resulting system with the structure of the VHDA glass recovered at the same density at K. We find that the two glasses, which are generated from two completely different histories, are identical both thermodynamically (Fig. 4A) and structurally (Fig. 4B), and further we find that no VHDA to HDA transition takes place along the loop. Our conclusion motivates the need for a definitive experimental test that no VHDA HDA transition occurs. When VHDA is heated isochorically from 77 to 140 K, from a starting pressure of 0.02 GPa, the width of the x-ray pattern remains narrow like VHDA loerting (and hence does not appear to revert to HDA); however the position of its first maximum shifts (about 2 degrees) in the direction of HDA (cf. Figs. 1A’, 1B’, and 1D’ of Ref.loerting ).
In summary, our simulations suggest that VHDA is not a new form of glassy water but it is the result of annealing HDA upon heating at high pressure. We also find that VHDA is the glass obtained by fast quenching of high pressure water, i.e. HDL. How HDA and VHDA behave upon decompression to normal pressure and the phase diagram of amophous water are relevant topics that will be addressed in a separate work.
We thank NSF, MIUR Cofin 2002 and Firb and INFM Pra GenFdt for support and the Boston University Computation Center for a generous allocation of CPU time.
References
- (1) P. Jenniskens, S. F. Barnhak, D. F. Blake, and M. R. S. McCoustra, J. Chem. Phys. 107, 1232–1241 (1997).
- (2) C. A. Angell, Ann. Rev. Chem. xx, xxx–xxx (review article in press).
- (3) P. G. Debenedetti, J. Phys.: Condens. Matter 15, R1669–R1726 (2003).
- (4) T. Loerting, C. Salzmann, I. Kohl, E. Mayer, and A. Hallbrucker, Phys. Chem. Chem. Phys. 3, 5355 (2001).
- (5) J. L. Finney, D. T. Bowron, A. K. Soper, T. Loerting, E. Mayer, and A. Hallbrucker, Phys. Rev. Lett. 89, 205503–205506 (2002).
- (6) S. Klotz, G. Hamel, J. S. Loveday, R. J. Nelmes, M. Guthrie, and A. K. Soper, Phys. Rev. Lett. 89, 285502–285505 (2002).
- (7) M. Guthrie, J. Urquidi, C. A. Tulk, C. J. Benmore, D. D. Klug, and J. Neuefeind, Phys. Rev. B 68, 184110–184114 (2003).
- (8) C. A. Tulk, C. J. Benmore, J. Urquidi, D. D. Klug, J. Neuefeind, B. Tomberli, and P. A. Egelstaff, Science 297, 1320–1323 (2002).
- (9) T. Loerting, I. Kohl, C. Salzmann, E. Mayer, and A. Hallbrucker, J. Chem. Phys. 116, 3171–3174 (2002).
- (10) J. L. Finney, A. Hallbrucker, I. Kohl, A. K. Soper, and D. T. Bowron, Phys. Rev. Lett. 88, 225503–225506 (2002).
- (11) O. Mishima and Y. Suzuki, Nature 491, 599–603 (2002).
- (12) B. Guillot and Y. Guissani, J. Chem. Phys. 119, 11740–11752 (2003).
- (13) V. V. Brazhkin and A. G. Lyapin, J. Phys.: Condens. Matter 15, 6059–6084 (2003).
- (14) N. Giovambattista, H. E. Stanley, and F. Sciortino, Phys. Rev. Lett. 91, 115504–115507 (2003).
- (15) O. Mishima, K. Takemura, and K. Aoki, Science 254, 406 (1991).
- (16) O. Mishima, L. D. Calvert, and E. Whalley, Nature 314, 76–78 (1985).
- (17) P. Brügeller and E. Mayer, Nature 288, 569–571 (1980).
- (18) P. H. Poole, F. Sciortino, U. Essmann, and H. E. Stanley, Nature 360, 324-328 (1992).
- (19) P. H. Poole, U. Essmann, F. Sciortino, and H. E. Stanley, Phys. Rev. E 48, 4605–4610 (1993).
- (20) D. D. Klug, Nature 420, 749–750 (2002).
- (21) I. Brovchenko, A. Geiger, and A. Oleinikova, J. Chem. Phys. 118, 9473 (2003).
- (22) H. J. C. Berendsen, J. R. Grigera, and T. P. Stroatsma, J. Phys. Chem. 91, 6269–6271 (1987).
- (23) S. Harrington, P. H. Poole, F. Sciortino, and H. E. Stanley, J. Chem. Phys. 107, 7443–7450 (1997).
- (24) O. Mishima, Nature 384, 546–549 (1996).
- (25) J. S. Tse and M. L. Klein, Phys. Rev. Lett. 58, 1672–1675 (1987).
- (26) L. Haar, J. S. Gallagher, and G. Kell, NBS/NRC Steam Tables (Hemisphere, Washington DC, 1985).