Dielectric Function of Diluted Magnetic Semiconductors in the Infrared Regime
Abstract
We present a study of the dielectric function of metallic (III,Mn)V diluted magnetic semiconductors in the infrared regime. Our theoretical approach is based on the kinetic exchange model for carrier induced (III,Mn)V ferromagnetism. The dielectric function is calculated within the random phase approximation and, within this metallic regime, we treat disorder effects perturbatively and thermal effects within the mean field approximation. We also discuss the implications of this calculations on carrier concentration measurements from the optical f-sum rule and the analysis of plasmon-phonon coupled modes in Raman spectra.
pacs:
75.50.Pp, 75.10LpI Introduction
Ever since post-growth annealing procedures in (III,Mn)V diluted magnetic semiconductors (DMS)Ohno et al. (1996) demonstrated the ability to increase the ferromagnetic transition temperature, , by almost two fold, the study of these promising and interesting materials has been vigourous both experimental and theoretical. The observed increase in is due to the increase of the free hole-carrier concentration originally induced by the Mn substitutional impurities but partially compensated by other impurities such as As-antisites and Mn-interstitials which arise from the needed non-equilibrium growth of these materials. Ohno (1999); Ku et al. (2003); Yu et al. (2002); Edmonds et al. (2004); I.Kuryliszyn-Kudelska et al. (2003) Because of the sensitivity of their magnetic state to growth conditions, doping, and external fields, and the strong valence-band spin-orbit coupling the transport and optical properties of these heavily-doped semiconductors are richer than those of conventional itinerant electron ferromagnets.
We present a theory of the infrared dielectric function of (III,Mn)V ferromagnets based on the kinetic exchange model for carrier induced (III,Mn)V ferromagnetism which assumes a sallow acceptor picture. This justifies the treatment of the electronic structure of the free carriers by the unperturbed host semiconductor band structure. The Mn 3d5 electrons are strongly localized with a fully polarized moment which interacts with the free carriers via Coulomb and short-range exchange interactions, Dietl et al. (2000, 2001); Konig et al. (2003) as has been demonstrated by electron paramagnetic resonance (EPR) and optical measurements. Linnarsson et al. (1997); Ohno (1999) As described in the next section, the dielectric function is calculated within the random phase approximation and, in this metallic regime, we treat disorder effects perturbatively and thermal effects within the mean field approximation.
In particular, we demonstrate that infrared dielectric function measurements in metallic samples can be used to obtain information about the carrier concentration, to simulate the plasmon-phonon overdamped coupled modes, and to explain naturally the observed optical absorption measurements in the infrared regime arising from inter-valence-band transitions. Some of our considerations are based on standard linear-response theory expressions for weakly disordered metals, in which disorder is included through finite quasiparticle lifetimes and localization effects (demonstrated in this model through finite-size exact diagonalization studies Yang et al. (2003)) are taken into account phenomenologically by weighting differently intra-band and inter-band quasiparticle lifetimes. We estimate the magnitude of these lifetimes from extensive theoretical studies in dc-transport studies which describe successfully the metallic DMS high- regime.Jungwirth et al. (2002); López-Sancho and Brey (2003)
Although the predictions discussed below are intended to be more reliable for the most metallic systemsnot , they appear to explain much currently available infrared optical data, many of which has been obtained in studies of systems with relatively low dc conductivities.
II Model Hamiltonian
Focusing on the infrared regime, in our calculations we describe the free carriers electronic structure of the DMS using the six band Kohn-Luttinger Hamiltonian. The dielectric function is calculated in the Random Phase Approximation (RPA) formalism and finite disorder effects are taken into account perturbatively by introducing a finite quasiparticle lifetime. In addition, thermal fluctuations are ignored and finite temperature effects are only considered at the mean field level. Hence, the system is described by the following Hamiltonian,
| (1) |
Where is the part of the Hamiltonian which describes the itinerant holes within the theory, describes the screened Coulomb interactions between the holes and localized Mn ions, and the last term is the antiferromagnetic exchange interaction with strength between the spin of the Mn2+ ions located at the random positions and the spin of the hole carriers.
The sources of disorder known to be relevant in these materials include the positional randomness, of the substitutional Mn ions with charge , random placement of interstitial Mn ions, acting as non-ferromagnetic double donors,Blinowski and Kacman (2003) and non-magnetic As anti-sites acting also as having charge . These Coulomb interactions are included in . Previous estimates of the valence band quasiparticles lifetimes using Fermi’s golden rule induced by this term are of the order of 100-250 meV. Jungwirth et al. (2002) We treat within the Born approximation in the Kubo linear response formalism as in Ref. Sinova et al., 2002; Jungwirth et al., 2002; López-Sancho and Brey, 2003. Hence, in what follows, we drop and introduce its effects through a finite quasiparticle lifetime.
In order to obtain the temperature dependence of the electronic and magnetic properties of the system, we minimize the free energy per unit volume,
| (2) |
where is the contribution of the ion spins to the free energy and in the mean field description has the form,
| (3) |
where , and are the free carrier density and Mn density respectively, and is the spin polarization of the carriers. is the free energy of the holes, which is obtained in the virtual crystal approximation (VCA) using a Luttinger model for describing the carriers. In the VCA the average density of states for the real system is replaced by that of the average Hamiltonian. This approach implies a translational invariant system with an effective exchange field acting on the carrier spins , where is the polarization of the Mn spins. In the Luttinger model the wave function of the holes in the state , where is the subband index and is the wave vector, is expressed as
| (4) |
where are the six valence band wave functions. The coefficients and the corresponding eigenvalues, , depend on the spin polarization of the Mn, and are obtained, from the Luttinger Hamiltonian. Dietl et al. (2001); Abolfath et al. (2001)
By minimizing Eq.(2) we obtain the -dependence of the spin polarization of the carriers, and of the Mn, . In the VCA the Curie temperature has the expression where is the zero wavevector paramagnetic susceptibility of the hole gas. Through the dependence of the Hamiltonian on the spin polarization, we obtain the temperature dependence of the eigenvectors, eigenvalues and chemical potential. Throughout this paper we consider always the typical optimal Mn concentration of and an exchange coupling .Dietl et al. (2000); Okabayashi et al. (1998) Although the properties of the system depend on the orientation of the magnetization, this dependence is much smaller than the T-dependence and since we are interested in the variation of the electronic properties with we fix the Mn spin polarization in the -direction. Experimentally this can be easily achieved by a small coercive field of the order of 100 Oz.
From the eigenvalues and eigenvectors, we calculate the dielectric function that in the RPA has the form,
| (5) |
being the susceptibility,
| (6) |
with
| (7) |
where denotes the Fermi-Dirac distribution and the dielectric function of the host semiconductor (=10.90 for GaAs). In the limit , the overlap function becomes , and Eq. (5) can be rewritten as:
| (8) |
The second term in the right hand side of Eq. (8) is the intra-band contribution and constitutes the Drude weight present in dc measurements and it is closely related to the plasmon frequency in the metallic regime,
| (9) |
The third term is the inter-band contribution and has the form,
| (10) |
We also consider the coupling of the holes with longitudinal optical (LO) phonons. Within the RPA approximation this can be done by including a phonon term in the susceptibility such that the final dielectric function is:
| (11) |
where , . In the case of the coupled plasmon-phonon systems, the damping of the optical phonons is small compared to that of plasmons,G.Abstreiter et al. (1984) and it is estimated to be for GaAs. We account for disorder by including the lifetime broadening of quasiparticle spectral functions in a phenomenological way. We use different lifetimes for the inter and intra-band contributions to the dielectric function. In general we expect the intraband lifetime to be much smaller than the interband lifetime as the intraband scattering occurs at zero energy whereas the interband scattering occurs at finite energy. This has been demonstrated by finite size exact diagonalization studies where a much larger intra-band disorder reduction was observed than the interband contribution at finite frequencies.Yang et al. (2003) In the previous formalism we have considered only the diagonal component of the dielectric function parallel to the carrier spin polarization.
III Results
III.1 Dielectric function
We have computed the dielectric function for different electron densities, lifetimes and temperatures. We illustrate the low-temperature behavior of the dielectric function and the ac conductivity, , in Fig. 1 where and are plotted for different degree of disorder .
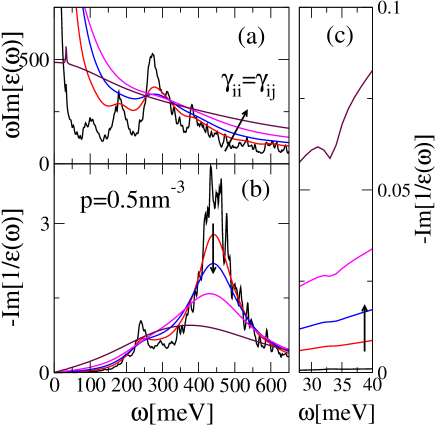
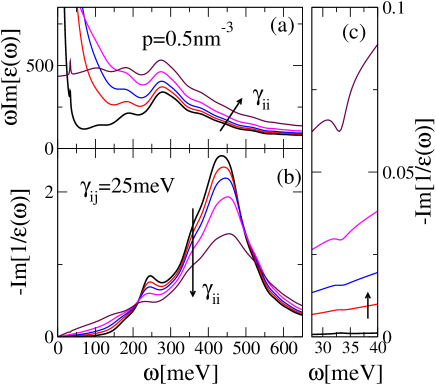
The conductivity, which is finite in the dc limit, has different high-frequency contributions which can be explained in terms of interband transitions: in the clean limit, at this carrier density, there are four strong resonances at 100, 175, 275 and 390meV, due to transitions between the spin polarized six hole bands. Upon increasing , the Drude peak contribution (intraband) broadens and overlaps with the high-frequency interband contribution. Our results agree with those obtained previously by Sinova et al in Ref. Sinova et al., 2002 and are consistent with the experiments of Singley et al in Ref. Singley et al., 2002 and Singley et al., 2003. Nonetheless, the dc conductivity in the experiments is always much smaller than the ac conductivity around . This is an indication that intraband disorder is larger than interband disorder in the experiments. This is also in agreement with finite size exact diagonalization studies where a much larger intra-band spectral weight reduction was observed due to disorder induced localization.Yang et al. (2003) We illustrate this in Fig. 2a where we plot vs for fixed interband disorder =25 meV and different intraband disorder . For the dc limit is smaller than the ac conductivity for frequencies up to (for =250 meV) which corroborates our previous argument.
.
In Fig. 3 we plot and for different holes densities in the case of zero temperature, =100 meV, and =25 meV. As obtained by Sinova et al in Ref. Sinova et al., 2002, we find that , as the hole density increases a peak at energy near 280 meV emerges and the Drude peak appears more clearly.
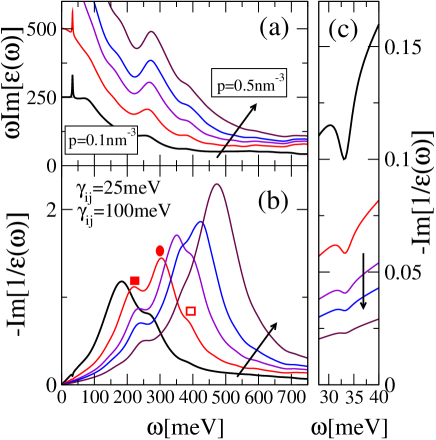
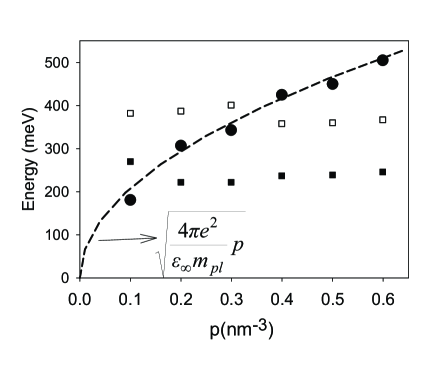
The main features of (Fig. 3b) are a strong single plasmon-like peak (marked in the figure with a circle for p=0.2 nm-3) with much weaker shoulders (marked with squares) that correspond to interband transitions. The plasmon-like character of the strong peak is evident when we plot the position of the peaks in as function of the hole density (Fig. 4). The energy of the strong peaks (circles) can be fitted perfectly to the expression , with =0.25 . The energies of the other peaks at 230 meV and 375 meV (squares) depend very little on the hole density, and we assign them to the light-hole band to heavy-hole band transition and to the light-hole band to the split-off spin-orbit band transition respectively. Of course these transitions are coupled with the plasmon-like excitation. Note that the peak positions are also rather independent of the carrier spin polarization, as the concentration of Mn impurities is fixed at x=5 for all the hole densities, and the carrier polarization changes from 0.81 for =0.1nm-3 to 0.57 for =0.6nm-3
III.2 Sum rules
We can also define an optical effective mass from the sum rules of the model as
| (12) | |||||
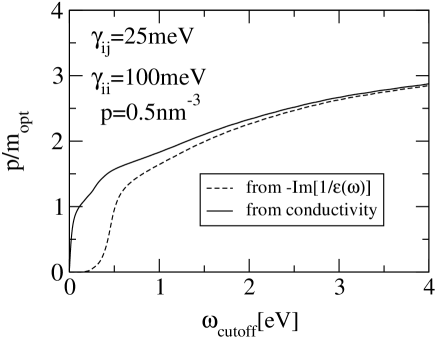
Both sum rules, when integrated up to infinity give the same optical mass. However, because the calculation can only be done in a finite frequency range, in practice the two sum rules give different optical masses that depend on the frequency cut-off in the integration, . In Fig. 5, we plot the quantity as obtained from the two different sum rules as a function of for =0.5nm-3. Note that it is necessary to sum up to rather large values of the frequency in order to get the same effective mass from the two different sum rules. Also, we see that in the six-band Hamiltonian it is necessary to integrate up to very high energies for obtaining an accurate value of . That imposes a serious limitation for the experimental accurate estimation of this quantity to a few percent but can still be used in combination with other indirect transport measurements to establish consistency.
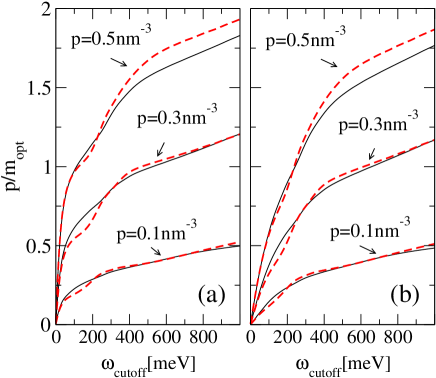
Recently, Singley et al Singley et al. (2003) have studied experimentally the dependence of on the cutoff frequency and temperature by integrating the measured infrared conductivity up to 1.5 eV. In order to compare with these experiments, we study as obtained from the conductivity for different hole densities. The value of the optical mass so obtained depends on the density of holes and, for a finite frequency cutoff, on the lifetimes used in the calculations. This is illustrated in Fig.6 where we plot the conductivity sum rule as function of this frequency cut-off for different temperatures, densities and quasiparticle lifetimes. ¿From the figure we see that in the most metallic samples, lowest , the sum rule will be most accurate in determining the carrier concentration. However, it is clear that for moderate hole densities the value of obtained from the sum rule is far from the converged value. In any case the values of the optical mass obtained from the sum rule are in the range 0.17-0.30 depending on the density, frequency cutoff and temperature. In Fig.6 we also compare the value of at zero temperature (ferromagnetic phase) with its value at high temperature (paramagnetic phase). At low temperatures there is an enhancement of the low energy spectral weight. This can be attributed to low energy interband transitions in the spin polarized system which originate from the spin-orbit coupling. These transitions are absent in the paramagnetic phase because there is not a Zeeman-like spin splitting of the bands. In the absence of spin-orbit coupling, these excitations correspond to transitions between bands with well defined spin antiparallel polarization which, therefore, do not contribute to the charge-charge response function, and are absent in the spectrum.
III.3 Plasmon-phonon coupled modes
For the range of carrier densities considered, a plasmon-phonon coupled mode occurs at . This plasmon-phonon coupled mode (Fig. 1c) is very sensitive to disorder: it changes from a peak-like shape to a Fano-like shape upon increasing . Interestingly, only intraband disorder modifies significantly the coupled mode: around changes little when increases. This can be seen by comparing the curves in Fig. 1c (where varies from 2.5meV to 500meV) with the corresponding curves (i.e., with the same ) in Fig. 2c where =25meV is fixed. Due to the energy difference between and the interband transition energies, the phonon modes almost do not couple with the interband transitions. The plasmon-like part of the coupled mode is superimposed to the plasmon peak for small . On the other hand, for meV the plasmon peak is strongly overdamped (this corresponds to a phonon peak at superimposed to an almost featureless , see Fig. 1a) and only the phonon-like coupled mode remains. This is likely the situation corresponding to the Raman experiments in Ref. Seong et al., 2002 and Limmer et al., 2002. Indeed, the authors of Ref. Limmer et al., 2002 model their data by using a simplified Drude model where interband transitions are neglected, and obtain the value of the carrier density indirectly by a line-shape analysis of the coupled plasmon LO phonon in their Raman spectra. By using an averaged hole mass, they conclude that the same line-shape is obtained if one keeps the ratio fixed, which allows them to estimate the carrier density for different values of the plasmon damping. Note, however, that in a simplified Drude model which, together with our results, suggests that it should not be possible to know , and independently. Thus, we believe that further experimental work is needed in order to clarify this important point.
IV Summary
In closing, we have presented a theory of the infrared dielectric function of (III,Mn)V ferromagnets based on the kinetic exchange model for carrier induced (III,Mn)V ferromagnetism. Our results demonstrate that the infrared dielectric function in metallic samples can be used to obtain information about the carrier concentration, to simulate the plasmon-phonon overdamped coupled modes, and to explain naturally the observed optical absorption measurements in the infrared regime arising from inter-valence-band transitions. The predicted ratios could be tested in the metallic regime within the newly grown samples which exhibit large conductivities. The utilization of the f-sum rule to estimate the carrier concentration has been shown to be most accurate within the highly metallic samples and should be tested experimentally by careful comparison of these measurements with other means of measuring the carrier concentration. We also have shown that the analysis of the Raman plasmon-phonon coupled modes within a simple one band Drude model as in Ref. Limmer et al., 2002 are not very accurate since estimates of and cannot be done independently.
Acknowledgements.
Financial support is acknowledged from Grants No MAT2002-04429-C03-01, MAT2002-04095-C02-01 and MAT2002-02465 (MCyT, Spain) and Fundación Ramón Areces. Ramón Aguado also acknowledges the support of the MCyT of Spain through the ”Ramón y Cajal” program. The authors acknowledge insightful conversations with N. Samarth, D. N. Basov, and K. S. Burch.References
- Ohno et al. (1996) H. Ohno, A. Shen, F. Matsukura, A. Oiwa, A. Endo, S. Katsumoto, and Y. Iye, Appl. Phys. Lett. 69, 363 (1996).
- Ohno (1999) H. Ohno, J. Magn. Magn. Mater. 200, 110 (1999).
- Ku et al. (2003) K. C. Ku, S. J. Potashnik, R. F. Wang, M. J. Seong, E. Johnston-Halperin, R. C. Meyers, S. H. Chun, A. Mascarenhas, A. C. Gossard, D. D. Awschalom, et al., Appl. Phys. Lett. 82, 2302 (2003), eprint cond-mat/0210426.
- Yu et al. (2002) K. M. Yu, W. Walukiewicz, T. Wojtowicz, I. Kuryliszyn, X. Liu, Y. Sasaki, , and J. K. Furdyna, Phys. Rev. B 65, 201303 (2002).
- Edmonds et al. (2004) K. Edmonds, P. Boguslawski, K. Wang, R. Campion, N. Farley, B. Gallagher, C. Foxon, M. Sawicki, T. Dietl, M. Nardelli, et al., Phys. Rev. Lett. 92, 037201 (2004), eprint cond-mat/0307140.
- I.Kuryliszyn-Kudelska et al. (2003) I.Kuryliszyn-Kudelska, T.Wojtowicz, X.Liu, J.K.Furdyna, W.Dobrowolski, J.Z.Domagala, E.Lusakowska, M.Goiran, E.Haanappel, and O. Portugall (2003), eprint cond-mat/0304622.
- Dietl et al. (2000) T. Dietl, H. Ohno, F. Matsukura, J. Cibert, and D. Ferrand, Science 287, 1019 (2000).
- Dietl et al. (2001) T. Dietl, H. Ohno, and F. Matsukura, Phys. Rev. B 63, 195205 (2001).
- Konig et al. (2003) J. Konig, J. Schliemann, T. Jungwirth, and A. MacDonald, in Electronic Structure and Magnetism of Complex Materials, edited by D. Singh and D. Papaconstantopoulos (Springer Verlag Berlin, 2003).
- Linnarsson et al. (1997) M. Linnarsson, E. Janz n, B. Monemar, M. Kleverman, and A. Thilderkvist, Phys. Rev. B 55, 6938 (1997).
- Yang et al. (2003) S.-R. E. Yang, J. Sinova, T. Jungwirth, Y. Shim, and A. MacDonald, Phys. Rev. B 67, 045205 (2003), eprint cond-mat/0210149.
- Jungwirth et al. (2002) T. Jungwirth, M. Abolfath, J. Sinova, J. Kucera, and A. MacDonald, Appl. Phys. Lett. 81, 4029 (2002), eprint cond-mat/0206416.
- López-Sancho and Brey (2003) M. P. López-Sancho and L. Brey, Phys. Rev. B 68, 113201 (2003), eprint cond-mat/0302237.
- (14) The study of optical conductivity in ferromagnetic semiconductors in the impurity band regime, has been addresed by Hwang et al. in reference Hwang et al. (2002).
- Blinowski and Kacman (2003) J. Blinowski and P. Kacman, Phys. Rev. B 67, 121204 (2003), eprint cond-mat/0212093.
- Sinova et al. (2002) J. Sinova, T. Jungwirth, S.-R. E. Yang, J. Kucera, and A. MacDonald, Phys. Rev. B 66, 041202 (2002), eprint cond-mat/0204209.
- Abolfath et al. (2001) M. Abolfath, T. Jungwirth, J. Brum, and A. MacDonald, Phys. Rev. B 63, 054418 (2001).
- Okabayashi et al. (1998) J. Okabayashi, A. Kimura, O. Rader, T. Mizokawa, A. Fujimori, T. Hayashi, and M. Tanaka, Phys. Rev. B 58, R4211 (1998).
- G.Abstreiter et al. (1984) G.Abstreiter, M.Cardona, and A.Pinczuk, in Light Scattering in Solids IV, edited by M.Cardona and G.Guntherodt (Springer-Verlag, Berlin, 1984).
- Singley et al. (2002) E. J. Singley, R. Kawakami, D. D. Awschalom, and D. N. Basov, Phys. Rev. Lett. 89, 097203 (2002).
- Singley et al. (2003) E. J. Singley, K. S. Burch, R. Kawakami, J. Stephens, D. D. Awschalom, and D. N. Basov, Phys. Rev. B 68, 165204 (2003).
- Seong et al. (2002) M. J. Seong, S. H. Chun, H. M. Cheong, N. Samarth, and A. Mascarenhas, Phys. Rev. B 66, 033202 (2002).
- Limmer et al. (2002) W. Limmer, M. Glunk, S. Mascheck, A. Koeder, W. Scoch, K. Thonke, R. Sauer, and A. Waag, Phys. Rev. B 66, 205209 (2002).
- Hwang et al. (2002) E. H. Hwang, A. J. Millis, and S. D. Sarma, Phys. Rev. B 65, 233206 (2002).