Filling of the Mott-Hubbard gap
in the high temperature photoemission
spectrum of (V0.972Cr0.028)2O3
Abstract
Photoemission spectra of the paramagnetic insulating (PI) phase of (V0.972Cr0.028)2O3, taken in ultra high vacuum up to the unusually high temperature (T) of , reveal a property unique to the Mott-Hubbard (MH) insulator and not observed previously. With increasing the MH gap is filled by spectral weight transfer, in qualitative agreement with high- theoretical calculations combining dynamical mean field theory and band theory in the local density approximation.
pacs:
71.27.+a, 71.30.+h, 79.60.-iThe gap of a Mott-Hubbard (MH) insulator arises from mutual electron-electron repulsions that suppress charge fluctuations Mott , whereas the single-particle gap of a band insulator is due to coherent single electron scattering of electrons by the periodic lattice potential. Thereby MH insulators can occur for materials where band theory would demand a metal. The effect of increasing temperature () is expected to be dramatically different for insulators with the two kinds of gaps. Apart from thermal lifetime broadenings, the gap of the band insulator is not -dependent, and non-zero merely leads to excitations of electrons across the gap into the upper band, leaving holes in the lower band. By contrast, for the MH insulator the spectrum itself changes significantly with increasing . Specifically, the gap is filled by transferred incoherent spectral weight. This counter-intuitive and not widely appreciated property of the high- MH state has been reported in single-particle theoretical spectra Bulla computed within the framework of dynamical mean-field theory (DMFT) DMFT ; DMFTreview applied, e.g., to the insulating state of a one-band Hubbard model, in which an on-site Coulomb repulsion ‘’ overcomes the bandwidth arising from site to site hopping ‘’ to stabilize the MH insulator.
The primary focus of this Letter is to ascertain by high- photoemission spectroscopy (PES) on (V0.972Cr0.028)2O3 whether the theoretical prediction of a MH gap-filling holds, and to test the gap-filling spectral shape found in a specific local density approximation(LDA)+DMFT calculation of the high temperature spectrum of PI (V1-xCrx)2O3 Held . A secondary but nonetheless important aspect of the paper is to document the difference between PI phase spectra for the bulk and the surface regions of the sample. We emphasize that the high- states appearing in the gap cannot be described as the coherent Fermi liquid (FL) quasi-particles (QPs) that occur at the Fermi energy on the metallic side at low . In the high- incoherent regime, a clear distinction between metal and insulator does not exist and so our study is directed at physics very different from that of previous studies of spectral changes across low- first-order metal-insulator transitions.
To provide an overview for discussing both theory and experiment, Fig. 1 shows the experimental (V1-xCrx)2O3 and the DMFT phase diagrams. For a sketch of the latter, we employed footnote2 the DMFT Landau theory DMFTLandau describing the behavior around the DMFT critical point, including theoretical arguments realcrit that require the experimental critical point to lie above the DMFT critical point (red dot), as shown.
Let us follow the changes of the low energy spectral weight, which is the order parameter of the Landau theory (panel (a)), along the two paths depicted in panel (b) of Fig. 1. Each path crosses the AFI phase boundary, producing the low- jumps seen in the resistivity (panel (c)) kuwamoto . Since the DMFT calculation does not include the AFI phase, the PM and PI phases in the theory extend to . Starting on the metallic side at (point 0’), we have a FL phase with a QP peak at . Increasing somewhat (point 1’) electron-electron interactions give rise to a non-zero FL QP lifetime and the QP peak is smeared out slightly. Along 1’ to 2’ we enter the crossover regime (red) within which decreases because the metallic QP peak is dramatically smeared out and replaced by incoherent weight with a shallow minimum at Bulla . The lifetime becomes too short to speak of a QP anymore and the high- resistivity shows a marked deviation from its simple low- metallic behavior.
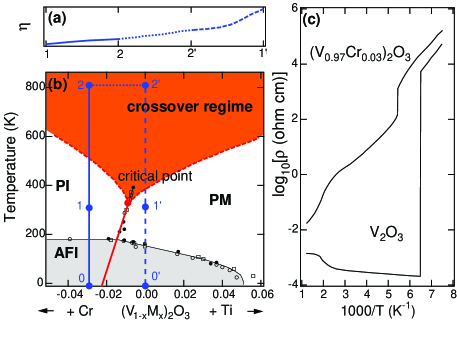
On the insulating side we have a MH gap at (point 0). Following the path of the experiment reported here, at low ’s (point 1) we have a very small amount of incoherent spectral weight within the MH gap. Along 1 to 2 we enter the crossover regime. Much more spectral weight transfers into the gap ( is increasing) and the high- resistivity shows a marked downturn away from its previous simple activated behavior. The spectrum becomes more and more like that of the PM side (point 2’), the distinction between the phases blurs increasingly, and the two resistivity curves in Fig. 1 approach one another limelette . Thus we can think of the spectral weight transferred into the PI phase gap as the incoherent high- weight that replaces the PM phase low- QP peak. We note that a simple gap shrinking could also explain the high- PI phase resistivity behavior. One such model goodenough based on a high- thermal variation of the crystallographic c/a ratio can be ruled out by the weak high- dependence of c/a that we have measured for our material, very close to that McWhan reported for . In fact the PES data that we present next support the DMFT gap filling scenario.
We have previously reported moprl from PES studies of the PM phase, that the surface region is more strongly correlated than the bulk because the reduced coordination ‘’ on the surface reduces the band width ‘’ on the surface relative to that of the bulk and renders the screening of to be less effective. Studying the less correlated bulk requires the use of high photon energies (’s) with good resolution, available only at a synchrotron, whereas experimental constraints dictated that our high- PES be performed in a laboratory system, for which the available ’s render the spectra to be more surface sensitive. Indeed an early effort Shin to use low PES to test the high- DMFT prediction of QP weight decrease in the PM phase could not reach a firm conclusion because the QP weight is too small to produce an actual peak in the low spectrum moprl and because an upper limit of 300K precluded a large effect. Our approach is to study the correlated insulator, since the surface is even more strongly correlated than the bulk, and to measure well into the high- region suggested by Fig. 1.
Multiple cycles of PES measurements from 300K to 800K and back to 300K were performed in a VG ESCALAB MK-II system with photons obtained from the He I (21.2 eV) and He II (40.8 eV) lines of a He discharge lamp. A single-crystalline sample of (V0.972Cr0.028)2O3 was mounted on a sample holder with an embedded tungsten filament for heating. Prior to the measurement the sample holder was degassed at the highest temperature for a week to prevent sample contamination by outgassing during the high temperature measurement. The base pressure of the vacuum system is Torr and during the measurement the pressure was never higher than 2 Torr. Prior to a temperature cycle, but not during the cycle, the sample was scraped to expose a clean surface suitable for PES measurements. Scraping was chosen over cleaving to assure an angle integrated spectrum and to allow multiple temperature cycles to be made. The spectral changes reported here are reversible over a cycle and highly repeatable. The Fermi level and the overall experimental resolution ( meV) were determined from Fermi-edge spectra of a Mo metal reference for each of the measured temperatures and photon energies. For comparison, low temperature spectra were also obtained for cleaved surfaces in the ESCALAB system using the He lamp and at the SPring-8 synchrotron using photons of eV. The experimental details at SPring-8 are exactly as described previously moprl .
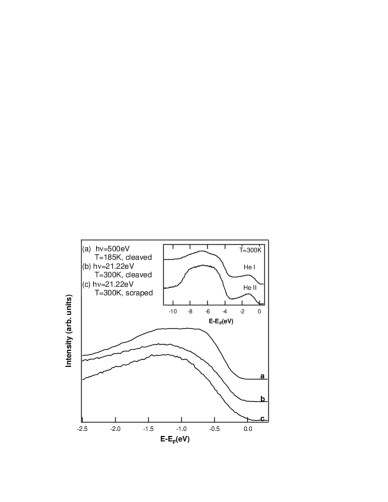
The inset of Fig. 2 shows He I and He II spectra of scraped surfaces at K for the entire valence band region. The V 3 emission down to eV is well separated from the broad O 2 emission further below . As is well understood the part of the He I spectrum that is far from is distorted relative to the He II spectrum by a background that is considerably larger and faster rising than that for He II because of various instrumental effects involving very low energy electrons. The main part of Fig. 2 documents the relation between the low V 3 spectrum for the photon energy of our -dependent study, i.e., He lamp excitation, and eV photon excitation. Small differences in the high binding energy tails are unimportant for the subject at hand. The more bulk sensitive eV spectrum 500 eV spectrum details on a cleaved surface shows slope changes at eV and eV. The same slope changes are seen in the more surface sensitive cleaved He I spectrum, but the feature at eV has relatively less intensity. This reduced intensity is very reminiscent of our previous finding moprl that the quasi-particle peak of the PM phase is reduced for the more strongly correlated surface region. Changes in the spectrum due to scraping, e.g. a small amount of spectral weight observable at due to an increased number of the surface states that pin the chemical potential in the gap mu shift , are insignificant compared to the remarkable temperature induced spectral changes that we report below. We conclude that the conditions of our -dependent study give spectra valid for showing the -dependence of the PI phase, although the more strongly correlated PI surface might require somewhat higher temperatures to be equivalent to the bulk.
The He II spectra in the upper panel of Fig. 3 provide the best overview of the -dependent changes. The spectra for the two temperatures have been normalized to match in the inelastic region below eV, which renders the areas under the two spectra identical within , as should be the case. -dependent changes occur in both the V 3 and the O 2 regions and it is found that the areas under each region are conserved separately. Using this information the two He I spectra have been normalized to preserve their areas in the V 3 region, which shows the same -dependence as in the He II spectra. The part of the He I spectrum farther from shows what appears to be (but is actually not) an extra -dependence that interferes with observing the intrinsic -dependence in the O 2 region. This spurious effect is typical of the instrumental sensitivity of this part of the He I background, in this case probably due to the effect of the magnetic field produced by the sample heater current in changing the paths of the very low energy electrons that enter the electron analyzer for this part of the He I spectrum.
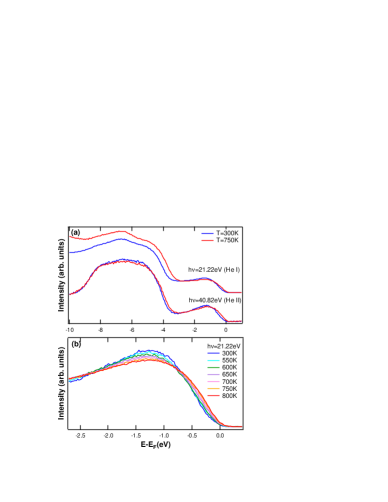
Our main interest in this study is the gap region near . Since the He I spectrum shows this region well and has much higher intensity than the He II spectrum, detailed He I spectra were taken in the gap region at 50 K intervals. These spectra, presented in the lower panel of Fig. 3, show a substantial change, smoothly progressing, over the temperature range studied. Beginning at K, roughly consistent with entering the crossover regime along path in Fig. 1, spectral weight is transferred steadily into the gap from a region as much as eV below the gap, causing the curvature of the spectral onset to change from positive to negative over the first 0.7 eV. This spectacular change is entirely different from what would be expected for thermal generation of holes below a band insulator gap and cannot be understood as an ordinary thermal broadening or a simple phonon effect, as we discuss next.
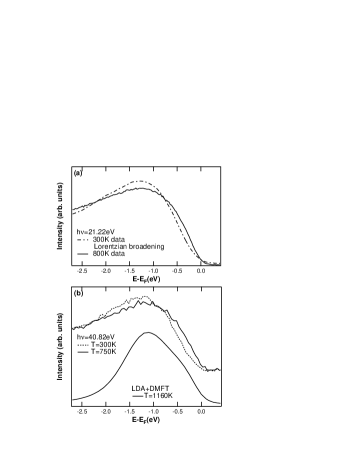
We now summarize the case that the observed thermal change is best understood as the gap filling expected in theories of the MH insulator. We note immediately that the transfer energy range of eV vastly exceeds phonon energies and is 20k for K. The upper panel of Fig. 4 compares the 800K spectrum to an overestimate of simple thermal broadening of the 300K spectrum, obtained by broadening with an 1160K Lorentzian. Such thermal broadening does not account for the spectral weight transfer and the reversed curvature of the 800K spectrum. The spectral evolution is also quite different from that of a simple gap closing, for which changes primarily near the chemical potential would be expected. The lower panel of Fig. 4 again shows the experimental change, using this time the He II spectra at low and high , along with a theoretical LDA+DMFT V 3 spectrum for the PI phase of (V0.972Cr0.038)2O3 at 1160K, taken from the calculation of Ref. Held for a value of eV. The Cr doping is one for which the detailed crystallographic information needed for the calculation is available and the difference from that of our experiment is not important for the qualitative comparison made here. The theory reproduces the general gap filling shape, including the unusual negative curvature seen in the data over the first 0.7 eV. We conclude that the cross-over regime of the DMFT provides a unified picture of both the high- resistivity behavior and our high- PI phase PES spectra.
In summary, unusually high- PES measurements show for the PI phase of (V1-xCrx)2O3 a previously unobserved transfer of spectral weight into the gap region, well correlated with the high- resistivity behavior. We interpret our data as the first observation of the incoherent low energy weight that defines the cross-over regime of the DMFT MH phase diagram.
Acknowledgements.
This work was supported by the U.S. NSF at the University of Michigan (UM) (Grant No. DMR-03-02825), by a Grant-in-Aid for COE Research (10CE2004) of MEXT, Japan, by JASRI (No. 2000B0335-NS-np), by KOSEF through eSSC at POSTECH and by the Emmy-Noether program of the Deutsche Forschungsgemeinschaft. We are grateful to G. Keller and D. Vollhardt for valuable discussions.† Current address: Lawrence Berkeley National Laboratory, Advanced Light Source, MS 7-100, 1 Cyclotron Road, Berkeley, CA, 94720.
References
- (1) N. F. Mott, Rev. Mod. Phys. 40, 677 (1968); Metal-Insulator Transitions (Taylor & Francis, London, 1990); F. Gebhard, The Mott Metal-Insulator Transition (Springer, Berlin, 1997).
- (2) See, e.g., R. Bulla, T. A. Costi, and D. Vollhardt, Phys. Rev. B 64, 045103 (2001); J. Schlipf et al., Phys. Rev. Lett. 82, 4890 (1999).
- (3) W. Metzner and D. Vollhardt, Phys. Rev. Lett. 62, 324 (1989); A. Georges and G. Kotliar, Phys. Rev. B 45, 6479 (1992); M. Jarrell, Phys. Rev. Lett. 69, 168 (1992).
- (4) A. Georges et al., Rev. Mod. Phys. 68, 13 (1996).
- (5) K. Held et al., Phys. Rev. Lett. 86, 5345 (2001); G. Keller et al., cond-mat/0402133.
- (6) Both PM and PI solutions, one metastable, coexist below the DMFT critical point (set at K, in Fig. 1). The Landau theory describes the behavior around in terms of an order parameter which is given by DMFTLandau . To reproduce the slope of the experimental first-order line and the general DMFT behavior DMFTreview , we used , , , and . The boundary of the crossover regime is not sharply defined. For the line shown in Fig. 1, we used the criterion that is becoming small, i.e., of its maximal value at the same .
- (7) G. Kotliar, E. Lange, and M. Rozenberg, Phys. Rev. Lett. 84, 5180 (2000).
- (8) Since the inverse electronic compressibility diverges at the DMFT critical point, DMFTreview , the total free energy , which includes lattice contributions via a normal compressibility , has a negative curvature w.r.t. volume above the DMFT critical point [P. Majumdar and H. R. Krishnamurthy, Phys. Rev. Lett. 73, 1525 (1994)]. This gives rise to a thermodynamic instability as in the liquid gas transition or the Kondo volume collapse scenario for Ce [J. W. Allen and R. M. Martin, Phys. Rev. Lett. 49, 1106 (1982)].
- (9) H. Kuwamoto, J. M. Honig, and J. Appel, Phys. Rev. B 22, 2626 (1980).
- (10) D. B. McWhan and J. P. Remeika, Phys. Rev. B 2, 3734 (1970).
- (11) The critical resistivity behavior around the critical point has been determined recently by P. Limelette et al., Science 302, 89 (2003).
- (12) J. B. Goodenough, Annu. Rev. Mater. Sci. 1, 101 (1971).
- (13) S.-K. Mo et al., Phys. Rev. Lett. 90, 186403 (2003).
- (14) S. Shin et al., J. Phys. Soc. Jpn. 64, 1230 (1995).
- (15) A small contribution to the eV spectrum from Cr 3 emission has been removed by using information obtained from resonant photoemission spectra at the V 2 edge, for which the Cr emission is entirely suppressed, and from PI phase spectra for a much smaller value of .
- (16) A temperature cycle sometimes produces a small ( eV) shift of the chemical potential, indicating some change of the surface states.