Refinement of the equation of state of tantalum
Abstract
The volume of tantalum versus pressure has been accurately measured up to 101 GPa by single-crystal x-ray diffraction, with helium as pressure transmitting medium. Slight deviation from previous static determinations is observed. Discrepancy with reduced shock-wave and ultrasonic data supports recent doubts about the calibration of the ruby pressure scale. Finally, first principle calculations of the literature show a positive curvature in relative to the experimental data, even with a modified pressure scale.
pacs:
07.35.+k, 64.30.+t, 61.10.NzTa is a transition metal (Z=73 and the Xe 4f145d3 6s2 equilibrium atomic configuration), with a simple bcc structure stable to at least 174 GPaCynn and Yoo (1999). Because of its fundamental interest and its use as an important technology material, the equation of state (EoS) of Ta has been studied by several experimental techniquesKatahara et al. (1976),McQueen et al. (1970), Wang et al. (2002),Cynn and Yoo (1999), Hanfland et al. (2002) and numerous ab-initio density functional theory (DFT) electronic structure calculationsSöderlind and Moriarty (1998), Wang et al. (2000), Cohen and Gülseren (2001), Boettger (2001). However, the EoS of Ta is still not known with a satisfactory accuracy. On the experimental side, small differences between static determinations are observed Cynn and Yoo (1999), Hanfland et al. (2002), and more important discrepancies exist among ultrasonic measurementsKatahara et al. (1976), shock-wave results McQueen et al. (1970), Wang et al. (2002), and static determinations Cynn and Yoo (1999), Hanfland et al. (2002). On the theoretical side, systematic deviations are seen between calculations with the two mostly used approximations of the exchange-correlation energy of the electrons, and reliable experimental data are needed to validate one of these approximationsBoettger (2001). Here below, we report accurate EoS data of Ta, based on single-crystal x-ray diffraction (XRD), up to 101 GPa under quasi-hydrostatic conditions. We compare these data with previous measurements and DFT calculations.
Six runs were dedicated to the measurement of accurate volume data of Ta versus pressure by synchrotron single crystal x-ray diffraction, on the ID30 beamline at the ESRF (Grenoble, France). Small single crystal grains (4 m in the maximum dimension), chosen in a tantalum powder (averaged size 10 m, 99.9 % purity, Goodfellow product) on the basis of their external shape, were loaded in membrane diamond anvil cells, with helium as pressure transmitting medium. We checked by interferometry that the thickness of sample chamber was always larger than the dimension of the crystal. The first two experiments have been carried out using single crystal energy dispersive XRD and the other four using angle dispersive monochromatic XRD at 0.3738 Å. The same technique had been used to measure with high accuracy the equation of state of low-Z systems in the 100 GPa rangeOccelli et al. (2003). An average of 7 reflections were measured in each run ; absolute uncertainty in the lattice parameter is at maximum of 10-3. The pressure was estimated from the luminescence of a small ruby ball (less than 4 m in diameter) and its quasi-hydrostatic calibrationMao et al. (1986). Non-hydrostatic stresses were observed to be negligible because the shape of the diffraction spot for a given reflection showed no sign of deterioration of the crystalline quality of the sample. Except in one run, when a leak of helium through a diamond fracture caused a deterioration of the pressurization conditions above 70 GPa, and the volume of a strained sample, bridged between the diamond tips, was subsequently measured.
| V (Å3) | V (Å3) | V (Å3) | V (Å3) | ||||
|---|---|---|---|---|---|---|---|
| 10.9 | 17.142 | 44.2 | 15.204 | 9.2 | 17.243 | 52.5 | 14.814 |
| 32.0 | 15.717 | 54 | 14.761 | 10.6 | 17.140 | 58.7 | 14.554 |
| 41.2 | 15.300 | 35.3 | 15.573 | 12.0 | 17.026 | 65.5 | 14.266 |
| 11.4 | 17.088 | 52.5 | 14.763 | 13.5 | 16.942 | 70 | 14.143 |
| 15 | 16.815 | 71.9 | 14.047 | 15.0 | 16.833 | 90 | 13.449 |
| 20.6 | 16.473 | 82.5 | 13.697 | 16.1 | 16.751 | 31 | 15.843 |
| 25.8 | 16.178 | 84.8 | 13.554 | 17.4 | 16.662 | 36.2 | 15.585 |
| 31.3 | 15.880 | 85.8 | 13.541 | 19.1 | 16.557 | 39.7 | 15.415 |
| 36.0 | 15.554 | 91.3 | 13.379 | 20.8 | 16.449 | 45.6 | 15.135 |
| 41.5 | 15.351 | 95.9 | 13.225 | 22.4 | 16.353 | 50.2 | 14.919 |
| 47 | 15.069 | 100.9 | 13.145 | 24.0 | 16.263 | 55.5 | 14.693 |
| 51.4 | 14.853 | 2.3 | 17.838 | 26.2 | 16.129 | 66.5 | 14.257 |
| 56.8 | 14.566 | 3.6 | 17.704 | 27.9 | 16.036 | 74.1 | 13.998 |
| 60.8 | 14.453 | 5.0 | 17.585 | 30.1 | 15.914 | 79.9 | 13.795 |
| 64.3 | 14.42 | 6.7 | 17.436 | 1.1 | 17.933 | 85.8 | 13.634 |
| 65.7 | 14.307 | 7.8 | 17.354 | 0 | 18.033 |
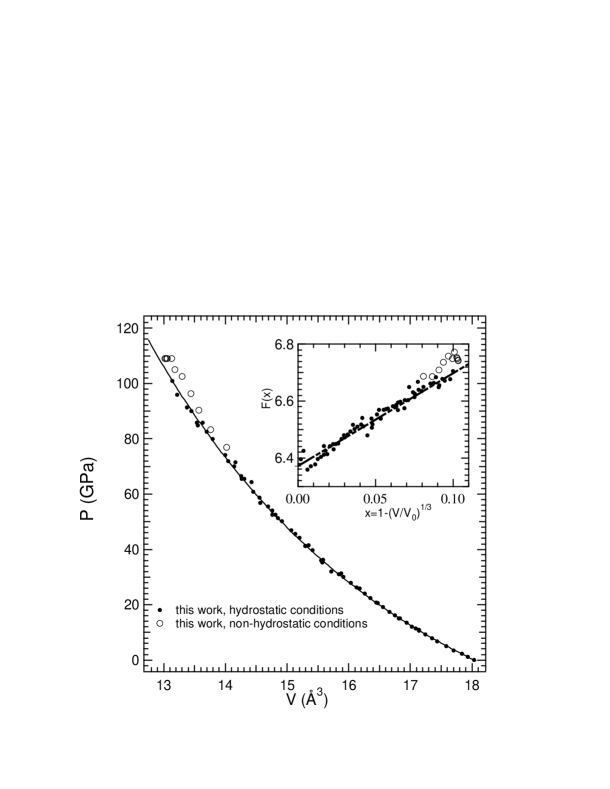
The data points measured under hydrostatic conditions are presented in Table 1. They are plotted in Fig. 1 and compared to the data obtained with uniaxial stress conditions in the broken diamond run. It is seen that a non-hydrostatic pressure leads to overestimate the volume. The ambient pressure atomic volume was measured equal to 18.033(50) Å3, which agrees with ambient and literature data (18.065 Å3, Alefeld and Völk (1978)). The uncertainty in the volume determination is smaller than 3.10-3, which corresponds to a pressure uncertainty of 1.5 GPa at 100 GPa. The estimated pressure error bars include the pressure gradient between the ruby ball and the Ta crystal and range from 0.05 GPa at 1 GPa to 1 GPa at 100 GPa, if the ruby pressure scale is assumed to be correct. Therefore, the error in the volume determination, intrinsical to the XRD technique is mainly responsible of the scattering of the experimental points as seen in Fig. 1.
To provide the useful physical parameters, namely volume , bulk modulus , and its pressure derivative , under ambient conditions, the data points are generally fitted by an EoS formulation. The least square fit of the data with an universal form of the equation of state should ideally give the same value for , and as the ones measured independently at zero pressure by XRD for and by ultrasound propagation for and . We have fitted the data with three most-used forms of the EoS in the literature: third-order Birch-Murnaghan EoS Birch (1938) (BM), Vinet EoS Vinet et al. (1987) (V) and the EoS proposed by Holzapfel Holzapfel (1991) (H). In this pressure range, very similar values of (between 196 and 199 GPa), and (between 3.07 and 3.30), are obtained with these three forms, that give comparable quality of the fits. The Vinet fit has been chosen to reproduce the present data. In the case of the Vinet fit, the data can be seen in a linearized form, as shown in the inset of Fig. 1. It is seen that the data points above 50 GPa are important to unambiguously constrain the value of the slope. The results of the various Vinet fits of the data (fixing , as measured; fixing and as given by ultrasonic measurements; using the recently proposed modification of the calibration of the ruby pressure scale Holzapfel (2003)) are compared in table 2 to ultrasonic measurements (the adiabatic to isothermal correction had been done in ref. Katahara et al. (1976)) and to the reduced Hugoniot data Wang et al. (2000). The value obtained in the current study, 198 3.4 GPa, is in correct agreement with the ultrasonic one, 194 GPa. On the contrary, a smaller is obtained, wether is fixed or not to its ultrasonic value.
| Study | Technique, range, EoS | |||
|---|---|---|---|---|
| current | 18.033 | 198 | 3.07 | XRD, 0-101 GPa, V |
| (3.4) | (14) | |||
| current | 18.033 | 194 | 3.25 | XRD, 0-101 GPa, V |
| (4) | ||||
| Cynn and YooCynn and Yoo (1999) | 18.040 | 195 | 3.4 | XRD, 0-174 GPa, BM |
| Hanfland et al.Hanfland et al. (2002) | 18.191 | 207.6 | 2.85 | XRD, 0-70 GPa, H |
| Katahara et al. Katahara et al. (1976) | 194 | 3.83 | US, 0-0.5 GPa | |
| Wang et al. Wang et al. (2002) | 194 | 3.70 | RSW, 0-150 GPa, V | |
| current, | ||||
| mod scaleHolzapfel (2003) | 18.033 | 194 | 3.55 | XRD, 0-105 GPa, V |
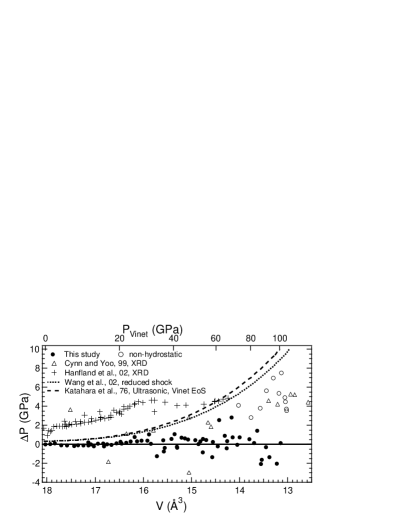
In Fig. 2, other experimental determinations of the EoS of Ta are compared through their differences with the Vinet fit of the present data (with =18.033 Å3, GPa, ). A systematic deviation between the present data and the ones of two recent XRD measurements is clearly seen. The numerous low pressure measurements of Hanfland et al. give an atomic volume at ambient pressure of 18.186 Å3 (0.8 % larger than the present determination). This could be due to a small contamination by hydrogen (a few percents), that is well-known to lead to an expansion of the lattice Alefeld and Völk (1978). For this reason, the points plotted in Fig. 2 appear shifted from our data. Due to its larger compressibility at low pressure (Fig. 2), the values of fitted on Hanfland data cannot be reconciled with the ultrasonic value. However, the compression curve of Hanfland et al. is parallel to the current one at higher pressure. Low pressure data points measured by Cynn and YooCynn and Yoo (1999) exhibit a large scatter. Also, an increasing deviation between the present EoS data and the data of Cynn is observed at GPa. This could be ascribed to an uniaxial stress effect in Cynn experimentsKenichi (2001) because these data are following the trend of our data points in the non-hydrostatic run (in this study, gold has been used as an x-ray pressure standard Heinz and Jeanloz (1984) for the high pressure data points).
More severe inconsistencies exist between the present XRD and the ultrasonic measurements or the reduced shock-wave EoS of tantalum. All XRD studies lead to a smaller than the ultrasonic one. Inserting the ultrasonic values Katahara et al. (1976) of and in the Vinet formulation generates an equation of state that deviates from our determination at high pressure. As seen in Fig. 2, the EoS generated from ultrasonic values of and is in very good agreement with the EoS of Ta obtained by the reduction of shock data to ambient McQueen et al. (1970),Wang et al. (2002). The difference between the XRD EoS and the reduced shock EoS or the ultrasonic based EoS reaches 12 % in pressure at 150 GPa. Possible causes of these apparent inconsistencies need to be examined and error bars estimated. The error on the reduced Hugoniot data of tantalum Wang et al. (2002) is claimed to be of 5.5 % at 400 GPa, and less below 200 GPa. This uncertainty is caused both by uncertainties in particle and shock velocities measurements, and by the reduction procedure from Hugoniot temperature to the 300 K. The sum of the error bars in the volume determination and in the pressure measurements on the XRD EoS data points amounts to an equivalent 2.5 GPa at maximum at 100 GPa. Consequently, the consideration of cumulative error bars on the reduced Hugoniot and on the XRD EoS cannot reconcile the dynamic and static determinations of the EoS of Ta. To reconcile our XRD data with the reduced Hugoniot data and the ultrasonic based EoS of tantalum, it must be assumed that the ruby scale underestimates the pressure by about 10% at 150 GPa. A similar correction of the ruby pressure scale has been recently proposed by Holzapfel Holzapfel (2003). Moreover, a discrepancy between ab-initio calculations and x-ray measurements of the pressure-volume relation of diamond has also been ascribed to an error of the ruby pressure scale of the same magnitude Kunc et al. (2003). As seen in table 2, by using the new ruby pressure scale proposed by Holzapfel, consistency is recovered between the EoS of Ta obtained by static XRD and shock-wave measurements because similar values of , and are then obtained. The ultrasonic value remains slightly (0.28) larger than the one obtained by fitting of compression data, which could be due to either experimental uncertainties or approximations in finite strain EoS formulation.
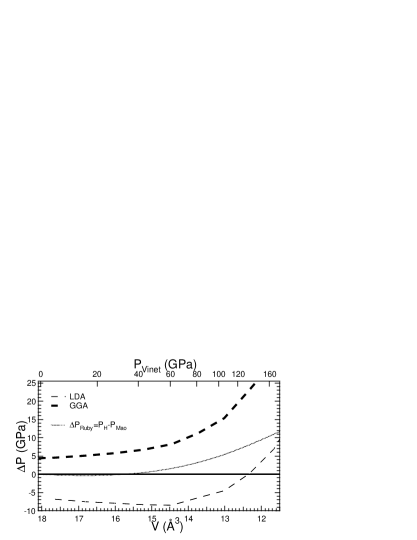
The ab-initio calculations of the EoS of Ta has been produced in four recent studies Söderlind and Moriarty (1998), Wang et al. (2000),Boettger (2001), Cohen and Gülseren (2001) using density-functional theory. In principle, this method involves approximations only in the exchange and correlation energy calculation. Two forms are currently used, namely the Local Density Approximation (LDA) and the Generalized Gradient Approximation (GGA). The validity of these approximations is in practice established by their ability to reproduce experimental results. Uncertainties might also arise consequently to the choice of the computational method and of its inherent assumptions, but they should be small, as it is seen by comparing three recent GGA EoS Wang et al. (2000),Boettger (2001), Cohen and Gülseren (2001). These EoS agree within 3 GPa at 150 GPa, although they are based on different computational methods. Consequently, for legibility in Fig. 3, the LDA and GGA EoS are represented by the calculation of Boettger Boettger (2001) alone, and they are compared to the experimental data through the pressure difference at a given volume. It is observed here, as often, that the ambient pressure volume is underestimated by LDA calculations and overestimated by GGA calculations. What seems to be more interesting here is that all DFT calculations show a similar positive curvature relative to the experimental data. The higher compressibility at high pressure of the experimental EoS compared to the DFT calculations cannot be entirely due to the possible error of the ruby pressure scale. In fact, if the new calibration proposed by HolzapfelHolzapfel (2003), that reconciles all the experimental determinations as discussed above, is used, the larger experimental compressibility still exists, as shown in Fig. 3, for pressures higher than 80 GPa.
In summary, the present work demonstrates that an accurate determination of the volume of metals under hydrostatic conditions in the 100 GPa range can now be achieved by synchrotron single-crystal XRD with helium as pressure transmitting medium. Consistency with the determination of the EoS of Ta by ultrasonic or shock-wave methods can be recovered by using a calibration of the ruby scale recently proposed. This highlights and estimates the present uncertainty of the ruby pressure calibration. Similar EoS measurements under good hydrostatic conditions up to the Mbar range should now be performed on reference metals to address two important issues pointed out in the present work: first, to reduce the uncertainty of the ruby pressure scale, by a comparison of these metal EoS data with the EoS deduced from high-temperature shock-wave, considered as primary standardsMao et al. (1986); second, to investigate if a higher experimental compressibility than the calculated DFT one is a systematic trend in metals and if it has a Z dependence.
Acknowledgements.
We acknowledge the European Synchrotron Radiation Facility for provision of synchrotron radiation facilities and we would like to thank Anne-Claire Dhaussy and Micha l Berhanu for assistance in using beamline ID30. We thank Michael Hanfland for providing the detail of its data points. We are grateful to the two referees for their helpful comments on the manuscript.References
- Cynn and Yoo (1999) H. Cynn and C.-S. Yoo, Phys. Rev. B 59, 8526 (1999).
- Katahara et al. (1976) K. Katahara, M. Manghnani, and E. Fisher, J. Appl. Phys. 47, 434 (1976).
- McQueen et al. (1970) R. McQueen, S. Marsh, J. Taylor, J. Fritz, and W. Carter, High Velocity Impact Phenomenon (Academic, New York, 1970), chap. VII.
- Wang et al. (2002) Y. Wang, R. Ahuja, and B. Johansson, J. Appl. Phys. 92, 6616 (2002).
- Hanfland et al. (2002) M. Hanfland, K. Syassen, and J. Köhler, J. Appl. Phys. 91, 4143 (2002).
- Söderlind and Moriarty (1998) P. Söderlind and J.A. Moriarty, Phys. Rev. B 57, 10 340 (1998).
- Wang et al. (2000) Y. Wang, D. Chen, and X. Zhang, Phys. Rev. Lett. 84, 3220 (2000).
- Cohen and Gülseren (2001) R.E. Cohen and O. Gülseren, Phys. Rev. B 63, 224101 (2001).
- Boettger (2001) J.C. Boettger, Phys. Rev. B 64, 035103 (2001).
- Occelli et al. (2003) F. Occelli, P. Loubeyre, and R. Letoullec, Nat. Mater. 2, 151 (2003).
- Mao et al. (1986) H.-K. Mao, J. Xu, and P. Bell, J. Geophys. Res. 91, 4673 (1986).
- Alefeld and Völk (1978) G. Alefeld and J. Völk, Hydrogen in Metals II (Spriger-Verlag, Berlin, 1978), chap. II, pp. 11–71.
- Birch (1938) F. Birch, J. Appl. Phys. 9, 279 (1938).
- Vinet et al. (1987) P. Vinet, J. Ferrante, J. Rose, and J. Smith, J. Geophys. Res. 92, 9319 (1987).
- Holzapfel (1991) W. Holzapfel, Europhys. Lett. 16, 67 (1991).
- Holzapfel (2003) W. Holzapfel, J. Appl. Phys. 93, 1813 (2003).
- Kenichi (2001) T. Kenichi, J. Appl. Phys. 89, 662 (2001).
- Heinz and Jeanloz (1984) D. Heinz and R. Jeanloz, J. Appl. Phys. 55, 885 (1984).
- Kunc et al. (2003) K. Kunc, I. Loa, and K. Syassen, Phys. Rev. B 68, 094107 (2003).