Luttinger liquid ARPES spectra from samples of Li0.9Mo6O17 grown by the temperature gradient flux technique
Abstract
Angle resolved photoemission spectroscopy line shapes measured for quasi-one-dimensional Li0.9Mo6O17 samples grown by a temperature gradient flux technique are found to show Luttinger liquid behavior, consistent with all previous data by us and other workers obtained from samples grown by the electrolyte reduction technique. This result eliminates the sample growth method as a possible origin of considerable differences in photoemission data reported in previous studies of Li0.9Mo6O17.
pacs:
71.10.Pm, 71.20.-b, 79.60.-iLi0.9Mo6O17, also known as the Li purple bronze, is a quasi-one-dimensional metal which displays metallic T-linear resistivity and temperature independent magnetic susceptibility for temperatures down to K, where a phase transition of unknown origin is signaled by a very weak anomaly in the specific heat Schlenker1985 . As decreases below , the resistivity increases. However the d.c. magnetic susceptibility is unchanged below Schlenker1985 ; matsuda86 , implying no single particle gap opening, and infrared optical studies degiorgi-purple-optics below also show no gap opening down to meV. Consistent with this evidence for the lack of a single particle gap, repeated x-ray diffraction studies pouget-Li-struct show no charge density wave or spin density wave.
The various transport and spectroscopy studies of this fascinating material have been made on samples prepared by two methods, an electrolyte reduction technique Schlenker1985 and a temperature gradient flux technique greenblatt84 . Angle resolved photoemission spectroscopy (ARPES) is the only measurement for which any major inconsistency in data obtained from samples prepared by the two different methods has been reported, and the inconsistency is very serious. In particular an extensive set of ARPES data from two groups grioni ; denlinger ; gweon1 ; gweon2 ; gweon3 ; allen ; gweon4 obtained on electrolyte reduction samples show non-Fermi liquid ARPES line shapes consistentdenlinger ; gweon2 ; gweon3 ; allen ; gweon4 with Luttinger liquid (LL) behavior and no low temperature Fermi energy () gap, whereas ARPES data reported xue ; smith_reply ; smith for temperature-gradient-flux grown samples show Fermi liquid (FL) line shapes, a large low temperature gap and an additional feature inconsistent with the known band structure of the material. These differences between the two ARPES data sets are summarized in Ref. [gweon1, ]. The LL line shapes have been verified repeatedly in subsequent studies gweon1 ; gweon2 ; gweon3 ; allen ; gweon4 of samples prepared with the electrolyte reduction technique. Nonetheless it has been a lingering possibility that FL line shapes and a large low temperature gap could perhaps be characteristic of temperature gradient flux grown samples. This Brief Report dispels that possibility by reporting ARPES spectra for temperature gradient flux grown samples that are in full agreement with the line shapes obtained for electrolyte reduction samples.
The spectra reported here were obtained on the PGM beamline at the Wisconsin Synchrotron Radiation Center. Photons of energy 30 eV were used to excite photoelectrons whose kinetic energies and angles were analyzed with a Scienta SES 200 analyzer. Measurement on a freshly prepared Au surface was used to determine the position of in the spectra and the overall energy resolution of 21 meV due to both the monochromator and the analyzer. The angle resolution was set at , better than that in our earlier work gweon1 and exactly the same as used in previous ARPES studies xue ; smith_reply ; smith of temperature gradient flux samples. The sample surface was obtained by cleaving in situ and the data were taken at a sample temperature of 200 K, much higher than the transition temperature 24 K.
For the endstation in place at the time of taking the data reported here, the angular dispersion direction of the SES 200 analyzer was vertical. ARPES symmetry analysis of the data obtained shows that the one dimensional –Y chain axis direction was (unintentionally) oriented at an angle of 13o to the vertical. Nonetheless we will refer to this geometry as the “vertical geometry” from here on in the paper. Due to this small angular offset, the dispersions in this data set are slightly different from those that we obtained previously along the –Y axis, as documented carefully in discussing Fig. 2 below. We have repeated the measurement in exactly the same geometry as that of our previous experiments denlinger ; gweon1 ; gweon2 ; gweon3 ; allen ; gweon4 , i.e. one in which both the one dimensional chain axis and the angular dispersion direction of the analyzer are horizontal and well aligned, and found dispersions essentially identical to those of the previous denlinger ; gweon1 ; gweon2 ; gweon3 ; allen ; gweon4 data. We will refer to this geometry as the “horizontal geometry” below. Despite the small angular offset, we present here the data taken in the vertical geometry because (1) these data happen to show the -crossing line shapes most clearly among all of our data sets, by virtue of having fortuitously the maximum intensity of the band crossing relative to the intensities of the bands that do not cross , and (2) the differences in dispersions have been verified to arise from the small offset and are in any case so slight as to be insignificant for the central thrust of this paper. Both of these points are elaborated below. Another advantage of the vertical geometry setup was that it allowed acquisition of intensity maps like the one presented below (Fig. 1) for many parallel one dimensional paths crossing the FS. Thereby we could verify that the LL behavior holds for such paths anywhere in the Brillouin zone, regardless of the exact location of the momentum space cut across the Fermi surface, so that Fermi liquid behavior does not occur for some very specific cut, as reported previously xue ; smith_reply for temperature gradient flux samples.
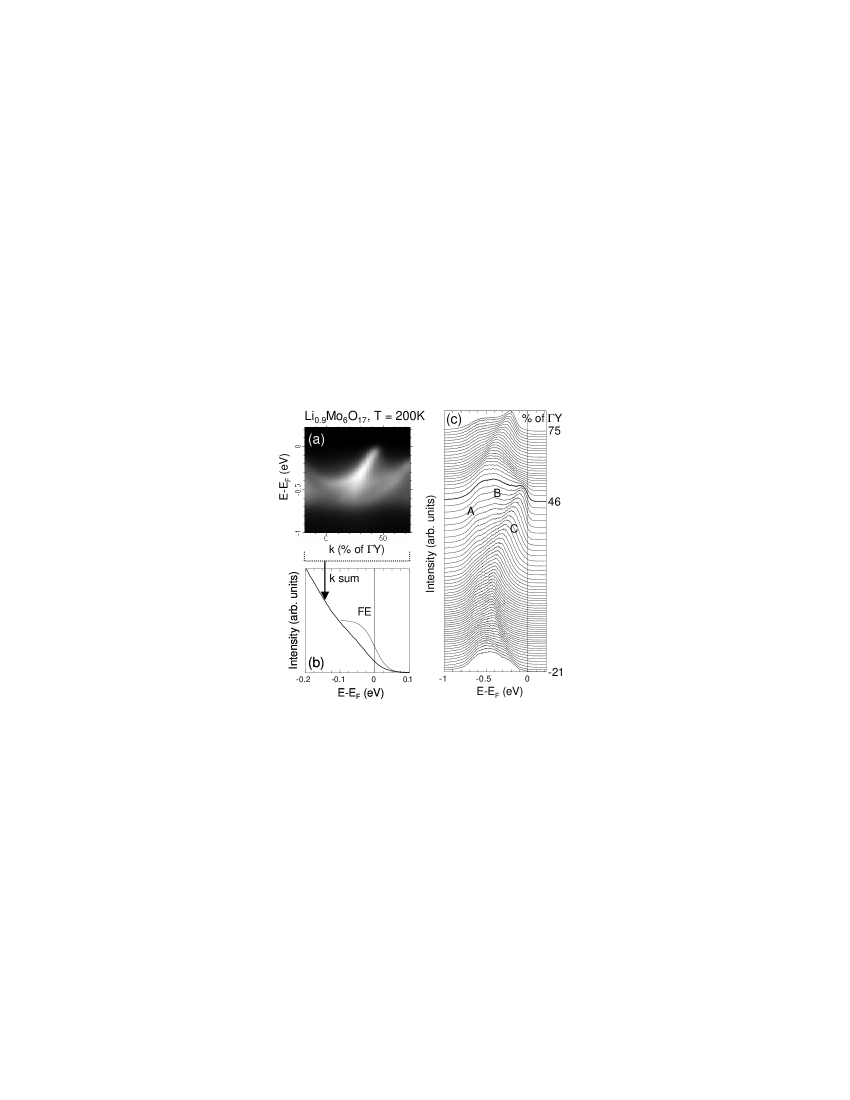
Fig. 1 shows ARPES spectra taken in the vertical geometry on a sample grown by the temperature gradient method. Panels (a) and (c) summarize the overall electronic structure with k labels denoting the k values projected onto the -Y axis. We label the bands A,B,C in the order of decreasing binding energy at . As we will discuss in connection with Fig. 2 below, the overall band structure revealed by the data is consistent with the data in the literature grioni ; denlinger ; gweon1 ; gweon2 ; gweon3 ; allen ; gweon4 obtained on samples grown by the electrolyte reduction method, as well as with band theory whangbo . Furthermore, the LL line shapes observed previously denlinger ; gweon1 ; gweon2 ; gweon3 ; allen ; gweon4 are not just confirmed, but actually better observed due to the enhanced strength of band C relative to that of bands A,B in the present data. For example, we can now clearly observe that the spectral weight of band C shows a back-bending behavior after the peak has crossed the Fermi level (darker curve), one of the key signatures of the LL line shape. In panel (b) we show the k-sum of the ARPES data. As found previously, the resulting line shape is far from the Fermi edge line shape expected of a FL and instead is described much better by a LL with , where is the so-called the anomalous dimension of the LL.
Panel (a) of Fig. 2 summarizes the overall band structure determined from the present data (open circles) and compares it with that from our previous result (diamonds) taken on a sample grown by the electrolyte reduction technique. The small differences arising from the slightly different k-paths can be seen. For example, in the new data band B becomes almost non-dispersive when peak C crosses while this occurs for larger k values for the data perfectly along -Y. As shown in panel (b) band theory predicts bands A, B, and C essentially as observed, and also a fourth band D. Bands A and B do not cross and C and D become degenerate and cross together. All four bands have been observed denlinger ; gweon1 ; gweon2 for various k-paths, although band D is typically very weak, just a slight shoulder on the leading edge of peak C, and is clearly seen only for a particular k-path denlinger ; gweon3 where it appears as a main peak. In the vertical geometry data, band D is nearly undetectable (see Fig. 1 (c)) but was observed very weakly in the horizontal geometry data, consistent with previous results. For completeness, we mark the approximate position of band D thus found for the present sample as a gray region. This position is similar to that found for previous samples along the same, i.e. the -Y, direction as well as along the special k-path denlinger ; gweon3 where D is strong.
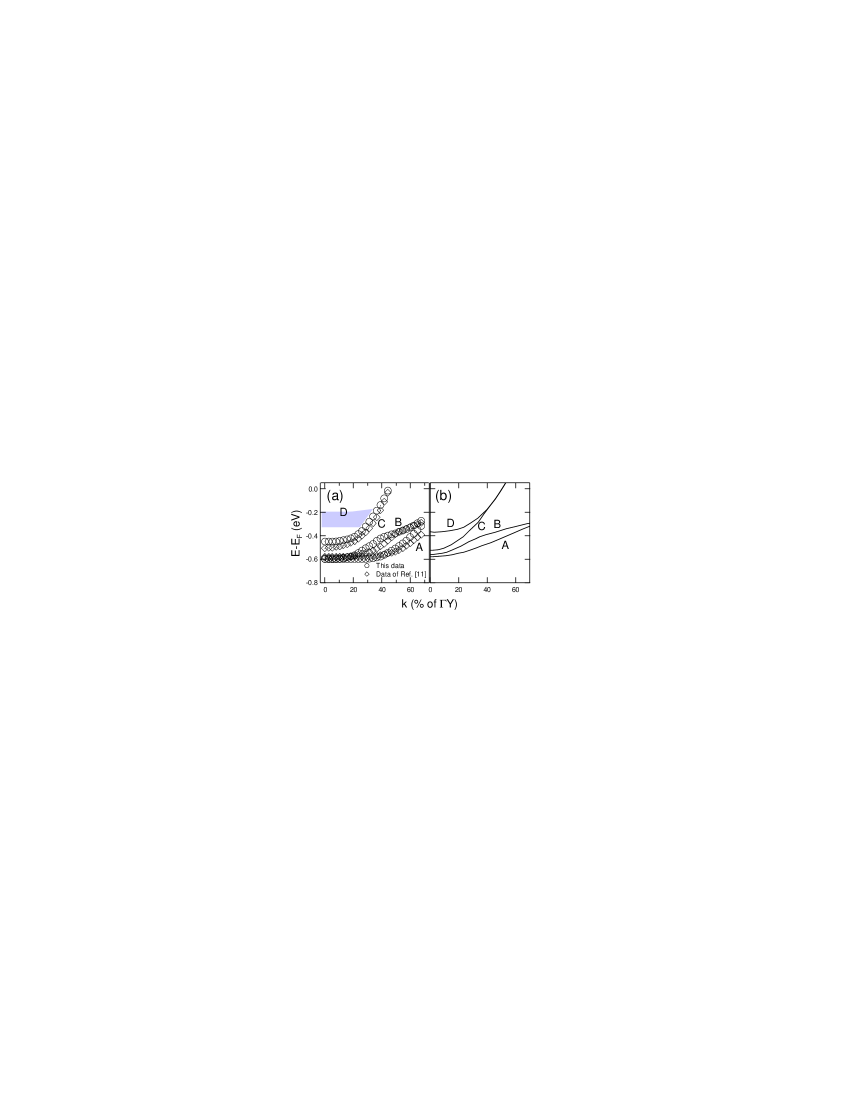
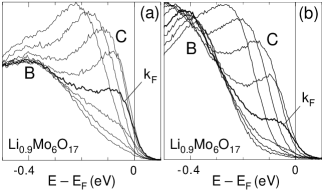
Fig. 3 compares the crossing line shapes measured on the samples grown by the two different methods, with panel (a) showing the new data in the vertical geometry for the temperature gradient flux sample, and panel (b) showing data from Ref. [gweon3, ] taken at the same photon energy for the electrolyte reduction sample. In each panel, the data are presented with the spectra for the various k-values overplotted to better show the approach and crossing of peak C. As explained in the previous paragraph, a small difference of the band B dispersion arises from the slightly different k-paths. The general features of the two sets of spectra are nearly identical, except that, as mentioned already, in (a) the strength of band C relative to that of the non- crossing band B is greater than in (b). Therefore the intrinsic line shape features of band C, which we have shown denlinger ; gweon2 ; gweon3 ; allen ; gweon4 to be well described by the LL line shape theory, are now even more clearly visible. These include the spinon edge and the holon peak, which disperse with different velocities, the diminution of intensity as is approached, and the back dispersing edge after the peak has crossed . One is now forced to conclude that the large disagreement of the overall band dispersions and crossing line shapes found previously gweon1 for the ARPES data reported by Xue et al.xue ; smith and those reported by ourselves and others grioni ; denlinger ; gweon1 ; gweon2 ; gweon3 ; allen ; gweon4 do not stem from the sample growth method.
Before concluding, we note that samples prepared by us [JH, RJ and DM] in the same way as for those used in the ARPES reported here, have also been used for new measurements of the temperature dependences of the resistivity, specific heat, magnetic susceptibility and optical properties musfeldt . These results have re-confirmed that no gap opening is associated with the low resistivity rise and have been interpreted as showing the probable importance of localization effects for the properties below . Although the lower energy limit of the new optical study is 10 meV, larger than the minimum energy of 1 meV of a previous optical study degiorgi-purple-optics , it is nonetheless smaller than the energy resolutions used in any ARPES studies on the material to date ( meV). Further, the new optical study found that the spectral weight increases below in the low energy sector ( meV) for which previous ARPES studies xue ; smith_reply ; smith on temperature gradient flux samples found a large gap opening (2 80 meV).
To summarize, we have shown that the ARPES spectra of Li0.9Mo6O17 samples prepared by temperature gradient flux growth display LL behavior the same as seen for samples prepared by the electrolyte reduction method, thus augmenting further the strong case for LL ARPES lineshapes already established by our past ARPES work on this material.
Acknowledgements.
This work was supported by the U.S. NSF grant DMR-99-71611 and the U.S. DoE contract DE-FG02-90ER45416 at U. Mich. The ORNL is managed by UT-Battelle, LLC, for the U.S. DoE under contract DE-AC05-00OR22725. Work at UT was supported by the NSF Grant DMR 00-72998. The SRC is supported by the NSF Grant DMR-0084402.† Current address: MS 2-200, Lawrence Berkeley National Laboratory, 1 Cyclotron Road, Berkeley, CA, 94720; Electronic address: gweon@umich.edu.
References
- (1) C. Schlenker, H. Schwenk, C. Escribe-Filippini, and J. Marcus, Physica 135B, 511 (1985).
- (2) Y. Matsuda, M. Sato, M. Onoda, and K. Nakao, J. Phys. C 19, 6039 (1986).
- (3) L. Degiorgi, P. Wachter, M. Greenblatt, W. H. McCarroll, K. V. Ramanujachary, J. Marcus and C. Schlenker, Phys. Rev. B 38, 5821 (1988).
- (4) J. P. Pouget, private commmunication.
- (5) M. Greenblatt, W. H. McCarroll, R. Neifeld, M. Croft and J. V. Waszczak, Solid State Comm. 51, 671 (1984).
- (6) M. Grioni, H. Berger, M. Garnier, F. Bommeli, L. Degiorgi and C. Schlenker, Phys. Scripta T66, 172 (1996).
- (7) J. D. Denlinger, G.-H. Gweon, J. W. Allen, C. G. Olson, J. Marcus, C. Schlenker and L. S. Hsu, Phys. Rev. Lett. 82, 2540 (1999).
- (8) G.-H. Gweon, J. D. Denlinger, J. W. Allen, C. G. Olson, H. Höchst, J. Marcus, and C. Schlenker, Phys. Rev. Lett. 85, 3985 (2000).
- (9) G.-H. Gweon, J. D. Denlinger, J. W. Allen, R. Claessen, C. G. Olson, H. Höchst, J. Marcus, C. Schlenker and L. F. Schneemeyer, J. Elec. Spectro. Rel. Phenom. 117-118, 481 (2001).
- (10) G.-H. Gweon, J. D. Denlinger, C. G. Olson, H. Höchst, J. Marcus and C. Schlenker, Physica B 312-313, 584 (2002).
- (11) J. W. Allen, Solid State Commun. 123, 469 (2002).
- (12) G.-H. Gweon, J. W. Allen, and J. D. Denlinger, Phys. Rev. B 68, 195117 (2003).
- (13) J. Xue, L.-C. Duda, K. E. Smith, A. V. Fedorov, P. D. Johnson, S. L. Hulbert, W. McCarroll, and M. Greenblatt, Phys. Rev. Lett. 83, 1235 (1999).
- (14) K. E. Smith, J. Xue, L.-C. Duda, A. V. Fedorov, P. D. Johnson, W. McCarroll, and M. Greenblatt, Phys. Rev. Lett. 85, 3986 (2000).
- (15) K. E. Smith, J. Xue, L.-C. Duda, A. V. Federov, P. D. Johnson, S. L. Hulbert, W. McCarroll and M. Greenblatt, J. Elec. Spectro. Rel. Phenom. 117-118, 517 (2001).
- (16) M.-H. Whangbo and E. Canadell, J. Am. Chem. Soc. 110, 358 (1988).
- (17) J. Choi, J. L. Musfeldt, J. He, R. Jin, J. R. Thompson and D. Mandrus, Phys. Rev. B, 69, 085120 (2004).