Optical study of the metal-insulator transition in CuIr2S4 crystals
Abstract
We present measurements of the optical spectra on single crystals of spinel-type compound CuIr2S4 . This material undergoes a sharp metal-insulator transition at 230 K. Upon entering the insulating state, the optical conductivity shows an abrupt spectral weight transfer and an optical excitation gap opens. In the metallic phase, Drude components in low frequencies and an interband transition peak at are observed. In the insulating phase, a new peak emerges around . This peak is attributed to the transition of electrons from the occupied Ir3+ state to upper Ir4+ subband resulting from the dimerization of Ir4+ ions in association with the simultaneous formations of Ir3+ and Ir4+ octamers as recently revealed by the x-ray diffraction experiment. Our experiments indicate that the band structure is reconstructed in the insulating phase due to the sudden structural transition.
pacs:
72.80.Ga, 78.20.Ci, 71.30.+h, 78.30.-jSpinel type compound CuIr2S4 has recently attracted much attention for its intriguing first-order metal-insulator transition (MIT) at TMI 230 K Nagata1 ; Furubayashi ; Oda ; Matsuno ; Nagata2 ; Matsumoto ; Suzuki ; Burkov ; Hayashi ; Cao1 ; Radaelli ; Ishibashi ; Furubayashi2 ; Cao2 ; Croft . The transition is characterized by a sudden increase of the electrical resistivity, a disappearance of Pauli paramagnetism, a hysteresis loop in resistivity and magnetic susceptibility , and a lowering of structure symmetry. Above the MIT temperature, CuIr2S4 has a normal cubic spinel structure, in which the Cu ions (A sites) are tetrahedrally coordinated and the Ir ions (B sites) are octahedrally coordinated by sulfur ions. Upon entering the low temperature insulating phase, a structural deformation occurs, lowering the lattice symmetry to triclinic Radaelli .
The structure and the MIT in CuIr2S4 is reminiscent of a classic spinel compound–the magnetite Fe3O4, which also exhibits an abrupt MIT at about 120 K, called the Verway transition Verwey . The Fe3O4 undergoes a ferrimagnetic transition at a much higher temperature (858 K). Below this temperature, the magnetic moments of the Fe ions are ferrimagnetically ordered, but the A sites [Fe3+ (t, s=5/2)] and B sites [Fe2+ (, s=2) and Fe3+ (s=5/2)] have opposite spin directions. The Verway transition has been interpreted as a charge ordering transition of Fe2+ and Fe3+ on the B sites in alternate (001) planes note1 .
Naturally, it is considered that the MIT in CuIr2S4 is similar to the Verway transition in Fe3O4. Since the band structure calculation and the photoemission experiments revealed that the valence state of Cu is Cu1+ Oda ; Matsuno , it is believed that the ionic configuration of Cu1+Ir3+Ir4+S is realized in the low-T insulating phase, and the ordering of Ir3+ and Ir4+ ions is a plausible origin of the MIT Matsuno ; Cao1 . Indeed, recent high-resolution synchrotron X-ray powder diffraction experiment revealed a peculiar form of charge ordering which consists of alternating arrangement of isomorphic octamers or clusters of IrS24 and IrS24 (as isovalent bi-capped hexagonal rings) together with spin-dimerizations between Ir4+ ions Radaelli . The charge-ordering pattern is much more complicated than Fe3O4 as well as any other previously known charge-ordered structures which are typically based on stripes, slabs or chequerboard patterns. The simultaneous charge-ordering and spin-dimerization transition is a rare phenomenon in three-dimensional compoundsRadaelli . Therefore, it is very interesting to further explore how the electronic structures change in the MIT. This work presents a detailed infrared spectroscopy study on single crystal samples. It provides important information about low-lying excitations across the transition.
Single crystals of CuIr2S4 were grown from the bismuth solution Matsumoto2 . First, single phase CuIr2S4 powders were synthesized by solid-state reaction in sealed quartz tube using high purity (better than 4N) powders of elements Cu, Ir, and S as starting materials. Then, CuIr2S4 and metal bismuth (6N) in the molar ratio of 1:100 were sealed in an evacuated quartz ampoule. The ampoule was heated to 1273 K, and holding for two days. Crystals of CuIr2S4 were grown by cooling at 4 K/hour down to 773 K. Typically, the crystals have triangular shape of surface with edge length about 0.4 mm. The near-normal incidence reflectance spectra were measured by using a Bruker 66v/S spectrometer in the frequency range from 100 cm-1 to 28000 cm-1 . The sample was mounted on an optically black cone in a cold-finger flow cryostat. An in situ overcoating technique was employed for reflectance measurement Homes , which enables us to get reliable data on small-size samples. The spectra above 500 cm-1 was collected on one single crystal, while the data in the far-infrared regime was obtained on mosaic crystal samples. The optical conductivity spectra were obtained from a Kramers-Kronig transformation of R(). We use Hagen-Rubens’ relation for the low frequency extrapolation, and a constant extrapolation to 80000 cm-1 followed by a well-known function of in the higher-energy side.
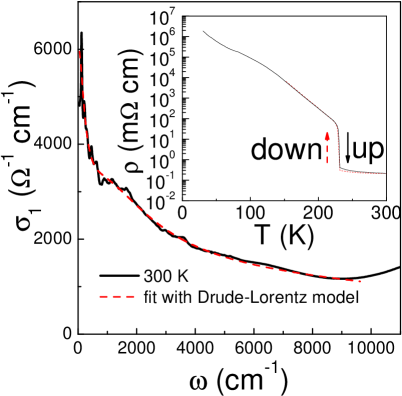
Fig. 1 shows the room-T optical conductivity below 11000 cm-1 . The dc resistivity as a function of temperature is shown in the inset. There is a sharp metal-insulator transition at 230 K. The optical spectrum shows an usual metallic response with a conductivity minimum around 9000 cm-1 . The spectrum could be well fitted with two Drude components and a Lorentz oscillator below the frequency of minimum conductivity. The two Drude components, which result from bands crossing the Fermi energy, have plasma frequencies and scattering rates of 7000cm-1 , 250 cm-1 and 20000cm-1 , 2400 cm-1 , respectively. The Lorentz part has a central frequency of 4000 cm-1 (0.5 eV).
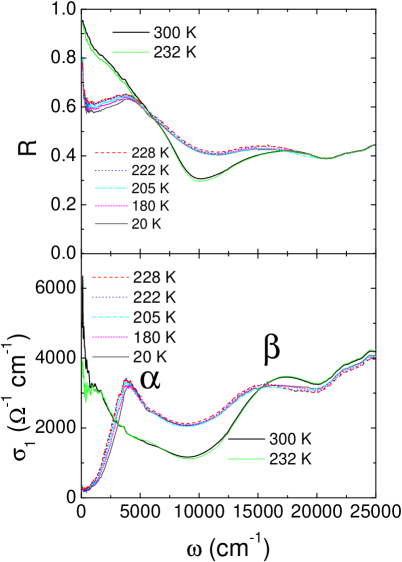
Fig. 2 shows the reflectance and optical conductivity spectra at different temperatures over broad frequencies. The spectra show little change as temperature decreases from 300 K to 232 K, except in the very low-frequency region. However, upon entering the insulating phase, dramatic change occurs in optical spectra. The low- spectral weight below 0.5 eV (4000 cm-1 ) is severely suppressed, resulting in the opening of an optical gap. The missing spectral weight is transferred to higher energies, forming a pronounced peak () at 0.5 eV. In addition, another peak (labelled as ) exists around 2 eV (16000 cm-1 ). This peak is also present in the metallic state in high temperatures at slightly higher frequency. The strong suppression of the low-energy spectral weight and the two-peaks ( and ) structure are the most pronounced features below TMI.
Understanding the above spectral change, which is the main task of this work, is crucial for the understanding of the change of electronic structures above and below . Because Cu at A site is in the Cu1+ valence state (3d10) Matsuno , the Cu 3d band is fully filled. The band structure calculations indicate that the Cu 3d band locates at about 3 eV below EF.Oda Thus the MIT and the accompanied change is mainly due to the variation of the electronic states of 5d transitional metal Ir. Due to the crystal field and the hybridization between Ir 5d and S 3p orbitals, the splitting of the and bands of Ir 5d electrons is fairly large.Note2 As a result, a low-spin state of Ir 5d electrons is favored. The Ir band is empty and the states near Fermi level are mainly contributed by the Ir bands, but hybridized with S 3p orbitals.
Let us begin our discussion with the metallic phase in which CuIr2S4 has normal cubic spinel structure. There is only one equivalent position for Ir in the structure with a valence state of Ir+3.5 and the Ir 5d band is partially filled. Band structure calculation indicates that two bands arising from the hybridization of Ir 5d (i.e. ) and S 3p cross the Fermi energy Oda . These two bands lead to the Drude responses in low frequencies. In this case, the electronic state could be understood from the schematic picture of Fig. 3(a).
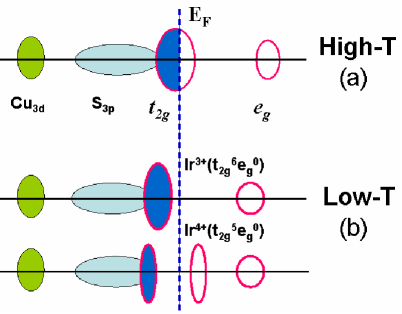
Upon entering the insulating state, a first-order structural phase transition occurs and the lattice symmetry becomes triclinic Radaelli . Most remarkably, CuIr2S4 undergoes a complex charge-ordering transition. A group of 8 Ir3+ or Ir4+ octahedra forms a cluster called octamer, which can be viewed as planar hexagonal rings with two additional octahedra attached to the opposite sides. The Ir ions in the Ir4+ octamers exhibits drastic alternations of long and short Ir-Ir distances, whereas the Ir-Ir distance in Ir3+-octamers are uniform Radaelli . These structural features reveal important clues for the understanding of the low-T optical spectra. Because of the low-spin state of Ir ions, Ir3+ has fully filled bands and completely empty band. Therefore, the Ir3+ (spin s=0) octamers are insulating. The Ir4+ has configuration (spin S=1/2) and one of the orbitals is half filled. In principle, a material with a half filled band should be metallic. However, the dimerization of Ir4+ ions splits this band into two subbands. The lower subband is fully occupied while the upper subband is empty (Fig. 3b). Since the peak appears only in the insulating phase, it is reasonable to attribute the peak to the transition of electrons from the occupied Ir3+ or lower Ir4+ to upper Ir4+ subband. Since the transition of electrons from Ir4+ site to Ir4+ site actually requires to overcome additional on-site Coulomb repulsion energy, it is plausible that the lowest excitation is from Ir3+ state to upper Ir4+ subband. This is equivalent to say that the peak is originated from the inter-octamer hoppings. The peak comes from the transition of electrons from the occupied Ir to the empty Ir bands. Since the unoccupied Ir bands exist at temperature higher than the MIT, the component is observable even in the metallic phase. This is the reason why the temperature-dependence of the peak is different from that of the one. The interband transition from Cu 3d to other unoccupied state should appear at higher energies.
The optical data and the analysis provide a clear picture about the change of electronic structures above and below the MIT temperature. The high-T metallic state is due to the band conduction of hybridized Ir and S 3p electrons. In the insulating state, the formation of the Ir3+ and Ir4+ octamers results in two different types of insulating clusters. Ir3+ octamers have fully occupied Ir bands, whereas Ir4+ octamers produce two splitting subbands because of the Ir4+-Ir4+ dimerization. Furthermore, the dimerized Ir4+ ions form a spin singlet. It suppresses the Pauli paramagnetism of CuIr2S4 and leads to the diamagnetic nature of the insulating state Cao1 .
The above discussion on the evolution of the electronic states is consistent with a recent S K and Ir x-ray absorption study on CuIr2S4 by Croft et al.Croft where similar redistribution of Ir 5d electronic states across the MIT has been proposed. Apparently, the MIT of CuIr2S4 is different to the Verway transition in Fe3O4. Fe3O4 contains relatively narrow 3d band and the charge ordering is most likely caused by the competition between the bandwidth and strong intersite Coulomb repulsion note1 ; Cullen . However, CuIr2S4 is expected to have a wide 5d band and weaker Coulomb repulsion. The MIT in CuIr2S4 is due to the reconstruction of Ir 5d bands associated with the structural change.
Our result shows unambiguously that the MIT in CuIr2S4 is directly correlated with the structureal instability. It seems that this structural instability is unique in the CuIr2S4 family. Any substitution to A-sites (e.g. Zn for Cu) Cao1 ; Cao2 or B-sites (e.g. Rh for Ir) Matsumoto or S-sites (e.g. Se for S) Nagata2 will suppress the structural deformation and drive the compound into metallic or superconducting in low temperatures. The strong electron-phonon coupling is the most probable mechanism responsible for the structural instability. Further theoretical and experimental efforts to the understanding of this mechanism are desired.
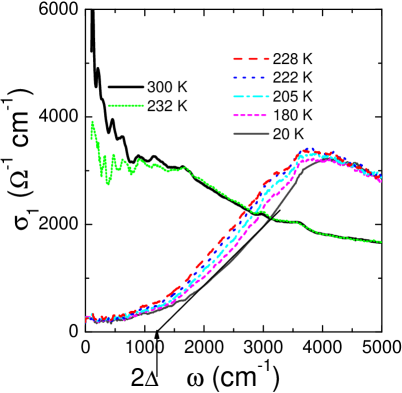
Fig. 4 shows the low- conductivity spectra in an expanded scale. Below the MIT temperature, the optical conductivity increases quickly above 1000 cm-1. A rough estimation of the optical gap could be obtained by extrapolating the linear increasing part to the base line of =0. This gives the value of the optical gap 2 1200 cm-1 ( 0.15 eV). The gap magnitude () is close to the activated gap values estimated from several dc resistivity measurements Nagata1 ; Furubayashi . Matsuno et al. performed photoemission measurements on CuIr2S4 , but assigned a much smaller gap amplitude of in the insulating phase Matsuno . However, by looking at their spectral curves at 250 K and 30 K, we found that the spectral edge actually shifts about 70 to 80 meV away from the Fermi level, and seemed to be consistent with our experiment. Additionally, we found that the energy gap changes very little as the temperature increases from 10 K to 228 K. The sudden opening of the energy gap below MIT is associated with the structureal transition, and is a characteristic feature of the first-order structural phase transition.
To conclude, optical conductivity spectra have been investigated for single crystals of CuIr2S4 . The metallic response at high temperature is due to the band conduction of Ir electrons, which are hybridized with S 3p electrons. The MIT in CuIr2S4 is caused by the reconstruction of Ir 5d bands associated with the structural change. The formations of the Ir3+ and Ir4+ octamers below TMI result in two different types of insulating clusters. We attribute the peak to the transition of electrons from the occupied Ir3+ state to upper Ir4+ subband created by the spin-dimerization in the Ir4+ octamers, and the component to the transition from the occupied Ir to the empty Ir bands.
This work is supported by National Science Foundation of China (No. 10025418, 10104012, 10374109), the Knowledge Innovation Project of Chinese Academy of Sciences.
References
- (1) S. Nagata, T. Hagino, Y. Seki, and T. Bitoh, Physics B 194-196, 1077 (1994).
- (2) T. Furubayashi, T. Matsumoto, T. Hagino, and S. Nagata, J. Phys. Soc. Jpn. 63, 3333 (1994).
- (3) T. Oda, M. Shirai, N. Suzuki, and K. Motizuki, J. Phys.: Condens. Matter 7, 4433 (1995).
- (4) J. Matsuno, T. Mizokawa, A. Fujimori, D. A. Zatsepin, V. R. Galakhov, E. Z. Kurmaev, Y. Kato and S. Nagata, Phys. Rev. B 55, R15979 (1997).
- (5) S. Nagata, N. Matsumoto, Y. Kato, T. Furubayashi, T. Matsumoto, J. P. Sanchez and P. Vulliet, Phys. Rev. B 58, 6844 (1998).
- (6) N. Matsumoto, R. Endoh, S. Nagata, T. Furubayashi and T. Matsumoto Phys. Rev. B 60, 5258 (1999).
- (7) H. Suzuki, T. Furubayashi, G. Cao, H. Kitazawa, A. Kamimura, K. Hirata, and T. Matsumoto, J. Phys. Soc. Jpn. 68, 2495 (1999).
- (8) A. T. Burkov, T. Nakama, M. Hedo, K. Shintani, K. Yagasaki, N. Matsumoto, and S. Nagata, Phys. Rev. B 61, 10049 (2000).
- (9) M. Hayashi, M. Nakayama, T. Nanba, T. Matsumoto, J. Tang, and S. Nagata, Physica B 281-282, 631 (2000).
- (10) G. Cao, T. Furubayashi, H. Suzuki, H. Kitazawa, T. Matsumoto, Y. Uwatoko, Phys. Rev. B 64, 214514 (2001).
- (11) P. G. Radaelli, Y. Horibe, M. J. Gutmann, H. Ishibashi, C. H. Chen, R. M. Ibberson, Y. Koyama, Y.-S. Hor, V. Kiryukhin, and S.-W. Cheong, Nature (London) 416, 155 (2001).
- (12) H. Ishibashi, T. Y. Koo, Y. S. Hor, A. Borissov, P. G. Radaelli, Y. Horibe, S-W. Cheong, and V. Kiryukhin, Phys. Rev. B 66, 144424 (2002).
- (13) T. Furubayashi, H. Suzuki, T. Matsumoto, and S. Nagata, Solid State Communications 126, 617 (2003).
- (14) G. Cao, T. Naka, H. Kitazawa, M. Isobe, and T. Matsumoto, Phys. Lett. A 307, 166 (2003).
- (15) M. Croft, W. Caliebe, H. Woo, T. A. Tyson, D. sills, Y. S. Hor, S-W. Cheong, V. Kiryukhin, and S. J. Oh, Phys. Rev. B 67, 201102(R) (2003).
- (16) E. J. W. Verwey, Nature (London) 144, 327 (1939); E. J. W. Verwey and P. W. Haayman, Physica 8, 979 (1941).
- (17) Dipute about the exact ordering in Fe3O4 still exists. See, for example, a review article: M. Imada, A. Fujimori, and Y. Tokura, Rev. Mod. Phys. 70, 1039 (1988), and a recent work: H. Seo, M. Ogata, and H. Fukuyama, Phys. Rev. B 65, 085107 (2002).
- (18) N. Matsumoto and S. Nagata, J. Cryst. Growth 210, 772 (2000).
- (19) C. C. Homes, M. Reedyk, D. A. Crandles, and T. Timusk, Appl. Opt. 32, 2973 (1993).
- (20) Actually the splitting increases as the transitional metals change from 3d to 5d. This was indicated in the band structure calculations, see ref. Oda
- (21) J. R. Cullen and E. R. Callen, Phys. Rev. B 7, 397 (1973).