LA-UR-04-1122
Nonlinear and Nonequilibrium Dynamics in Geomaterials
Abstract
The transition from linear to nonlinear dynamical elasticity in rocks is of considerable interest in seismic wave propagation as well as in understanding the basic dynamical processes in consolidated granular materials. We have carried out a careful experimental investigation of this transition for Berea and Fontainebleau sandstones. Below a well-characterized strain, the materials behave linearly, transitioning beyond that point to a nonlinear behavior which can be accurately captured by a simple macroscopic dynamical model. At even higher strains, effects due to a driven nonequilibrium state, and relaxation from it, complicate the characterization of the nonlinear behavior.
pacs:
62.40.+i, 62.65.+k, 91.60.LjRocks possess a variety of remarkable nonlinear elastic properties including hysterisis with end-point memory hyst , variation of attenuation and sound velocity with strain winkler , strong dependence of elastic and loss constants on pressure, humidity, and pore fluids phum , long-time relaxation phenomena (‘slow dynamics’) ts , and nontrivial variation of resonance frequency with strain nonh ; recdat . Significantly, materials as diverse as sintered ceramics and damaged steels are now known to display similar effects recdat . Thus rocks may be viewed as representative members of a class of fascinating, but poorly understood, nonlinear elastic materials: Fundamental questions still to be resolved relate not only to the underlying causes of the nonlinear phenomena but also to the conditions under which they occur.
In this Letter, we focus on delineating two strain thresholds, one below which the rocks behave effectively as linear elastic materials, , the other beyond which memory and conditioning effects occur, , and the dynamic elastic behavior straddling the region of these thresholds. While in Ref. winkler it was argued that (albeit with some uncertainty), more recent data recdat ; nonh ; gtj have been used to support an extension of the nonlinear region to substantially lower strains; doubt has been cast even on the very existence of a threshold gj . In addition, results from resonant bar experiments nonh ; gtj have been interpreted to exhibit a ‘nonclassical’ frequency and loss dependence on the drive amplitude, i.e., frequency and softening linearly with drive amplitude rather than quadratically as predicted by Landau theory ll , even at strains as small as . (The importance of in interpreting resonant bar data is emphasized below.)
We have carried out a new set of well-characterized experiments, over a wide dynamic range, to unambiguously settle these questions: While longitudinal resonant excitation of bars is a classic measurement technique rbar , rock samples require substantial care in terms of controlling the temperature and humidity and characterizing possible systematic effects, especially those due to conditioning of the sample by the external drive ts .
Our major conclusions are as follows. For Berea and Fontainebleau sandstone samples, below a threshold strain (lower end for Fontainebleau, upper end for Berea), there was no discernible dependence of the resonance frequency on the strain – the materials behaved linearly to better than 1 part in . For , the materials displayed a reversible softening of the resonance frequency with strain, in excellent qualitative agreement with the quadratic prediction of classical nonlinear theory ll up to a point where memory and conditioning effects became apparent (). In detailing and characterizing the onset and nature of the nonlinearity, our results very substantially improve on previous work winkler . We show below that, up to the conditioning threshold, the dynamical behavior is accurately captured by a phenomenological macroscopic model incorporating a (softening) Duffing nonlinearity and linear losses. Beyond the conditioning threshold, the simultaneous presence of nonlinearity and nonequilibrium dynamics complicates the characterization of dynamical behavior; in the absence of a separation of these effects, the data cannot be interpreted to support the existence of nonclassical behavior.
Our computer-controlled resonant bar experiment uses cylindrical sandstone samples, 2.5 cm in diameter and 35 cm in length. The cylinders are driven sinusoidally at one end by a PZT transducer with a brass backload. The acceleration is measured by a B&K accelerometer at the other end of the bar and converted to an effective average strain using the (known) driving frequency, , via , where is the displacement and is the bar length. The finite accelerometer signal to noise restricts the useful strain sensitivity to while the upper end of strain is limited primarily by the physical integrity of the experimental setup to . Scans of the resonance peak are conducted at constant drive amplitude over an up/down frequency sweep with spot measurements at frequencies bracketing the bar’s resonance frequency (Fig. 1). While in previous experiments gtj the temperature was actively controlled, the present experiments were carried out using passive thermal isolation to avoid even low-level thermal shocks.
The thermal history of a rock sample is known – due to slow build-up and relaxation of internal stresses – to influence the effective elastic modulus, and hence the resonance frequency of the bar. The timescales associated with this behavior can be quite long, of the order of several hours, hence long-term temperature stability is a basic necessity for resonant bar experiments, especially at small strain levels. With the present isolation system, long-term frequency stability of the samples has been verified at Hz (corresponding to a long-term thermal stability of mK), which is close to how well the peak of the frequency response curve can be determined at the lowest levels of strain reported in this Letter.
The basic quantity measured in these experiments is the resonance frequency, , of the bar as a function of the strain, , defined by the peak of the resonance curve as measured above. The statistical analysis used a nonparametric Gaussian process to model data trends. Bayesian estimation and characterization of uncertainty was carried out using Markov chain Monte Carlo carlin .

Traditionally, the loss, as represented by the of the bar has also been reported. However, this quantity is not easy to define or measure precisely [the present bars have (Berea) and (Fontainebleau)] even at high values of ibm . We find experimentally that the full-width of the response curves, (measured at , where is the peak amplitude; ) at all drive levels below the conditioning threshold, is essentially invariant (this behavior is also predicted by the macroscopic model described below). At higher drives, as conditioning and memory effects appear, the response curves are not symmetric around the peak and the width becomes strongly dependent on the drive amplitude. This behavior will be detailed elsewhere us2 .
The determination of as a function of strain is complicated by the fact that external driving can condition the sample and also lead to shifts in the frequency via slow dynamics ts . In order to eliminate this possibility we implemented a ‘zig-zag’ strategy of systematically increasing the drive level through the up/down frequency sweeps, and then dropping back to the original drive amplitude to verify that at the lowest strain value had not changed. Application of this method shows that there are no conditioning effects for for Berea and for Fontainebleau. Up to these strain levels, any variation in as a function of drive amplitude is taken to define the intrinsic nonlinearity of the sample.

The measured variation of over a relatively wide range is shown in Fig. 2 ( is the difference between the measured value and the starting, lowest drive level, value of ). Results from a known linear material, Acrylic, are shown in order to provide a control reference. Within the error bars of the experiment, the materials are effectively elastically linear (no softening of with drive) till . Beyond this point, softens quadratically with increasing drive amplitude until (Fig. 3). We have compared our new results with archival data from previous experiments on Berea reported in Refs. gtj ; allowing for differences in the starting values of , we find that the two datasets are in excellent agreement. This is quite remarkable, and encouraging from the point of view of sample-independence, since the samples were subjected to very different environmental conditions in the two cases. The erroneous conclusion of nonclassical nonlinearity (linear dependence of on ) reached in this earlier work was due to the limited dynamic range in strain of the analyzed data ( decade) versus the present measurements (3 decades): The present data are consistent with a zero value for the cofficient of a linear fit to the softening with strain; the corresponding values of Refs. gtj are an order of magnitude too large to agree with the measurements.
We now describe a simple phenomenological dynamical model for driven rods that provides an excellent description of the measured data. The model is not directly extracted from a one-dimensional (nonlinear) wave equation knopoff . Rather, the procedure follows statistical mechanics-based modeling of degrees of freedom coupled to dissipative channels rwz ; theory . The model adds a quartic (Duffing) softening nonlinearity to a harmonic potential (a more complex model for the higher strain regime is described in Ref. theory ). The equation of motion for the displacement is taken to be:
| (1) |
where . Since the displacement, , is small, multiscale perturbation theory can be used to solve Eqn. (1) very accurately nayfeh . For the case relevant to the experiment (), the solution is . The phase is of no interest here, while the relation between the amplitude of the oscillation, , and the drive amplitude, , is given by
| (2) |
where . It is straightforward to show that the peak of the response curve has the value, , and occurs at the drive angular frequency , with
| (3) |
Thus, the model predicts a quadratic softening of the frequency with the drive amplitude . In addition, by solving Eqn. (2) for , and then substituting , it is easy to show that the width of any response curve is an invariant, .
With these results in hand, it is straightforward to determine model parameters. As the model predicts, we have verified that as measured from the experimental curves is constant within up to the strain , this immediately determining the damping coefficient . The (linear) resonant frequency and the nonlinearity parameter now follow by fitting the experimental data for as a function of the drive using Eqn. (3) (Fig. 3). As apparent from Fig. 1, with these parameters fixed as just described, the model predictions are in excellent agreement with the experimental response curves.

It has been previously claimed that the absence of frequency softening is not sufficient to rule out nonlinearity in rocks as harmonic generation may exist even in the absence of a discernible frequency shift nonh : At least in the materials studied here, this does not occur. Our theoretical model assumes that the fundamental mode dominates the response of the bar to external driving and no higher harmonics are excited via mode-coupling. With the parameters fixed as above, harmonic generation via the intrinsic nonlinearity of the model is very weak, with all even harmonics suppressed, and with odd harmonics typically dB below the fundamental – lower than the noise floor of the experiment, and, consistent with this prediction, we did not observe any harmonic content in the signal even at the highest drive levels.
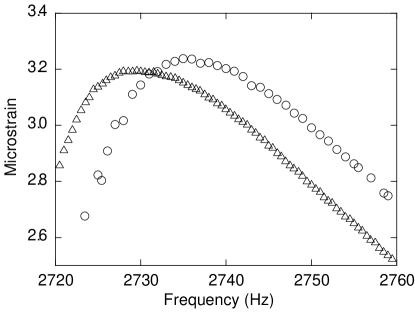
We now turn to the behavior of as is increased beyond , the point where conditioning begins to play a role. Here the frequency softening is such that no longer returns to the starting point when the drive is removed, but to a lower value. It is clear that in this regime the measured softening at a given strain cannot be interpreted as wholly due to an intrinsic nonlinearity; it will as well depend on the sweep-rate ts . Analyzing a vs. curve without taking this effect into account would introduce an unknown systematic effect exaggerating the actual nonlinearity. Fortunately, experimental protocols can be implemented to alleviate this difficulty as described in detail in Ref. us2 . To illustrate these issues, Fig. 4 shows response curves for Berea sandstone in two different regimes. The left curve represents an experiment where, at each frequency, the sample is allowed to come to a new steady state (10 minutes at each frequency), while the right curve allows for 10 minutes between rapidly taken individual measurements to allow a return to thermal equilibrium between measurements. In both cases, the measurement protocols are designed to reduce relaxation effects as much as possible, in one case by staying at all times in a nonequilibrium steady state, and in the other, by allowing a close-to-equilibrium return between measurements. The key point is that at strain levels , the rock transitions to a nonequilibrium state characterized by a different set of macroscopic parameters, as evidenced by the 5 Hz shift between the left and right curves. If measurements could be made rapidly enough so that each point on the right curve corresponds to an equilibrium state, then it is precisely these response curves that are equivalent to data taken at . In practice, however, this procedure is very difficult to carry out as it requires stringent long-term environmental stability. Thus, all measurements to date in this higher strain regime are dangerously contaminated by conditioning; the separate effects of nonlinearity and relaxation in these experiments cannot be disentangled.
To summarize, our experiments have established the existence of a reversible dynamic quadratic nonlinearity in the Berea and Fontainebleau sandstones up to a material-dependent strain threshold, . Below this threshold we find no evidence for nonclassical behavior as reported previously nonh ; gtj . Frequency shifts in dynamical experiments with do not have a simple interpretation due to the existence of a driven nonequilibrium state with differing macroscopic parameters; because of the competition of material nonlinearity and conditioning and relaxation effects, present experimental data cannot distinguish classical from nonclassical effects in this regime. Experiments to do so are in progress.
We are indebted to Tim Darling, Robert Guyer, and Tom Shankland for stimulating discussions.
References
- (1) N.G.W. Cook and K. Hodgson, J. Geophys. Res. 70, 2883 (1965); R.B. Gordon and L.A. Davis, ibid 73, 3917 (1967).
- (2) K. Winkler, A. Nur, and M. Gladwin, Nature 277, 528 (1979) and references therein.
- (3) S.G. O’Hara, Phys. Rev. A 32, 472 (1985); B. Zinszner, P.A. Johnson, and P.N.J. Rasolofosaon, J. Geophys. Res. 102, 8105 (1997).
- (4) J.A. TenCate and T.J. Shankland, Geophys. Res. Lett. 23, 3019 (1996); J.A. TenCate, E. Smith, and R.A. Guyer, Phys. Rev. Lett. 85, 1020 (2000).
- (5) P.A. Johnson, B. Zinszner, and P.N.J. Rasolofosaon, J. Geophys. Res. 101, 11553 (1996).
- (6) For a review, see L.A. Ostrovsky and P.A. Johnson, Riv. Nuovo Cimento 24, 1 (2001).
- (7) R.A. Guyer, J. TenCate, and P.A. Johnson, Phys. Rev. Lett. 82, 3280 (1999); E. Smith and J.A. TenCate, Geophys. Res. Lett. 27, 1985 (2000).
- (8) R.A. Guyer and P.A. Johnson, Physics Today 52, 30 (1999).
- (9) L.D. Landau and E.M. Lifshitz, Theory of Elasticity, (Butterworth-Heinemann, Boston, 1998).
- (10) S.P. Clark (Ed.) Handbook of Physical Constants (Geological Society of America, New York, 1966), J.C. Jaeger and N.G.W. Cook, Fundamentals of Rock Mechanics (Chapman and Hall, London, 1979); R.S. Carmichael (Ed.), CRC Handbook of Physical Properties of Rocks (CRC Press, Boca Raton, 1984); T. Bourbie, O. Coussy, and B. Zinszner, Acoustics of Porous Media (Gulf, Houston, 1987).
- (11) S. Banerjee, B.P. Carlin, and A.E. Gelfand, Hierarchical Modeling and Analysis for Spatial Data (Chapman and Hall/CRC Press, Boca Raton, 2004).
- (12) See, e.g., B.C. Stipe, H.J. Mamin, T.D. Stowe, T.W. Kenny, and D. Rugar, Phys. Rev. Lett. 87, 096801 (2001).
- (13) J. TenCate et al, in preparation.
- (14) See, e.g., L. Knopoff and G.J.F. MacDonald, Rev. Mod. Phys. 30, 1178 (1958).
- (15) R.W. Zwanzig, J. Stat. Phys. 9, 215 (1973).
- (16) S. Habib, K. Heitmannn, and D. Pasqualini, in preparation.
- (17) A.H. Nayfeh, Introduction to Perturbation Techniques (Wiley, New York, 1981); G. Schmidt and A. Tondl, Non-Linear Vibrations (Cambridge University Press, New York, 1986).