Also at ]Physics Department, University of Ljubljana, Slovenia. Also at ]Physics Department, University of Trieste, Italy.
Surfactant-like Effect and Dissolution of Ultrathin Fe Films on Ag(001)
Abstract
The effects of annealing on the structure of ultra thin Fe films (4 - 10 ML) deposited at 150 K on Ag(001) were studied by synchrotron radiation photoelectron diffraction (PED) and x-ray diffraction (XRD). The occurrence of a surfactant-like stage, in which a single layer of Ag covers the Fe film is demonstrated for films of 4-6 ML heated at 500-550 K. Evidence of a stage characterized by the formation of two Ag capping layers is also reported. As the annealing temperature was increased beyond 700 K the surface layers closely resembled the structure of bare Ag(001) with the residual presence of subsurface Fe aggregates. The data illustrate a film dissolution path which is in agreement with recent theoretical models [J. Roussel et al. Phys. Rev. B 60, 13890 (1999)].
pacs:
68.35.-p, 68.55.-aThe phase immiscibility and the excellent matching between Ag(001) and Fe(001) unit cells (mismatch 0.8 ) make Fe/Ag growth attractive in the field of low dimensionality magnetic systems, such as ultrathin films,ultrathin multilayers,multilayers and small aggregates nogueira . At the nanometric scale, atomic exchange processes were found to affect the chemical sharpness of interfaces in films and multilayers.egelhoffmrs Intermixing could be drastically limited at deposition temperatures as low as 140-150 K egelhoffmrs ; lille ; langelaar at the expense of a poor morphological quality of the film.prbrocking ; burgler The film structural evolution induced by post-growth annealing presents many interesting aspects involving activated atomic exchange processes and affecting magnetic properties.magnetism Previous experiments, of He and low energy ion scattering on films deposited at 150 K, indicated the formation of a segregated Ag layer upon moderate annealing (550 K). Higher temperatures led to the embedding of Fe into the Ag matrix.ricciardi In those experiments, information on sub-surface layers was attained by ion erosion depth profiling, a destructive technique mainly sensitive to the topmost layer. Many questions remained open about the film structure and morphology evolution during dissolution. Here we address this issue by presenting photoelectron and x-ray diffraction experiments, performed at the ALOISA beam line (ELETTRA, Trieste). PED provides chemically selected data on film structure with an information depth of several layers. It allows to characterize local order in films which are disordered on a long range scale and possesses specific sensitivity to segregation processes. pedgenerale Systematic PED measurements have been accompanied with a few XRD rod scans yielding a better sensitivity to the buried interface and the film long range order. The results of this paper allow a comparison with recent models enlightening the dissolution paths of an ultra thin metal film into a different metal, when both subsurface migration of the deposit and phase separation between substrate and deposit are favoured.treglia1ML ; treglia10ML
Details on the ALOISA system can be found elsewhere.aloisa The Ag substrate was prepared according to well established procedures.prbrocking Reflection High Energy Electron Diffraction was used to monitor the surface order. XPS surveys were employed to check the chemical composition of the surface. Grazing incidence XPS was also used to monitor in real time Fe 2p and Ag 3p signals during annealing ramps. The sample temperature was controlled by thermocouples and by an optical pyrometer. Guided by results of refs. egelhoffmrs ; ricciardi , heating was stopped at progressively higher temperatures, then cooling the system and looking at film structure. Iron was evaporated by electron bombardment, controlling the deposition flux ( 1.5 Å/min) by a quartz microbalance. Measurements were focused on films in the 4-10 ML thickness range deposited at 150 K. Grazing incidence XRD have been applied on a few films by measuring radial scans across the and peaks in the in–plane Ag(001) reciprocal lattice. These measurements yielded the lateral lattice spacing with a precision better than 0.01 Å. The vertical structure of the Fe film has been also probed by out-of-plane XRD (rod scan), taken for the rod at a photon energy of 6000 eV. PED polar scans were measured at grazing incidence (h = 900-1300 eV) in Transverse Magnetic polarization, by rotating an electron energy analyzer in the scattering plane. The notation Ag (Fe) , will indicate PED scans as a function of the polar angle from the surface normal, obtained by photoemission from states of Ag (Fe). The photoemission intensity was collected at the peak energy and at suitably chosen energies along the peak tails in order to allow for a subtraction of the background due to secondary electrons. FF will denote forward focusing peaks along off normal nearest neighbour atomic chains. For the sake of synthesis we will show only data taken with the Ag surface direction in the scattering plane.
The computational approach to PED was thoroughly described elsewhere.isobruno In brief, the polar scans Iexp() have been compared with calculated Icalc() = ISOcalc() )(). The anisotropy term (), carrying information on the arrangement of atoms around the photo-emitter, was taken proportional to the output generated by the Multiple Scattering Calculation of Diffraction (MSCD) package.mscd Several structural models have been considered both for the as-deposited and the annealed films. We varied the number of Fe planes and considered the presence of one or more Ag layers over the Fe film; intermixed interfaces were also examined. In all calculations, the in-plane lattice constants of the film was set to the substrate value = 2.88 Å, inferred from in-plane grazing incidence XRD, which indicated a pseudomorphic in-plane structure, independently on the investigated thickness and annealing temperature. In fact, the formation of a non pseudomorphic Fe film would have yielded side-peaks or shoulders close to the substrate in-plane XRD peaks,prbbruno which were never observed. The isotropic term ISOcalc() has been calculated, taking into account emission matrix elements, electron escape path, surface roughness and instrumental factors.isobruno Regarding as-deposited films, systematic PED (and Auger electron diffraction) measurements, taken along several azimuthal orientations, indicated growth of Fe films with body centered cubic structure and unit cell rotated by 45∘ with respect to the substrate cell (in brief R45 bcc structure). The body of data resulted in close agreement with literature.egelhoffmrs ; litonner For films thicker than 5 ML the ratio between the vertical and in-plane lattice constants matched unity, as expected for an ideal bcc structure. On the thinnest films the FF peak was slightly shifted from the bcc position, giving a value = 1.06 0.01 for a 4 ML film. This expansion of , was early attributed to the influence of intermixing at the interfaceegelhoffmrs ; prbrocking . Representative measurements on a 6 ML film are reported in the upper panel of Fig. 1.
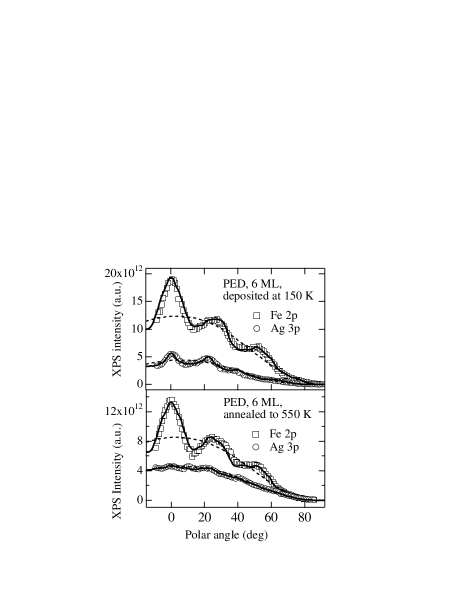
In the figure, the calculations are related to a model with 6 layers of Fe (R45 bcc structure) laying on the substrate mimicked by 3 layers of Ag (in brief 6Fe/Sub). Concerning the Fe pattern, the simulation was insensitive to the value of the interlayer distance at the interface (). The best simulation of the Ag 3p pattern, showing a strong attenuation of intensity and significant shape variations with respect to the bare Ag(001), was obtained with = 1.70 0.03 Å. This value, in between Ag ( 2.04 Å) and Fe ( 1.43 Å) bulk interlayer spacings, enabled reproduction of the main features of the pattern, including the suppression of the FF peak typical of fcc structure, at 45∘.
Fe 2p and Ag 3p patterns obtained on the same 6 ML Fe film after annealing at 550 K are shown in the lower panel of Fig. 1. The shape of the Fe PED pattern was similar to the as-deposited one. The Ag 3p data, showing a quasi isotropic behaviour suggested the simple physical model of a Ag overlayer. Continuous lines in the figure were calculated according to a 1Ag/6Fe/Sub scheme. The structure of the Fe film was the same used for the as-deposited film. The two Fe/Ag interfaces were assumed sharp. The Fe/Ag distance at the top layer resulted = 1.70 0.03 Å. The simulations reproduce rather accurately both Fe and Ag PED patterns supporting quantitatively the assumed structural model.
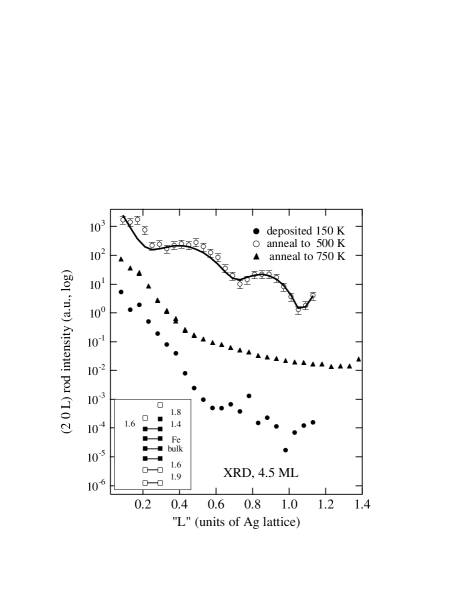
Out-of-plane XRD measurements taken on a 5 ML Fe film are consistent with the model drawn from PED. The XRD scans along the rod are shown in Fig. 2, as taken for the just deposited (150 K) film and after annealing at 500 K and 750 K. The absence of regular features in the pristine film was attributed to the lack of long range order and to the large surface roughness. After annealing to 500 K, well defined modulations appeared, which witnessed the formation of large Fe domains and sharp interfaces. Fitting to the rod scan of the annealed film yielded a model with 4.5 Fe layers covered by one surfactant Ag layer. Due to the reduced region of reciprocal space presently explored, we have reduced the fitting parameters by considering a simple model where the three inner Fe layers were fixed to the bulk spacing. In fact, the rod modulations are mainly sensitive to the film interfaces, where we focussed our fitting optimization. We found an height of 1.6 and 1.8 Å for the Ag surfactant layer above the 4th and 5th Fe layer, respectively. This discrepancy is simply due to the model simplification, which does not allow the 4th Fe layer to relax (see inset of Fig. 2). The width of the buried Fe-Ag interface was found to be 1.6 Å. The height of the first Ag layer below the Fe film was contracted to 1.9 Å. Same quality fits were obtained by admitting intermixing at the first Ag layer below the Fe film (10-15%). In this case the buried interface width was also slightly affected (uncertainty of 0.1 Å).
In the upper panel of Fig. 3, we show PED data obtained on a 10 ML Fe film measured after annealing at 600 K. Fe 2p continued to show bcc-like structure, but with an increased anisotropy along the normal direction. The Ag 3p data show faint features at 0∘, 10∘, 20∘ and a huge peak at 44∘ , indicating the formation of two Ag surfactant layers. Addition of a second Ag surface layer together with optimization of the distance at the interface and of the distance between the first and second Ag layer, yielded a satisfactory simulation of the Ag PED pattern. The Icalc curves, superimposed to the data of Fig. 3, were calculated considering a 2Ag/7Fe model with = 1.73 Å and = 1.90 Å. was set at 1.43 Å. The simulation of the Fe 2p data was less satisfactory suggesting that the model oversimplifies the physical situation, where the second Ag layer could be only partially filled.
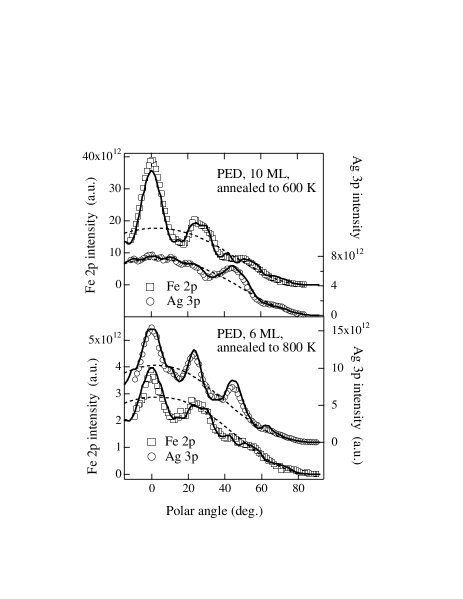
Upon further increasing the annealing temperature, the Ag 3p PED patterns gradually approached the one obtained on bare Ag(001). Beyond 650 K we could not find an unique geometrical input able to describe both Fe 2p and Ag 3p PED patterns. Representative data obtained on the 6 ML film after annealing at 800 K are shown in the lower panel of Fig. 3. The Ag pattern was reproduced considering the same structural model used to fit the PED taken on the clean substrate (not shown). On the other hand models with Fe layers buried under many Ag layers, could not fit Fe 2p patterns at all. The overall intensity of the Fe 2p pattern presented a relevant attenuation with respect to the as-deposited film. However, a significant anisotropy is still appreciable. These findings suggested the presence of subsurface Fe aggregates of small lateral size. Similar effects were also observed from XRD, where the rod scan taken after annealing to 750 K (filled triangles in Fig. 2) yielded a smooth decay due to the disappearance of the subsurface Fe film. This rod scan is indicative of either Fe dissolution in the Ag matrix either fragmentation of the Fe film into small clusters of irregular size and spatial distribution. In order to get more information on such aggregates from PED data, we explored simple Ag/Fe structural models in which layers of Fe (for simplicity with bcc structure) were buried below layers of Ag (with interlayer distance ). A sharp Fe/Ag interface was considered with interface spacing . In the case = 6, i.e. assuming for aggregates the same nominal thickness of the as-deposited film, a qualitative agreement (not shown) could be obtained with = 1 or 2. The agreement became definitely worse with larger values of . A fair reproduction of the pattern (including the twinned PED feature at about 45∘ and 55∘) could be finally obtained with a 2Ag/8Fe model, = 1.87 0.03 Å, = 1.67 0.03 Å (full lines in Fig. 3). Thus, although the shape and size of the Fe subsurface aggregates could not be determined, the analysis of PED pattern confirms, on a quantitative ground, the residual presence of subsurface Fe clusters.
Our data can be rationalized in the light of recent theories on dissolution of ultra thin metal film into a metal substrate which enlightened different routes depending on the physico-chemical coupling of the deposit (A) and substrate (B) treglia1ML ; treglia10ML . When A and B present a tendency to bulk ordering, the dissolution can be blocked by the formation of AB surface alloys. In case of tendency to A/B phase separation, dissolution paths will critically depend on the A and B surface energies. The case of interest here, in which B atoms show a stronger tendency to surface segregation than A atoms as for Fe/Ag or Ni/Ag systems,aufray was illustrated in Ref.treglia10ML on the example of a 10 ML deposit (schematically indicated as A/A//A/B). According to calculations, if the temperature is raised beyond a threshold TC, dissolution proceeds through the so called surfactant-layer-by-layer (SLBLD) mode. In this regime, on a short range time scale, the system passes through a surfactant like stage, with formation of successive B/A/A//A/B, B/B/A/A//A/B and B/B/B/A/A//A/B profiles. The excellent agreement between data of figs. 1 and 2 with a 1Ag/Fe/Fe//Fe/Sub model nicely demonstrates the occurrence of the B/A/A/../A/B stage. Note that the MSCD simulations provide a reliable indication that the local structure of the Fe film remains substantially intact, in agreement with the model which predicts a negligible loss of deposit matter into the bulk at this stage.treglia10ML In addition, XRD rod scans indicate that the formation of the first Ag surfactant layer does not involve a fragmentation of the Fe film. Rather the film is ordered to a uniform thickness in the early annealing stage and this order is preserved during the segregation of the first surfactant layer. Data of Fig. 3 (upper panel), representing a physical situation mimicking the B/B/A//A/B stage, add further confidence about the agreement of our results with the model. On the basis of these results, we feel encouraged to extend the conclusions about the surfactant stage to the larger spatial scale probed by He diffraction in previous experiments performed under similar experimental conditions.ricciardi Data of Fig. 3 (lower panel) illustrate a clear trend towards film dissolution, which appears in qualitative agreement with the final stage predicted by theory, i.e. total disappearance of deposit species down to the tenth substrate layer, for T TC. Residual Fe clusters in the PED data for the highest annealing temperature is the only deviation of our data from the SLBLD model, possibly due to specific details of the present system surface energies or to experimental limitations. For example, Oxygen impurities tend to locally lower the surface energy of the film, therefore acting as surfactant speciesbonanno competing with Ag.
References
- (1) W.F. Egelhoff, Jr., Phys. Rev. Lett. 59, 559 (1987); Z.Q. Qiu, J. Pearson, S.D. Bader, Phys. Rev. B 49, 8797 (1994);F. Ciccacci , S. De Rossi, Phys. Rev. B 51, 11538 (1995); A. Berger, H. Hopster, Phys. Rev. Lett. 76, 519 (1996); C. Sommers et al., Phys. Rev. B 58, 5539 (1998).
- (2) J. Unguris, R.J. Celotta, D.T. Pierce, J. Magn. Mater. 127, 205 (1993); R. Persaud, H. Noro, J.A. Venables, Surf. Sci. 401, 12 (1998); T. Phalet et al., Phys. Rev. Lett. 86, 902 (2001); E.D. Tober et al. Appl. Phys. Lett. 77, 2728 (2000).
- (3) R.N. Nogueira, H.M. Petrilli, Phys. Rev. B 60, 4120 (1999).
- (4) W.F. Egelhoff, Jr., Mat. Res. Soc. Symp. Proc. 229, 27 (1991)
- (5) M. Canepa et al., Surf. Sci. 352-354, 36 (1996).
- (6) M.H. Langelaar, D.O. Boerma, Surf. Sci. 395, 131 (1997).
- (7) M. Canepa et al., Phys. Rev. B 56, 4233 (1997).
- (8) D.E. Bürgler et al. Phys. Rev. B 56, 4149 (1997).
- (9) Z.Q. Qiu, J. Pearson, S.D. Bader, Phys. Rev. Lett. 70, 1006 (1993); D.M. Schaller et al., Phys. Rev. B 59, 14516 (1999).
- (10) M. Canepa, et al., Surf. Sci. 429, 34 (1999).
- (11) C.S. Fadley, The study of Surface Structures by Photoelectron Diffraction and Auger Electron Diffraction in Synchrotron Radiation Research: Advances in Surface and Interface Science, Vol.1: Techniques, edited by R.Z. Bachrach ( Plenum, New York, 1992); W.F. Egelhoff, Jr. , in Ultrathin Magnetic Structures I, edited by J.A.C. Bland and B. Heinrich ( Springer-Verlag, Berlin, 1994) Chap. 5.1, p. 220.
- (12) L. Floreano et al. Rev. Sci. Instrum. 70, 3855 (1999); R. Gotter et al. Nucl. Instr. Meth. A 467-468, 1468 (2001).
- (13) F. Bruno et al., J. El. Spectr. Rel. Phenom. 127, 85 (2002).
- (14) Y. Chen et al. Phys. Rev. B 58, 13121 (1998).
- (15) F. Bruno et al. Phys. Rev. B 66, 045402 (2002).
- (16) Hong Li, B.P.Tonner, Phys.Rev. B 40, 10241 (1989).
- (17) J.M.Roussel, A. Saúl, G. Tréglia, Phys. Rev. B 55, 10931 (1997).
- (18) J.M.Roussel, A. Saúl, G. Tréglia, Phys. Rev. B 60, 13980 (1997).
- (19) B. Aufray, H. Giordano, B. Legrand, G. Tréglia, Surf. Sci. 331-333, 805 (1995)
- (20) P. Bonanno et al. Surf. Sci. 454-456, 697 (2000).