Abstract
We present a femtosecond time-resolved optical spectroscopy (TRS) as an experimental tool to probe the changes in the low energy electronic density of states as a result of short and long range charge density wave order. In these experiments, a femtosecond laser pump pulse excites electron-hole pairs via an interband transition in the material. These hot carriers rapidly release their energy via electron-electron and electron-phonon collisions reaching states near the Fermi energy within 10-100 fs. The presence of an energy gap in the quasiparticle excitation spectrum inhibits the final relaxation step and photoexcited carriers accumulate above the gap. The relaxation and recombination processes of photoexcited quasiparticles are monitored by measuring the time evolution of the resulting photoinduced absorption. This way, the studies of carrier relaxation dynamics give direct information of the temperature-dependent changes in the low energy density of states. Here we present the application of the femtosecond time-resolved optical spectroscopy for studying changes in the low energy electronic density of states in low dimensional charge density wave systems associated with various charge density wave (CDW) transitions and review some recent experiments on quasi 1D and 2D CDW compounds.
keywords:
femtosecond time-resolved spectroscopy, low dimensional charge density waves[Ultrafast real-time spectroscopy of low dimensional
CDW compounds]Ultrafast real-time spectroscopy
of low
dimensional
charge density wave compounds
1 Introduction
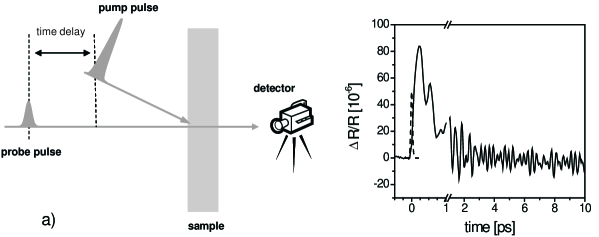
Femtosecond time-resolved optical spectroscopy has been shown in the last couple of years to present an excellent alternative to the more conventional time-averaging frequency-domain spectroscopies for probing the changes in the low energy electronic structure in strongly correlated systems [1, 2]. In these experiments (see Figure 1), a femtosecond laser pump pulse excites electron-hole pairs via an interband transition in the material. In a process which is similar in most materials including metals, and superconductors, these hot carriers rapidly release their energy via electron-electron and electron-phonon collisions reaching states near the Fermi energy within 10-100 fs. Further relaxation and recombination dynamics, determined by measuring photoinduced changes in optical properties (reflectivity, transmissivity or, in case of time-resolved terahertz spectroscopy, far infrared conductivity) as a function of time after photoexcitation, depends strongly on the nature of the low-lying electronic spectrum. In particular, the experimental technique was found to be sensitive to opening of the superconducting gap, appearance of a short-range and long range charge-density wave order [3, 4], and changes in the electronic specific heat and electron-phonon coupling associated with the heavy fermion behavior [5], just to mention a few. What is particularly important is the fact, that even though the probe photon wavelength in these experiments ranges from THz [6, 7, 8] (enabling direct measurement of photoinduced conductivity dynamics), mid-IR to several eV [1,9-16], the dynamics is in many instances the same [6, 7, 8], supporting the idea [1] that the photoinduced reflectivity (transmissivity) dynamics is determined by relaxation and recombination processes of quasiparticles in the vicinity of Fermi energy.
Since the optical penetration depth in these materials is on the order of 100 nm, the technique is essentially a bulk probe. Moreover, since the effective shutter speed is on the order of a picosecond, the technique is particularly useful to probe the systems with (dynamic) spatial inhomogeneities. In this case different local environments (that appear frozen on the timescale of picoseconds) give rise to different components in measured photoinduced reflectivity (transmissivity) traces. As the different components can have different time scales[17, 18], temperature[1, 3], photoexcitation intensity, and probe polarization[17] or wavelength dependences, they can be easily extracted.
Furthermore, due to the fast effective shutter speed of the technique ( ps) one can expect to observe short lived fluctuations that would appear frozen on this timescale. Indeed, the experiments on quasi-1D charge density wave compound K0.3MoO3 [3] suggest that above the transition temperature to the 3D ordered CDW state the technique is sensitive to the presence of short range 3D fluctuations of CDW order.
2 Experimental details
In the experiments discussed below, a Ti:sapphire mode-locked laser operating at a 78 MHz repetition rate and pulse length of 50-70 fs was used as a source of both pump and probe pulse trains. The wavelength of the pulses was centered at approximately 800nm (1.58eV) and the intensity ratio of pump and probe pulses was about 100:1. The pump and probe beams were crossed on the sample’s surface, where the angle of incidence of both beams was less than 10o. The diameters of the beams on the surface were 100m for the pump beam and 50m for the probe beam. The typical energy density of pump pulses was Jcm2, which produced a weak perturbation of the electronic system with the density of thermalized photoexcited carriers on the order of per unit cell (the approximation is based on the assumption that each photon with energy creates thermalized photoexcited carriers, where meV is of the order of the CDW gap [3]). The train of the pump pulses was modulated at 200kHz with an acousto-optic modulator and the small photoinduced changes in reflectivity or transmission were resolved out of the noise with the aid of phase-sensitive detection. The pump and probe beams were cross-polarized to reduce scattering of pump beam into the detector (avalanche photodiode). This way, photoinduced changes in reflectance of the order of can be resolved. A detailed description of the experimental technique can be found in Ref. [2].
3 Photoexcited quasiparticle dynamics in narrow-gap materials
In this section we review the basic ideas of the theoretical model [1] adopted to associate the measured amplitude and the relaxation dynamics of the photoinduced transients with the corresponding changes in the low-energy electronic structure in these narrow-gap materials.
The basis of the model is shown in Figure 2. A pump pulse with photon energy (e.g. 1.5 eV) excites carriers from occupied states below to unoccupied states in bands above - schematically shown by a). The initial phase of the photoexcited carrier relaxation after absorption of the pump laser photon proceeds rapidly. The photoexcitation is followed by carrier thermalization through electron-electron scattering with a characteristic time for intraband relaxation, where is the carrier energy measured from the Fermi energy . In the initial thermalization process, a quasiparticle avalanche multiplication due to electron-electron collisions takes place as long as is less than the electron-phonon (e-ph) relaxation time which is fs in these materials. Therefore, in the absence of gap in the density of states the photoexcitation is followed by rapid carrier relaxation resulting in slightly elevated electron-phonon temperature within fs.
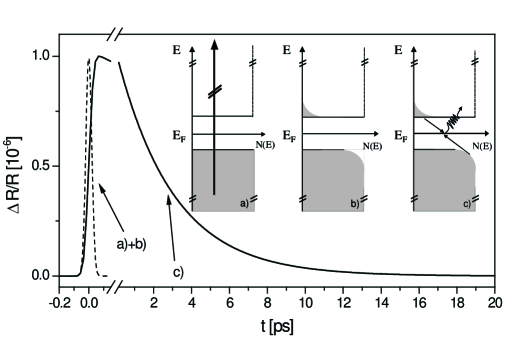
When the gap with magnitude is present in the low energy density of states, phonons with energies less than cannot contribute to the relaxation of carriers just above the gap, therefore the situation is strongly modified and a bottleneck in the relaxation occurs after fs. As a result quasiparticles accumulate near the gap, forming a non-equilibrium distribution shown by b). Since typical values of the energy gap in CDW’s (and cuprates) are of the order of 30 - 100 meV, each photon thus creates quasiparticles given by . The final relaxation step across the gap is strongly suppressed [19], since the high energy phonons emitted by bi-particle recombination (shown by c)) have enough energy to further excite electron-hole pairs. Therefore the quasiparticles together with high frequency phonons (with ) form a near-steady state distribution. The recovery dynamics of this system is governed by the decay phonon population, governed either by the diffusion out of the probed volume or by anharmonic decay to phonons. Since in CDW compounds the energy gap is on the order of 30 - 100 meV, the phonons in question are optical phonons, whose anharmonic decay times are on the order of picoseconds the later mechanism was found to be dominant (diffusion takes place on the timescale of 100’s of picoseconds).
Considering the probe process, we are measuring photoinduced changes of transmission or reflectivity on the picosecond timescale. Since we are dealing with weak perturbations, we can assume that the photoinduced transmission (or reflectivity ) is in the linear approximation proportional to photoinduced absorption . Through the Fermi golden rule the photoinduced absorption is due to changes in the initial or final state carrier density. As the lifetime of quasiparticles high above is of the order of 10 fs, we can assume that the main changes in absorption involve photoexcited carriers just above the gap as initial or final states for absorption. Since the probe laser photon energy is typically well above the plasma frequency, we make an approximation that the photoinduced absorption is given by the Fermi golden rule, with photoinduced quasiparticles above the gap as initial states and unoccupied states at above the Fermi energy as final states - see c) in insert to Figure 2. The amplitude of the photoinduced absorption is thus proportional to the photoexcited quasiparticle density and by measuring the photoinduced transmission (or reflectivity ) the temporal evolution of the photoexcited carrier density is probed. The photoinduced transmission amplitude is weighted by the dipole matrix element and the joint density of states, so , where is the photoexcited carrier density, is the density of (final) unoccupied states, and is the dipole matrix element.
Based on the above arguments, that after initial e-e and e-ph thermalization processes quasiparticles and phonons are is quasi-thermal equilibrium, and that the amplitude of the transient is proportional to the photoinduced quasiparticle density, the one-to-one relation between the temperature dependence of the photoinduced transient amplitude and the amplitude of the low-energy gap in the DOS can be found. Assuming that the energy gap is isotropic, one can approximate non-equilibrium phonon and quasiparticle distribution functions as follows [1, 21]:
| (1) |
| (2) |
where is the lattice temperature and is the temperature of quasiparticles and high frequency phonons with . The number of photoexcited quasiparticles can be calculated as the difference between the numbers of thermally excited quasiparticles (per unit cell) after and before photoexcitation characterized by temperatures and . The number of photoexcited carriers can be obtained directly considering energy conservation [1].
As an illustration of the calculation, let us assume that is temperature independent and large in comparison to . Since the magnitude of the gap is of the order of several 10 meV, which corresponds to temperatures of a few hundred kelvins, we can assume that quasiparticles are non-degenerate and can be approximated as . Similarly we can approximate . When considering the temperature-independent (pseudo-)gap, we take the quasiparticle density of states given by
| (3) |
Strictly speaking the model density of states corresponds to the real gap, however could be understood also as an energy where the relaxation of photoexcited quasiparticles in inhibited. E.g., the density of states below could be finite but the relaxation through these states is suppressed (e.g. relaxation through localized states) therefore they are not available for the relaxation.
Further, we assume that the phonon spectral density is constant at large frequencies . In this case the quasiparticle energy and the energy of high frequency phonons at temperature T are given by
respectively. Here is the number of high frequency phonon modes (per unit cell) and is the phonon cut-off frequency. Since we assume that after photoexcitation the high energy phonons and quasiparticles are described by the same temperature (), we write the conservation of energy as
| (4) |
where is the energy density per unit cell deposited by the incident pump laser pulse. Since quasiparticle density is given by [21], by making the approximation that , Eq.(4) can be rewritten in terms of quasiparticle densities at temperatures and
| (5) |
There are two limiting cases to be considered with respect to the ratio of photoexcited vs. thermally excited quasiparticle densities, .
In the low temperature limit , since is exponentially small. In this case and by equaling to 0 in Eq.(5) one gets the quadratic equation for (). Since is small, one can neglect the quadratic term in Eq.(5) obtaining
| (6) |
It follows that in the low temperature limit the photoinduced signal amplitude is independent of temperature and its magnitude is proportional to photoexcitation intensity .
The second limiting situation is the case when (high temperature limit). Then, taking into account that and , the number of photogenerated quasiparticles at temperature is given by
| (7) |
It is important to stress that Eq.(7) includes also the solution of Eq.(5) in the low temperature limit given by Eq.(6).
Similar derivation can be applied to determine the T-dependence of the number of photoexcited carriers in the case of a temperature dependent mean–field-like gap such that as . This results in a slightly modified expression for that again contains both the low and the high temperature limits
| (8) |
Note that in Eqs.(7) and (8) the explicit form of depends only on the ratio , showing that the intensity of the photoresponse is a universal function of as long as the particular functional form of temperature dependence of is the same. The only parameter in Eqs.(7) and (8) is the dimensionless constant , which can be estimated for each compound studied to at least an order of magnitude. Therefore by fitting the T-dependence of the PI amplitude of the transient the value of the gap can be determined quite accurately.
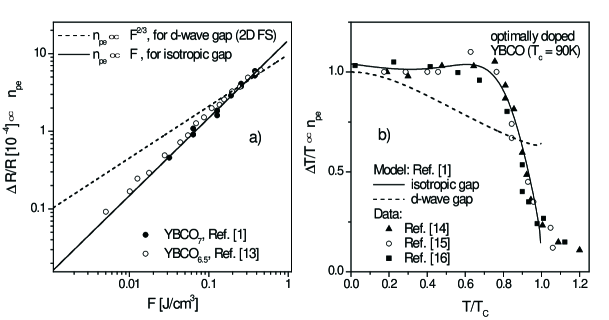
The above derivation has been extended also for the case of an anisotropic gap with nodes [1], which could be used to describe the quasiparticle relaxation dynamics in cuprates, where the vast amount of data suggests d-wave order parameter with nodes[20]. However, the experimental results on cuprates were found to be at odds with the simple d-wave picture. In particular, linear intensity dependence of the photoinduced transient amplitude and its peculiar temperature dependence - see Figure 3 are inconsistent with simple d-wave case scenario. The fact that these experiments do suggest large (more or less isotropic) gap in the density of states, can be however due to particularities of dynamics in cuprates. In other words, since time-resolved techniques measure the fastest channel for relaxation, it is possible that carrier relaxation from antinodes (in direction of maximum of the gap) to nodes is much slower process than recombination to the condensate.
To complete the description of the theoretical model for carrier relaxation dynamics in narrow-gap systems, we should briefly discuss the relaxation dynamics. We have suggested that the lifetime of photoexcited quasiparticle density is governed by anharmonic decay of high frequency phonons. Using the kinetic equations for phonons taking into account phonon-phonon scattering [22]we have obtained the following expression for the rate of recovery of the photoexcited state [1].
| (9) |
The relaxation time for the temperature dependent gap is expected to show a divergence due to the gap closing as Tc is approached from below. This can be easily understood considering phase space arguments. Namely, in the case of a mean-field-like gap, upon increasing temperature closer to , the specific heat of high frequency phonons increases while the specific heat of phonons is decreasing, giving rise to increase in relaxation time [1].
4 Carrier relaxation dynamics in quasi-1D CDW compounds.
In these section we briefly review recent experimental results on femtosecond time-resolved spectroscopy on CDW compounds [3, 4]. In particular, we focus on the results on quasi-1D CDW compound K0.3MoO3, while for the details on the studies of quasi-2D CDW are given elsewhere [4].
Molybdenum oxides A0.3MoO3, where A is a monovalent metal like K, Rb, or Tl - also called blue bronzes due to their shiny blue appearance - are well known for their interesting electronic properties arising from their one-dimensional (1D) chain structures [23]. K0.3MoO3 crystallizes in a monoclinic unit cell [25]. The structure contains rigid units comprised of clusters of ten distorted MoO6 octahedra, sharing corners along monoclinic -axis. This corner sharing provides an easy path for the conduction electrons along the chain direction. The chains also share corners along the [102] direction and form infinite slabs separated by the potassium cations. The [102] direction together with [010] direction form a cleavage plane. At room temperature K0.3MoO3 is a highly anisotropic one-dimensional metal with conductivity ratios (it is a quasi 1D metal).[23] Upon cooling, blue bronzes become susceptible to a Peierls instability on the 1D chains causing fluctuating local CDW ordering. Upon further cooling, inter-chain interactions cause the CDWs on individual chains to become correlated, eventually undergoing a second-order phase transition to a three-dimensionally (3D) ordered state below K. The formation of a 3D CDW ordered state is concurrent with the appearance of a gap in the quasiparticle excitation spectrum, while the collective excitations of the 3D CDW state are described by an amplitude mode (AM) and a phase mode (phason) [24].
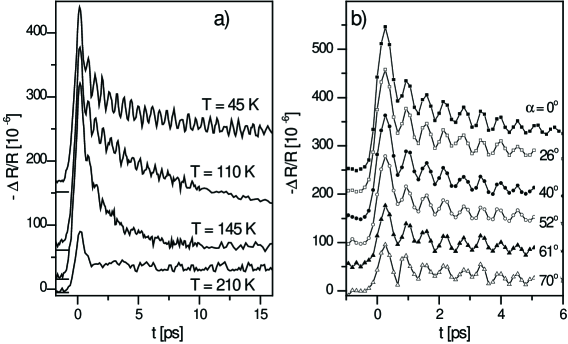
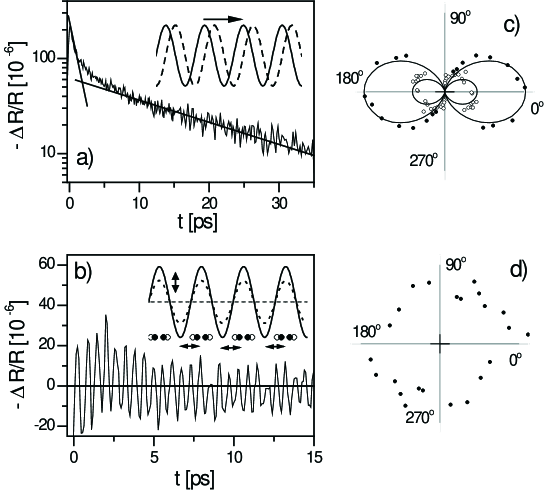
Figure 4a) presents photoinduced reflectivity as a function of time at different temperatures. Below , an oscillatory component is observed on top of a negative induced reflection, the latter exhibiting a fast initial decay followed by a slower decay - see Figure 5 a). As is approached from below, the oscillatory signal disappears, while the fast transient signal remains observed well above as shown by the trace at 210K. For a quantitative analysis, we separate the different components of the signal according to their temperature dependence and probe polarization anisotropy.
Figure 5 presents the decomposed reflectivity transient taken at T K. Panel a) presents the signal with the oscillatory component subtracted. The logarithmic plot enables us to clearly identify two components with substantially different lifetimes, one with 0.5 ps, and the other with ps at low Their amplitudes and relaxation times are analyzed by fitting the recovery dynamics with two exponential decay. Since the two components have very different temperature dependencies they are attributed to the quasiparticle recombination (sub-picosecond component) and an overdamped phason relaxation (10 ps component), respectively[3]. Importantly, the ps transient has a pronounced probe polarization anisotropy with respect to the crystal axes - plotted in panel c). Panel b) presents the oscillatory component, whose Fourier spectrum shows a peak at 1.7 THz. In contrast to the transient signal, the amplitude of the oscillatory signal is independent of polarization - see panel d).
Collective modes response
The oscillatory component, that has been observed also in the experiments on the quasi-2D CDW compounds [4], has a pronounced -dependence. The frequency shows clear softening as Tc is approached from below, while damping increases - see Fig. 6. The measured and closely follow the expected behavior for the amplitude mode and are in good agreement with previous spectroscopic neutron [26] and Raman data [27].
The amplitudon is of symmetry and involves displacements of ions about their equilibrium positions , which depend on the instantaneous surrounding electronic density . Since the excitation pulse is shorter than the excitation (and subsequent ultrafast e-e thermalization) may be thought of as a -function-like perturbation of the charge density and the injection pulse acts as a time-dependent displacive excitation of the ionic equilibrium position The response of the amplitudon to this perturbation is a modulation of the reflectivity of the form by the displacive excitation of coherent phonons (DECP) mechanism, known from femtosecond experiments on semiconductors [28].
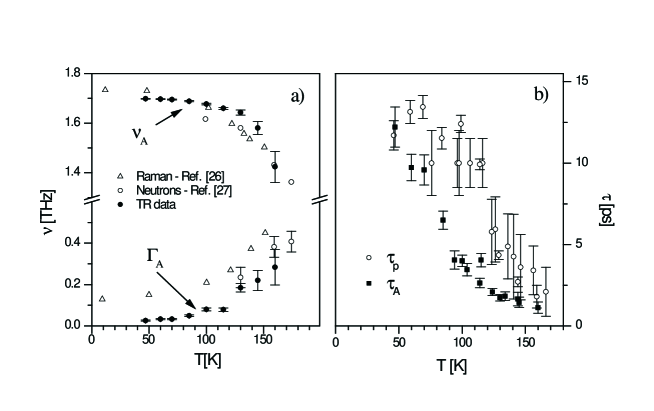
While the association of the oscillatory component to the photoexcited amplitude mode is straight-forward, the association of the 10 ps transient with the overdamped phase mode needs further clarification. In equilibrium, the phason mode is expected to be pinned [24] and at a finite frequency [29], but in non-equilibrium situation such as here, where the excess carrier kinetic energy may easily exceed the de-pinning energy, the mode may be de-pinned. In this case we may expect an overdamped reflectivity transient that can be written as with , but with the damping constant which is expected to be similar to that of the amplitude mode , i.e. 10 ps [30]. In Fig. 6 b) we plot -dependence of . At 50 K ps in agreement with the THz linewidths of the pinned phason mode in microwave and IR experiments [23, 26, 31]. Indeed, comparing and [also plotted in Fig. 6 b)], at 50K but the fall-off at higher temperatures appears to be faster for than for With increasing temperature is approximately constant up to 100 K and then falls rapidly as . The decrease of near is consistent with increasing damping due to the thermal phase fluctuations arising from coupling with the lattice and quasiparticle excitations.
Quasiparticle response
Let us now turn to the transient (sub-picosecond) reflectivity signal, attributed to the photoinduced absorption from the photoexcited quasiparticles. The T-dependence of the amplitude of the reflectivity change and the rel. time, determined by the single exponential decay fit to the data, is presented in Fig.7.
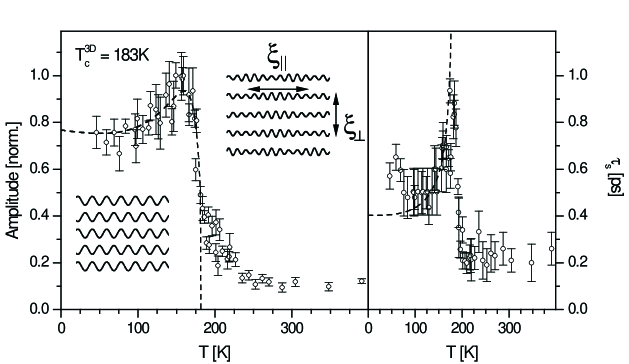
The amplitude of the PI transient has a pronounced temperature dependence shown in Figure 7a). Upon increasing the temperature, it first slightly increases, followed by a sharp drop at the second order phase transition to the 3D ordered CDW state at T. Above 183 K the amplitude gradually decreases to K, and remains constant above that temperature all the way up to the highest temperatures measured ( K). On the other hand, relaxation time is roughly constant far below T, shows a quasi-divergence when T is approached from below, and then drops to constant value of ps.
The -dependence of the photoinduced signal amplitude below has been fitted with Eq.(8). We have used a BCS functional form for the T-dependence of the gap consistent with the T-dependence of lattice distortions [23]. Plotting Eq.(8) as a function of temperature in Fig. 7a), we find that the amplitude obtained from the fits to the data agrees remarkably well with the model for : amplitude is nearly constant up to nearly 100 K, then increases slightly and then drops very rapidly near . Using the value of the dimensionless constant 10 (taking eV-1spin-1cell-1 [24], [32], and 1-5, since the gap magnitude is of the order of 0.1 eV [23]), we obtained the value of the gap K from the fit of Eq.(8) - in good agreement with other measurements [23, 24].
In contrast to the response of the collective modes, both of which disappear within 10-20 K below , the amplitude of the quasiparticle transient gradually drops up to nearly 250 K, and then remains constant up to 400 K. The polarization anisotropy of the signal above is the same as for [3], strongly suggesting that the origin of the signal above is the same as below i.e. photoexcited quasiparticles. The strong T-dependence of the amplitude above is inconsistent with the simple electron-phonon thermalization scenario that was found to explain the picosecond dynamics in metals [33, 5]. In fact, the peculiar T-dependence of the amplitude above is suggestive of some suppression in the electronic DOS, i.e. pseudogap, already above . We attribute the existence of the pseudogap in the excitation spectrum to the fluctuating presence of short range 3D segments as depicted schematically in Figure 7a). The 1D CDW correlations along the chains build up at temperatures far above (at room temperature the correlation length along the chains Å, exceeding the lattice constant). On the other hand, in the direction perpendicular to chains the correlation length is still smaller than the interchain separation, and the fluctuations are decoupled. Upon cooling, the interchain correlation length increases and at temperature exceeds the distance between two adjacent chains . Below this temperature the fluctuations have a 3D character with fluctuations on neighboring chains strongly coupled, giving rise to suppression in the DOS at EF. Indeed, x-ray data on K0.3MoO3 [34] seem to follow this scheme, suggesting (from the analysis of the Bragg pattern) that 3D fluctuations develop below K, i.e. at temperatures K above [34]. Our data support this picture and suggest that this crossover temperature is even higher, of the order of K.
The -dependence of the relaxation time is shown in Figure 7b). As appears to diverge and then drops to ps above . Such behavior is in agreement with the expected -dependence for the case of a mean-field like gap closing at . The dashed line in Figure 7b) shows a fit to the data using Eq.(9) with a BCS-like -dependent gap with K. Importantly, above the relaxation time is constant (within experimental accuracy), showing no gradual changes between and 250 K as observed in the T-dependence of the transient amplitude - Fig 7a). In fact the relaxation time is constant all up to 400K, where all the CDW fluctuations (even 1D) should be absent, and the dynamics is governed by electron-phonon thermalization. This gives further support for association of the gradual decrease in amplitude above to the fluctuating presence of short range segments with 3D order. Namely, if the gap was finite above and it was gradually decreasing above this should be evidenced as a gradual increase in the relaxation time (according to Eq.(9). Instead, the relaxation dynamics above is fast, determined by the fastest channel of relaxation - in this case electron-phonon thermalization in metallic regions.
5 Summary
We have presented a femtosecond time-resolved optical spectroscopy as a new experimental tool to probe the changes in the low energy electronic density of states in strongly correlated electron systems. We showed that the photoexcited carrier relaxation is strongly affected by the presence of a small energy gap in the density of states [1]. The gap creates a relaxation bottleneck increasing the typically 100 femtosecond relaxation time to picoseconds. By measuring changes in reflectivity or transmission of the suitably delayed probe optical pulse one probes the time evolution of the photoexcited carrier density. The amplitude and the relaxation time of the fast photoinduced transient strongly depends on temperature and the magnitude of the single particle gap. Therefore, by analyzing the T-dependences of the amplitude and relaxation time one can determine the magnitude and temperature dependence of the gap. Furthermore, since the effective shutter speed is on the order of a picosecond, the technique is particularly useful to probe the systems with (dynamic) spatial inhomogeneities.
We applied the femtosecond time-resolved spectroscopy to study a quasi 1D CDW semiconductor K0.3MoO3. A fast transient was found, whose amplitude and relaxation time showed anomalies at , concurrent with the opening of the Peierls gap. The amplitude of the fast transient shows an abrupt drop at Tc, whereas the relaxation time shows divergence at Tc in agreement with the theoretical model [1]. The amplitude of the single particle gap found from the fit to the data was found to be in agreement with the well established value of K [24]. Above Tc the fast signal amplitude drops gradually to a constant at K, which was attributed to the fluctuating presence of short range segments with 3D CDW order. In addition, amplitude mode reflectivity oscillations were observed in real time, whose frequency, and damping are in close agreement with frequency-domain measurements [26, 27]. A -dependent overdamped response is also observed and on the basis of the -dependence of its damping it is attributed to relaxation of the phason mode.
99
References
- [1] V.V. Kabanov, J. Demsar, B. Podobnik and D. Mihailovic, Phys. Rev. B 59, 1497 (1999).
- [2] D. Mihailovic and J. Demsar, in Spectrosopy of Superconducting Materials, Ed. Eric Faulques, ACS Symposium Series 730; The American Chemical Society: Washington, D.C., 1999, p. 230.
- [3] J. Demsar, K. Biljakovic, D. Mihailovic, Phys. Rev. Lett. 83, 800 (1999); see also recent work in the high excitation regime by A.A. Tsvetkov et al., Acta Physica Polonica B 34, 387 (2003).
- [4] J. Demsar, H. Berger, L. Forro, D. Mihailovic, Phys. Rev. B 66, 041101 (2002).
- [5] J. Demsar et al., Phys. Rev. Lett. 91, 027401 (2003).
- [6] R.D. Averitt et al., Phys. Rev. B 63, 140502 (2001).
- [7] R.D. Averitt et al., Phys. Rev. Lett. 87, 017401 (2001).
- [8] J. Demsar et al., Phys. Rev. Lett. 91, 267002 (2003); J. Demsar et al., Int. J. Mod. Phys. 17, 3675 (2003).
- [9] P. Gay et al., J. Low Temp. Phys. 117, 1025 (1999).
- [10] D.C. Smith et al., Physica C 341-348, 2219 (2000).
- [11] J. Demsar et al., Phys. Rev. B 63, 54519 (2001).
- [12] M.L. Schneider et al., Europhys. Lett. 60 460 (2002).
- [13] G.P. Segre et al., Phys. Rev. Lett. 88, 137001 (2002).
- [14] C.J. Stevens et al., Phys.Rev.Lett. 78, 2212 (1997).
- [15] S.G. Han, Z.V. Vardeny, O.G. Symko, G. Koren, Phys. Rev. Lett. 65, 2708 (1990).
- [16] J. Demsar et al., Europhys. Lett. 45, 381 (1999).
- [17] D. Dvorsek et al., Phys. Rev. B 66, 020510 (2002).
- [18] J. Demsar et al., Phys. Rev. Lett. 82, 4918 (1999).
- [19] A. Rothwarf, B.N. Taylor, Phys. Rev. Lett. 19, 27 (1967).
- [20] C.C. Tsuei and J.R. Kirtley, Rev. Mod Phys. 72, 969 (2000) and the references therein.
- [21] G.M. Eliashberg, Zh. Exsp. Theor. Fiz. 61, 1274 (1971), A.G. Aronov and B.Z. Spivak, J. Low Temp. Phys. 29, 149 (1977).
- [22] J.M. Ziman, Electrons and Phonons (Oxford University Press, London 1960), E.M. Lifshitz, L.P. Pitaevskii, Physical kinetics, (Butterworth-Heinemann ,Oxford, 1995).
- [23] G. Grüner, Rev.Mod.Phys. 60, 1129 (1988).
- [24] G. Grüner, Density Waves in Solids, (Addison-Wesley, 1994).
- [25] J. Graham and A.D. Wadsley, Acta Cryst. 20, 93, (1966).
- [26] J.P. Pouget et al., Phys. Rev. B 43, 8421 (1991).
- [27] G. Travaglini, I. Mörke, P. Wachter, Sol.State.Comm. 45, 289 (1983).
- [28] H.J. Zeiger et al., Phys. Rev. B 45, 768 (1992).
- [29] T.W. Kim et al., Phys. Rev. B 40, 5372 (1989).
- [30] E. Tutiš, S. Barišić, Phys. Rev.B 43, 8431 (1991).
- [31] L. Degiorgi et al., Phys.Rev.B 44, 7808 (1991).
- [32] H. Requardt et al., J.Phys.: Cond. Matt. 9, 8639 (1997).
- [33] P.B. Allen, Phys. Rev. Lett. 59, 1460 (1987).
- [34] S. Girault, A.H. Moudden, J.P. Pouget, Phys. Rev. B 39, 4430 (1989).