Network of Econophysicists: a weighted network to investigate the development of Econophysics
Abstract
The development of Econophysics is studied from the perspective of scientific communication networks. Papers in Econophysics published from 1992 to 2003 are collected. Then a weighted and directed network of scientific communication, including collaboration, citation and personal discussion, is constructed. Its static geometrical properties, including degree distribution, weight distribution, weight per degree, and betweenness centrality, give a nice overall description of the research works. The way we introduced here to measure the weight of connections can be used as a general one to construct weighted network.
Keywords: Econophysics, Complex Networks
1 Introduction
Econophysics is a new area developed recently by the cooperation between economists, mathematicians and physicists (See Refs. [1, 2, 3] as reviews). More and more researchers in finance take up statistical physics to explore the dynamical and statistical properties of financial data, including time series of stock prices and exchange rate and size of organizations. And also more and more physicists from statistical physics and complexity turn to working in finance, as an important research subject. It is interesting to investigate the corresponding research development in this new born scientific research area, to know the work status and to understand the idea transportation among scientists.
Actually scientific collaboration has already become an interesting subject for network research[4, 5]. So after collecting the data and giving some basic statistical results, we have constructed a network to study the idea communication in this area. Here we think all collaboration, citation, and personal discussion are the ways for idea transportation with different contributions. If we want to analyze this transportation as a whole we must use different weight to measure these different levels. So the network we constructed here is a weighted and directed one.
2 Database and Simple Statistical Results
Although there is still no clear definition of Econophysics, we just collected related works on the following three main topics among most researchers. The first one is fluctuation of stock prices, exchange rates, options and goods. The second is about firm sizes, distribution of personal wealth and income, and GDP. The last one is network analysis of economy, such as trade web, the import/outport relationship between countries and cities.
Econophysicists have found styled facts such as volatility clustering, nontrivial autocorrelation characters and the universal power law distribution in the time series of stock prices and exchange rates. Although disagreement on the styled facts of the firm size is still exist, some universal properties as the Laplace distribution of the return of size fluctuation have been verified by independent works. As for the money dynamics, both the empirical researches and the theoretical models are based on the traditional models in physics such as ideal gas. Therefore, although the new discipline has not been defined and accepted widely, from practical view, it’s not hard to discriminate all these works from traditional discussion in finance and from traditional physical models.
Concentrating on these three main topics, we started to collect papers from the three web sites listed below. 1.)Econophysics home page at http://www.econophysics.org. Almost complete paper list is created and maintained there, including papers published and preprinted. 2.)Econophysics at Physica A at http://www.elsevier.com/locate.econophys, where all papers published by Physica A are collected. 3.) ISI at http://isi.knowlege.com, the well known SCI information provider. We collected publish information of papers published from 1992 to 4/30/2003. Then we got them from the journals one by one. At last, we get 662 papers and totaly 556 authors from more than 20 journals. Then we extracted the times of three relationship between every two scientists from this data set to form a file of data record as (), which means author collaborated with author ‘’ times, cited ‘’ times of ’s papers and thanked ‘’ times in all ’s acknowledgements. Here we must mention that in order to keep our data set to be closed, we only counted the cited papers that have been collected by our data set and just selected the people in acknowledgements which are authors in our data set.
From the above database, we can get basic statistical results based on authors and papers.
2.1 Statistics on authors
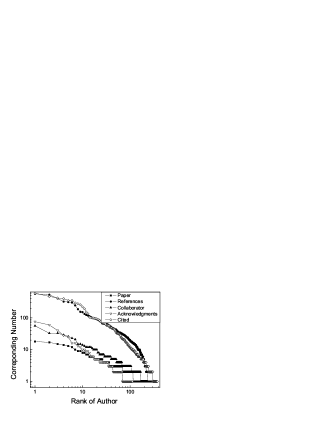
Every author has his/her own coauthors, papers, papers cited by his/her papers, papers citing his/her papers, and people in all his/her acknowledgements. All the statistical results are related to the important properties of the communication networks. We explored these distributions of the first author of each paper and show them in Zipf plot[6] as Fig. 2. In a Zipf plot, one sorts the object number in decreasing order, then a figure of value vs rank is plotted. This plot is equivalent to frequency counting but is more suitable for small database and doesn’t depend on the counting interval. The coauthor number of an author is the number of the different coauthors in all of his/her papers. Citation times of an author is defined by the summation of the number of references in all of his/her papers and the time being cited is the total number of papers in which his/her paper was cited. The acknowledgements here are thanks sending out by the author.
2.2 Statistics on papers
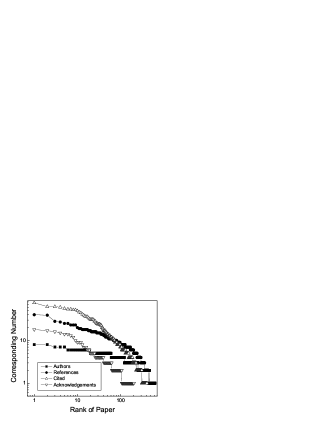
Every paper has its own authors, references, papers citing it and people in its acknowledgements. In this section, we also use Zipf plot to demonstrate such distributions. Number of authors, number of references, number of papers in which it was cited, number of people in its acknowledgements were plotted in Fig. 2. All citation and acknowledgements are counted within our data set. From Figs. 2 and 2, we can find most part is power law distribution[7], while they are usually truncated at high tail[8]. To get universal property, investigation on more data set is required.
3 Network Construction and Static Geometrical Properties
Using the author as vertex and communication among them as links, we can construct a scientific communication network. It is a weighted and directed network as discussed in Section 1. The weight of a link is converted from the times by the formula
| (1) |
in which, can only take value from . So is one of the three relationships—coauthor, citation or acknowledgement and is defined as
| (2) |
where is the times of relationship between and .
We think the weight will reach a limitation when the times exceeds some value. Therefore, we use the function as the weight function. We also assume the contributions to the weight from these three relations are different and they can be represented by the different values of , for which are used for in this paper. The thumb principle and the effect of different parameter values will be discussed in other paper.
At last, equation 1 is a weight of similarity, it is convenient to convert it into dissimilarity weight as
| (3) |
It’s timed by because the similarity weight and timing by will normalize .
3.1 Degree, weight and weight per degree
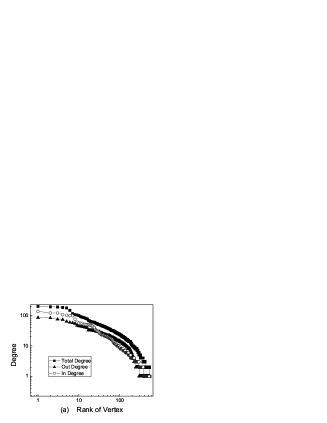
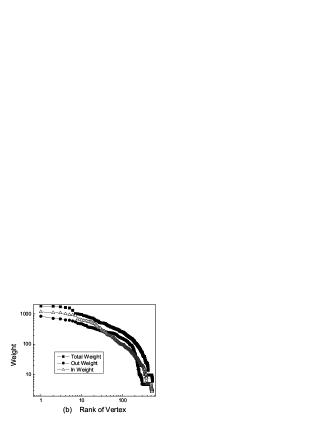
Since this scientists network is directed, we have three definitions of degree: out degree, in degree and total degree. And also three ones for weight. Fig. 3 shows all these distributions. Now we introduce another interesting quantity – weight per degree, which is the quotient of weight and degree. It also has three value, in, out and total. Fig. 4 shows their distributions. We think weight per degree is one of the inherent variables of vertex. It has some relations with the working style of scientists. Preferring to cooperate widely not deeply may lead to large weight per degree, while for other scientists maybe wish to cooperate with few people but more deeply and this result in small weight per degree. This quantity of a scientist can be calculated from a collection of all his/her papers. So it’s local and easy to be calculated. Maybe this quantity can be used as a measure of the working style of a scientist.

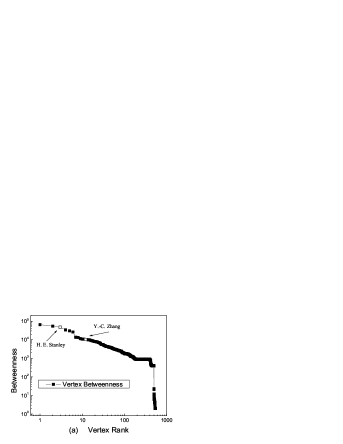
3.2 Betweenness centrality
Other important geometrical quantities for the network are given by average shortest distance and the vertex and link betweenness[9, 10]. Here in Fig. 5, we give vertex betweenness and link betweenness distributions. Betweenness describes the relative importance of a vertex or link in the communication in the network. A great betweenness implies it’s a key point for global communication.

4 Concluding Remarks
The development of a field is an excellent scientific object for researchers, especially the field is a new developing topic. It’s not very hard to record all the development for such topic, especially nowadays when we have almost complete list of all publications. From the point view of complex networks, such historical empirical research will definitely boost the new exploration in mechanism of networks. Let’s keep eyes on the development of Econophysics, both on the new research works and on the development itself.
The construction of weighted network, especially the way we introduced to measure the weight, is also helpful for the research on complex networks. Some further studies on this communication network, such as effect of different measurements, clustering coefficient and average distance for weighted network, and transportation efficiency have been done already. Similar discussion on a large database[4] is in progress. Results will be reported later.
We also wish such network analysis of development of Econophysics can also benefit Econophysics. Some centrality analysis of vertex reveals the relative scores of different researchers, and further works on communication structure will show the group structure and subject clustering information, and this maybe will imply some new related blank topics. Such exploration will be one of our next steps in network analysis of developing scientific fields.
Acknowledgements
The work is supported by National Natural Science Foundation of China under the Grant No. 70371072 and No. 70371073.
References
- [1] R. N. Mantegna and H. E. Stanley, An Introduction to Econophysics: Correlations and Complexity in Finance (Cambridge University Press, Cambridge, England, 1999).
- [2] D. Stauffer, Inter. J. Mod. Phys. C11, No6, 1081 (2000).
- [3] H.E. Stanley, L.A.N. Amarala, X. Gabaixb, P. Gopikrishnana, and V. Plerou, Physica, A299, 1 (2001).
- [4] M. E. J. Newman, Phys. Rev. E64, 016131-016132(2001).
- [5] A.-L. Barabsi, H. Jeonga, Z. Neda, E. Ravasz, A. Schubert and T. Vicsek, Physica, A311, 590 (2002).
- [6] R. L. Axtell, Science, 293, 1818(2001).
- [7] R.Albert and A.-L. Barabsi, Rev. Mod. Phys. 74, 47 (2002).
- [8] A. Dgulescu and V. M. Yakovenko, Physica, A299, 213(2001).
- [9] K.-I. Goh, E. Oh, B. Kahng and D. Kim, Phys. Rev. E74, 017101 (2003).
- [10] M. Girvan and M. E. J. Newman, PNAS, 99, 7821(2002).