Roughening of Fracture Surfaces: the Role of Plastic Deformations
Version of
Abstract
Post mortem analysis of fracture surfaces of ductile and brittle materials on the m-mm and the nm scales respectively, reveal self affine graphs with an anomalous scaling exponent . Attempts to use elasticity theory to explain this result failed, yielding exponent up to logarithms. We show that when the cracks propagate via plastic void formations in front of the tip, followed by void coalescence, the voids positions are positively correlated to yield exponents higher than 0.5.
Quantitative studies of fracture surfaces reveal self affine rough graphs with two scaling regimes: at small length scales (smaller than a typical cross-over length ) the roughness exponents , whereas at scales larger than the roughness exponent is . Such measurements were reported first for ductile materials (like metals) where is of the order of 1 m 84MPP ; 97B , and more recently for brittle materials like glass, but with a much smaller value of , of about 1 nm 03C . The exponent is characteristic of uncorrelated random walks, but higher exponents indicate correlated steps Feder ; naturally the experimental discovery of such correlated, “anomalous” exponents attracted considerable interest with repeated attempts to derive them theoretically. Up to now these attempts were based on elasticity theory and have failed to underpin the mechanism for correlated fracture steps. For realistic boundary conditions, i.e. mode I or mode II fracture, these attempts invariably ended up with logarithmic roughening 97REF or with the random walk scaling exponents 02BLP .
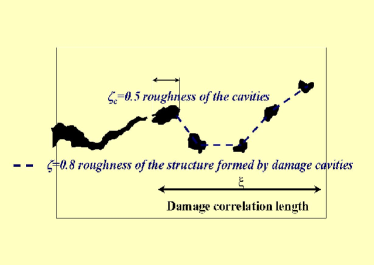
In this Letter we present a quantitative model for ductile fracture in an infinite 2-dimensional material that follows the qualitative picture presented recently in 99BP , see Fig.1. In this picture there exists a “process zone” in front of the crack tip in which plastic yield is accompanied by the evolution of damage cavities. A crucial aspect of this picture is the existence of a typical scale, , which is roughly the distance between the crack tip and the first void, at the time of the nucleation of the latter. The voids are nucleated under the influence of the stress field adjacent to the tip, but not at the tip, due to the existence of the plastic zone that cuts off the purely linear-elastic (unphysical) crack-tip singularities. The crack grows by coalescing the voids with the tip, creating a new stress field which induces the nucleation of new voids. In the picture of 99BP the scale is also identified with the typical size of the voids at coalescence. A consequence of this picture is that the roughening exponent corresponds to the surface structure of individual voids, whereas the exponent has to do with the correlation between the positions of different voids that coalesce to constitute the evolving crack. To dress this picture with quantitative content we need first to provide a theory for the scale and, second, to demonstrate that the positions of consecutive voids are positively correlated. These are the main goals of this Letter.
A simple model for can be developed by assuming the process zone to be properly described by the Huber-von Mises plasticity theory 90Lub . This theory focuses on the deviatoric stress and on its invariants. The second invariant, , corresponds to the distortional energy. The material yields as the distortional energy exceeds a material-dependent threshold . In 2-dimensions this yield condition reads 90Lub
| (1) |
Here are the principal stresses given by
| (2) |
In the purely linear-elastic solution the crack-tip region is where high stresses are concentrated (in fact diverging near a sharp tip). Plasticity implies on the one hand that the tip is blunted, and on the other hand that inside the plastic zone the Huber-von Mises criterion (1) is satisfied. The outer boundary of the plastic zone will be called below the “yield curve”, and in polar coordinates around the crack tip will be denoted .
Whatever is the actual shape of the blunted tip its boundary cannot support normal components of the stress. Together with Eq. (1) this implies that on the crack interface
| (3) |
On the other hand, the linear-elastic solution, which is still valid outside the plastic zone, imposes the outer boundary conditions on the yield curve. Below we will compute the outer stress field exactly for an arbitrarily shaped crack using the recently developed method of iterated conformal mappings 03BMP . For the present argument we will take the outer stress field to conform with the universal linear-elastic stress field for mode I symmetry,
| (4) |
where for a crack of length with being the tensile load at infinity, the stress intensity factor is expected to scale like . Using this field we can find the yield curve . Typical yield curves for straight and curved cracks are shown in the insets of Figs. 3 and 6.
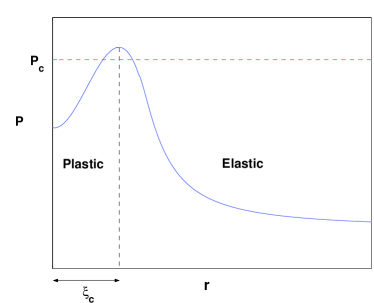
The typical scale follows from the physics of the nucleation process. We assume that void nucleation occurs where the hydrostatic tension , Tr, exceeds some threshold value . Other assumptions on the nature of the nucleation process will not affect qualitatively our main result. The hydrostatic tension increases when we go away from the tip and reaches a maximum near the yield curve. To see this note that on the crack surface (cf. Eq. (3)). On the yield curve we use Eq. (4) and the Huber-von Mises criterion together to solve the angular dependence of the hydrostatic tension in units of . It attains a maximal value of and is considerably higher than for a wide range of angles. On the other hand the linear-elastic solution (4) implies a monotonically decreasing outside the yield curve. We thus expect to attain its maximum value near the yield curve. This conclusion is fully supported by Finite Element Method calculations, cf. 85AM . Finally, since the nucleation occurs when exceeds a threshold , this threshold is between the limit values found above, i.e. . The first void will thus appear at a typical distance as shown in Fig. 2. An immediate consequence of the above discussion is that is related to the crack length via
| (5) |
It is worthwhile to put this prediction to experimental test.
Naturally, the precise location of the nucleating void will experience a high degree of stochasticity due to material inhomogeneities. In our model below we will assume that the nucleation can occur randomly anywhere in the region in which with a probability proportional to .
The simplest possible crack propagation model is obtained if we assume that a void is nucleated and then the crack coalesces with the void before a new void is nucleated. In experiments it appears that several voids may nucleate before the coalescence occurs 99BP ; 03Cil , but we will demonstrate that already a one void model induces positive correlations between consecutive void nucleations, leading eventually to an anomalous roughness exponent larger than 0.5. Clearly, even this simple model requires strong tools to compute the stress field around an arbitrarily shaped crack, to determine at each stage of growth the location of the yield curve and nucleating randomly the next void according to the probability distribution discussed above. In a recent work we have developed precisely the necessary tool in the form of the method of iterated conformal mappings 03BMP .
In the method of iterated conformal mappings one starts with a crack for which the conformal map from the exterior of the unit circle to the exterior of the crack is known. (Below we start with a long crack, in the form of a mathematical branch-cut of length 1000 in units of ). We can then grow the crack by little steps in desired directions, computing at all times the conformal map from the exterior of the unit circle to the exterior of the resulting crack. Having the conformal map makes the exact calculation of the stress field (for arbitrary loads at infinity) straightforward in principle and highly affordable in practice. The details of the method and its machine implementations are described in full detail in 03BMP . We should just stress here that the method naturally grows cracks with finite curvature tips, and each step adds on a small addition to the tip, also of a finite size that is controlled in the algorithm.
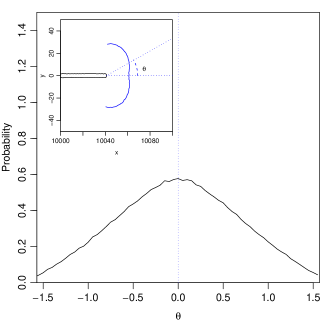
Having the stress field around the crack we can readily find the yield curve, and the physical region in its vicinity where a void can be nucleated (naturally, the width of this region depends on the critical value which is a parameter of the algorithm, as is). Choosing with probability the position of the next void, we use this site as a pointer that directs the crack tip. Fig. 3 shows a typical yield curve and the corresponding probability distribution function () on this curve for a straight crack. The distribution is symmetric and wide enough to allow for deviations from the forward direction.
We then use the method of iterated conformal mappings to make a growth step to coalesce the tip with the void. Naturally the step sizes are of the order of . Thus the radius of curvature at the tip is also of the order of . We note that this model forsakes the details of the void structure and all the lengthscales below . This is clearly acceptable as long as we are mainly interested in the scaling properties on scales larger than .

In Fig. 4 we present a typical crack that had been grown using this method. The positive correlation between successive void nucleation and coalescence events is obvious even to the naked eye. Once the crack steps upward, there is a high probability to continue upward, and vice versa. This is precisely the property that we were after. A quantitative measurement of this tendency is the roughening exponent, that we compute as follows. Measuring the height fluctuations in the graph of the crack, one defines according to
| (6) |
For self-affine graphs the scaling exponent is defined via the scaling relation
| (7) |
In Fig. 5 we present a log-log plot of vs. , with a best power-law fit of . Indeed as anticipated from the visual observation of Fig. 4 the exponent is higher than 0.5.

We note that our measured scaling exponent is still smaller than the experimental one which is around 0.8. First let us say right away that we do not expect in a 2-dimensional theory to hit a 3-dimensional exponent; scaling exponents are usually strongly -dependent even when the physics is invariant to the dimensionality of space. In addition, we expect that a more detailed model which incorporates a simultaneous multi-void nucleation and coalescence would increase the positive correlation in the positions of consecutive voids, and thus would reduce the roughness of the surface (increase the scaling exponent).
The main points of the model are nevertheless worth reiterating. First, we have a new typical scale, , which is crucial. Growing directly at the tip of the crack results in a very strong preference for the forward direction, meaning that a step up will most likely be followed by a step down, and vice versa, as shown in 02BLP .
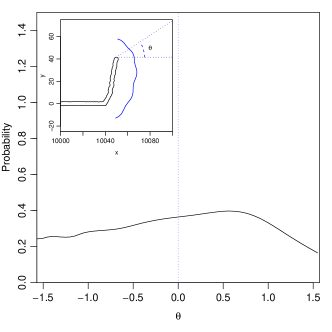
The introduction of the physics of the plastic zone results in creating a finite distance away from the tip to realize the next growth step. Second, a growth in the upward (or downward) direction is affecting the next stress field such as to bias the next growth step to be correlated with the last one. To see this clearly we present in Fig. 6 the yield curve and the corresponding probability distribution function () on this curve for a long straight crack followed by an upward turn. It is clear that the distribution is skewed in favor of positive angles with respect to the forward direction. When the crack grows further this tendency becomes more pronounced. This is the essence of the positive correlation mechanism.
To improve our model further one needs to solve exactly for the stress field around a crack and a single void ahead. This will allow the introduction of two voids in the physically required places. Such an improved model, which is presently under construction, calls for mapping conformally doubly connected regions; we expect such a model to lead to stronger positive correlations between growth steps and to a higher scaling exponent.
References
- (1) B.B. Mandelbrot, D.E. Passoja and A.J. Paullay, Nature 308, 721 (1984).
- (2) E. Bouchaud, J. Phys. Condens. Matter 9, 4319 (1997).
- (3) F. Célarié, S. Prades, D. Bonamy, L. Ferrero, E. Bouchaud, C. Guillot and C. Marlière, Phys. Rev. Lett. 90, 075504 (2003).
- (4) J. Feder, Fractals, (Plenum, New York, 1988).
- (5) S. Ramanathan, D. Ertas, and D. S. Fisher Phys. Rev. Lett. 79, 873 (1997).
- (6) F. Barra, A. Levermann and I. Procaccia, Phys. Rev. E 66, 066122 (2002).
- (7) E. Bouchaud and F. Paun, Comput. Sci. Eng., September/October, 32 (1999).
- (8) S. Ciliberto, Private Communication, December 2003.
- (9) J. Lubliner, Plasticity Theory, (Macmillan, New York, 1990).
- (10) E. Bouchbinder, J. Mathiessen and I. Procaccia, “Stress field around arbitrarily shaped cracks in two-dimensional elastic materials”, Phys. Rev. E, In press. Also:cond-mat/0309523.
- (11) N. Aravas and R.M. McMeeking, J. Mech. Phys. Solids 33, 25 (1985).