The Hierarchical Backbone of Complex Networks
Abstract
Given any complex directed network, a set of acyclic subgraphs — the hierarchical backbone of the network — can be extracted that will provide valuable information about its hierarchical structure. The current paper presents how the interpretation of the network weight matrix as a transition matrix allows the hierarchical backbone to be identified and characterized in terms of the concepts of hierarchical degree, which expresses the total number of virtual edges established along successive transitions, and of hierarchical successors, namely the number of nodes accessible from a specific node while moving successive hierarchical levels. The potential of the proposed approach is illustrated with respect to word associations and gene sequencing data.
pacs:
89.75.Fb, 02.10.Ox, 89.75.Da, 87.80.TqAlthough the study and characterization of complex networks (e.g. Albert and Barabási (2002); Newman (2003)) has often relied on simple measurements such as the average node degree, clustering coefficient and average length, such features do not provide direct insights about several relevant properties of the analyzed networks. While such limitations have been acknowledged from time to time and complementary measures have been duly proposed in the literature, including the connectivity correlation Pastor-Satorras et al. (2002) and betweeness centrality Goh et al. (2001), relatively lesser attention has been given to measurements or algorithms capable of comprehensively expressing the hierarchical structure of complex networks, and only more recently attention has been focused on their hierarchy Ravasz and Barabási (2003); Ravasz et al. (2002); Caldarelli et al. (2003); Barabási et al. (2004); Trusina et al. (2003); Boss et al. (2003); Barthélemy et al. (2003); Zhou (2003); Vázquez (2003); Steyvers and Tenenbaum (2003). Indeed, even if such networks often involve cycles, their hierarchical structure can be identified and characterized in terms of concepts such as the hierarchical successors and hierarchical degrees, herein introduced. The present work concentrates on directed, weighted complex networks (digraphs), illustrating the potential of the suggested concepts and algorithms with respect to complex networks derived from word association psychophysical experiments and gene sequencing in zebrafish. It is argued that the hierarchical degree density represents a natural extension of the classical node degree density, being capable of providing additional information about the network hierarchy and connectivity.
Let the complex weighted directed network (or digraph) be represented in terms of its nodes , and the directed edges expressed as pairs , with respective weights , which can be represented into the weight matrix as . Self-connections are not considered in this work. Let be the operator acting elementwise over its argument — which can be a scalar, vector or matrix — in such a way that to each resulting element is assigned the value one whenever the respective element of has absolute value larger than the specified threshold ; for instance, . Thus, the adjacency matrix underlying the complex network can be expressed as . The indegree of node in such a complex network corresponds to the total weight of incoming edges, and the outdegree to the total weight of outgoing edges. If the operator acts over a matrix as given by Equation 1, the hierarchical successors of node reached along transitions from the initial state correspond to the non-zero entries of the vector calculated as in Equation 2, where has all elements zero except the element, which is set to . The successors of reached exactly at the transition can be therefore determined by Equation 3. The number of successors, without repetitions, of node at , hence , provides valuable information about the ramifications of the network along its hierarchical levels . For instance, if the network is a complete branching tree with branches at each fork, the root node leads to , i.e. a power-law. Even for a network containing cycles, the successors of each of its constituent nodes will have a finite maximum depth defined as the value of such that . The nodes identified by non-zero elements of , together with the edges between them, define a subgraph of which is henceforth called the k-component of , whose number of nodes is denoted by .
| (1) | |||
| (2) | |||
| (3) |
Given any k-component of , it is possible to obtain a respective acyclic graph 111A network is said to be acyclic iff it contains no cycles., henceforth called the k-th hierarchical component of , by using the following algorithm:
| Inc | lude all nodes reachable from after one transition | ||
| into the set , and store the respective outgoing edges | |||
| of into the new adjacency matrix ; | |||
| Remove all incoming edges to ; | |||
| Whi | le is not empty | ||
| Remove all edges between the elements in ; | |||
| For | each element of , in any order: | ||
| Incl | ude all nodes reachable from after one | ||
| transition into the set , incorporating | |||
| the outgoing edges of into the new | |||
| adjacency matrix ; | |||
| Remove all incoming edges to ; | |||
| Do ; |
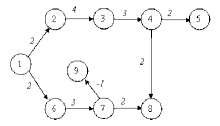
The weight matrix of the acyclic graph is now given as , where ‘’ is the elementwise product between two matrices. The set of such acyclic subgraphs , is henceforth understood as the hierarchical backbone of the complex network . Since the network produces hierarchical components, some criterion can be used to identify those most significant, such as the largest number of nodes. It is now possible to define the hierarchical outdegree of each node of at the transition , hence , as the sum of the weights of the virtual edges established between and any other nodes of exactly at that instant. As the existence of a virtual link from node to is understood to occur whenever , as illustrated in Figure 1, the hierarchical degree of in can therefore be obtained from Equation 4. The cumulative hierarchical degree of node after t-transitions, hence , is given by Equation 5. It is suggested in this paper that the hierarchical degree, as well as its cumulative version, provide a natural and powerful extension of the traditional concept of node degree (which coincides with ), capable of providing more comprehensive information about the hierarchical and connectivity properties of the graph topology. Observe that the number of nodes in the subgraph can be calculated as in Equation 6. Figure 2 shows a simple network (a) and its hierarchical components and .
| (4) | |||
| (5) | |||
| (6) |
The hierarchical degree of a node for a specific can also be understood as the traditional degree of that node in an augmented network including all virtual connections established along the successive interactions. The adjacency matrix of such an enlarged network can be calculated as .


(a)
(b) (c)
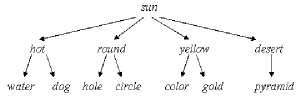
In order to illustrate the potential of the above proposed concepts and algorithms for hierarchical characterization of complex networks, they have been applied to experimental data for word associations da F. Costa (2003) and zebrafish gene sequencing. In the word associations experiment, a graph was obtained for a human subject through a psychophysical experiment as described in da F. Costa (2003). Starting with the word sun, the subject was requested to enter the first word that came to his mind after reading the program-supplied word. Except for the first word, all other words presented by the program are drawn from those previously supplied by the subject. Statistical methods are applied so as to ensure that every considered word is presented a similar number of times. A typical sequence obtained by this experiment is: sun round; round circle; sun gold; gold yellow; .
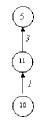
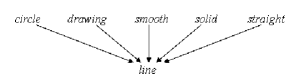
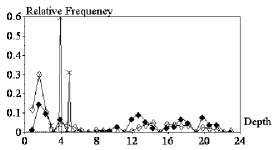
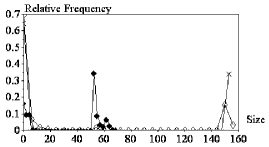
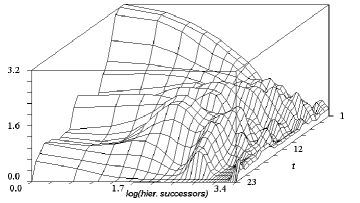
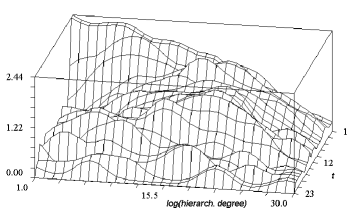
Once a large number of such associations are obtained (1930 in the considered experiment), a weighted directed graph is determined by representing each of the words (250 for this experiment) as nodes and the number of specific associations between two words as an edge between the respective nodes, weighted by the number of associations. Provided the outgoing weights are normalized, this type of graph can be understood as a Markov chain. It is suggested that this graph provides interesting information about the tendencies of the subject to associate words and concepts, paving the way to a series of possibilities such as the identification, from the respective network topological properties, of the author of the associations. As the node indegrees in such a graph were found previously da F. Costa (2003) to follow a power law, the transposed weight matrix is also considered in this work. In addition, as the topology of a network can be severely modified by addition of an incorrect edge (e.g. an eventual mistake while making the associations), the graph obtained from that experiment was thresholded such that only edges with weight larger than one were considered, yielding the weight matrix . The maximum total cluster size, i.e. was obtained for the initial word, i.e. sun, whose derived hierarchical structure is shown in Figure 3(a), which is not the same as the word sky corresponding to the maximum traditional degree. Such results reflect the fact that, by appearing soon at the beginning of the experiment, this word implied a larger number of indirectly related words along the rest of the experiment, even though the words were presented with similar frequencies. A maximum cluster size of 154 was obtained for the inverted associations, corresponding to the word line, as illustrated in Figure 3(b). Interestingly, despite such a trend toward hierarchy, the obtained graph also incorporate several cycles defined between different hierarchical levels (see da F. Costa (2003)), which were duly eliminated in the present investigation. The plots of relative frequencies showing the hierarchical depths and the cluster sizes are shown in Figure 4. The dilog plot of the densities obtained for the number of hierarchical successors and hierarchical degree considering all nodes in the backbone and are shown in Figure 5(a-b).
(a)
(b)
(a)
(b)
(a)
(b)
The other experimental data considered in this paper regards zebrafish
(Brachydanio rerio) gene sequencing data, obtained from the
NIH Zebrafish Gene Collection repository NIH (file
dr_mgc_cds_aa.fasta). The raw data consisted of sequences of
aminoacid for the first 892 genes in that file, which were organized
into subsequent pairs and the number of successive occurrences of such
pairs were calculated and used to build a complex weighted network,
which included 400 nodes ( aminoacids) and 112582 sequential
associations. The weight matrix was thresholded at 5000. The
obtained depth and cluster size densities are shown in
Figure 4(a) and (b). The maximum cluster was obtained
for 147 nodes, which formed a densely connected cluster. The node
leading to the maximum cumulative hierarchical degree
corresponded to the aminoacid pair QK, i.e. glycine and lysine.
It is clear from the depth density plot in Figure 4(a) that the direct and inverted word associations led to similar profiles characterized by wide distribution of depths, while the gene sequencing data implied a small number of depth values, with a peak at 4. This fact is explained by the similar weights for the aminoacid pair associations, which produced an abrupt transition of the connectivity of that graph as the threshold was raised. The higher density of shallow nodes (i.e. with depth between 0 and 4) observed for the inverse word associations indicates the fact that shorter streams of associations were established with the words entered by the subject at the last stages of the experiment. Interestingly, several words were characterized by long streams of associations. The size density plot in Figure 4(b) shows an interesting high density of cluster sizes between 50 and 60. This fact is possibly explained by the fact that one of such clusters acts as an attractor to several of the network nodes. A large cluster was obtained for the inverse word associations, which reflects the asymetric nature of the underlying graph. A large peak was observed for the gene sequences which, considered jointly with Figure 4(b), corroborates the fact that most nodes in this case are accessible through a few hierarchical levels. It is observed from Figure 5 (a) that the hierarchical degree tends to produce peaks at specific hierarchical levels , indicating the presence of bottlenecks along the network. While the number of small valued hierarchical successors tend to decrease with , the opposite behavior is observed for the larger numbers. The hierarchical degree shown in Figure 5(b) presents a rich structure indicating that this measure tends to vary considerably with .
In summary, it has been shown that the hierarchical underlying structure of complex networks provide valuable information about its topology that can not be fully appreciated by considering traditional measurements. The proposed decomposition of the network into maximal hierarchical components, as well as the concepts of hierarchical successors and hierarchical degree, allowed a more comprehensive characterization of the hierarchical structure of complex networks. It is expected that such tools will complement the characterization of complex networks possibly incorporating strong hierarchical backbone, such as the internet, metabolic networks, linguistic and social and economical systems.
Acknowledgements.
The author is grateful to FAPESP (proc. 99/12765-2) and CNPq (proc. 301422/92-3) for financial support.References
- Albert and Barabási (2002) R. Albert and A. L. Barabási, Rev. Mod. Phys. 74, 47 (2002).
- Newman (2003) M. E. J. Newman, SIAM Review 45, 167 (2003), cond-mat/0303516.
- Pastor-Satorras et al. (2002) R. Pastor-Satorras, A. Vásquez, and A. Vespignani (2002), cond-mat/0105161.
- Goh et al. (2001) K. I. Goh, B. Kahng, and D. Kim (2001), cond-mat/0106565.
- Ravasz and Barabási (2003) E. Ravasz and A. Barabási, Phys. Rev. E (2003), cond-mat/0206130.
- Barabási et al. (2004) A. Barabási, Z. Dezsö, E. Ravasz, S.-H. Yook, and Z. Oltvai (2004), to appear in Sitges Proceedings on Complex Networks, 2004.
- Caldarelli et al. (2003) G. Caldarelli, R. Pastor-Satorras, and A. Vespignani (2003), cond-mat/0212026.
- Trusina et al. (2003) A. Trusina, S. Maslov, P. Minnhagen, and K. Sneppen (2003), cond-mat/0308339.
- Boss et al. (2003) M. Boss, H. Elsinger, M. Summer, and S. Thurner (2003), cond-mat/0309582.
- Barthélemy et al. (2003) M. Barthélemy, A. Barrat, R. Pastor-Satorras, and A. Vespignani (2003), cond-mat/0311501.
- Zhou (2003) H. Zhou, Phys. Rev. E 67, 061901 (2003), cond-mat/0301032.
- Ravasz et al. (2002) E. Ravasz, A. L. Somera, D. A. Mongru, Z. N. Oltvai, and A. L. Barabási, Science 297, 1551 (2002), cond-mat/0209244.
- Vázquez (2003) A. Vázquez, Phys. Rev. E 67, 056104 (2003), cond-mat/0211528.
- Steyvers and Tenenbaum (2003) M. Steyvers and J. B. Tenenbaum (2003), cond-mat/0110012.
- da F. Costa (2003) L. da F. Costa (2003), cond-mat/0309266.
- (16) NIH, Zebrafish gene collection, http://zgc.nci.nih.gov/.