Vibrational signature of broken chemical order in a GeS2 glass: a molecular dynamics simulation
Abstract
Using density functional molecular dynamics simulations, we analyze the broken chemical order in a GeS2 glass and its impact on the dynamical properties of the glass through the in-depth study of the vibrational eigenvectors. We find homopolar bonds and the frequencies of the corresponding modes are in agreement with experimental data. Localized S-S modes and 3-fold coordinated sulfur atoms are found to be at the origin of specific Raman peaks whose origin was not previously clear. Through the ring size statistics we find, during the glass formation, a conversion of 3-membered rings into larger units but also into 2-membered rings whose vibrational signature is in agreement with experiments.
pacs:
PACS numbers: 61.43.Bn,61.43.Fs,71.15.Pd,63.50.+x1 INTRODUCTION
Dynamical properties of germanium disulfide glasses have been
extensively studied in the last two decades using Raman
and InfraRed (IR) spectroscopy
[1, 2, 3, 4, 5, 6]. However, the
analysis of these experimental results can be extremely complicated and
the determination of the origin of the vibrational modes observed in Raman
and IR spectra can therefore be hypothetical [4, 5, 6].
Theoretical calculations based on molecular dynamics simulations can be a
very interesting tool in order to eliminate these uncertainties since
they allow the atomic displacements at the origin of each vibrational
mode to be investigated. However, the importance of charge transfers in
chalcogenide glasses [7] such as GeS2 requires the use of an
ab-initio model which can be extremely costly in time if the size of
the system is not relatively small. In a previous study we have investigated
a glassy GeS2 sample containing 96 particles [8],
using a non self-consistent ab-initio code based on the
Sankey-Niklewski scheme called FIREBALL [9].
The good agreement of the results with
the available experimental data showed the excellent quality of this model
for the study of chalcogenide systems. However, the relative small size of
the sample did not allow a great variety of structural defects
inherent to amorphous systems and made a statistical determination
of the broken chemical order in g-GeS2 difficult.
Experimental spectroscopic studies
of these glasses [4] have shown in addition that the structural
disorder manifests itself clearly in the vibrational properties of
germanium disulfide glasses and it is therefore interesting to directly
investigate the origin of the corresponding vibrational modes.
Here we propose a study of a larger sample (258 particles) of glassy GeS2
using the same model, in order to study the statistics of the broken chemical
order of these materials, and to analyze in detail the
vibrational properties of amorphous GeS2 at ambient temperature.
In section II we will briefly present the model which has been used (more
details can be found in the original paper [9]). Subsequently,
we will describe the structural disorder of our amorphous sample at
short- and medium-range in section III. In section IV we will present a
detailed study of the vibrational properties of the system in order to
understand which atomic displacements are responsible of the modes present
in the Vibrational Density of States (VDOS). Finally in section V we will
summarize the major conclusions
of our work.
2 MODEL
The code we have used is a first-principles type molecular-dynamics program
called FIREBALL96, which is based on the local orbital electronic structure
method developed by Sankey and Niklewski [10]. The foundations of
this model are Density Functional Theory (DFT) [11] within the
Local Density Approximation (LDA) [12], and the non-local
pseudopotential scheme [13]. The use of the non-self-consistent
Harris functional [14], with a set of four atomic orbitals
(1 and 3) per site that vanish outside a cut-off radius of
(2.645 Å) considerably reduces the CPU time.
As said earlier, this model has given excellent results for many different
chalcogenide systems over the last ten years [8, 15, 16].
In the present work, we have melted a -GeS2 crystal containing
258 atoms in a cubic cell of 19.21 Å at 2000K for 60 ps
(24000 timesteps) in order
to obtain an equilibrium liquid system (standard periodic boundary conditions have been used).
We have then quenched our sample at a quenching
rate of 6.8*1014 K/s through the glass transition (the simulated glass
transition temperature is close to 1200 K). Finally we have relaxed this system at ambient
temperature for 600 ps.
The results shown in this article have been averaged over this period.
3 STRUCTURAL DISORDER
The broken chemical order of amorphous systems can be revealed through a detailed study of
short- and medium-range order in the structure of the sample.
The study of the radial pair correlation function g(r) defined as
| (1) |
for a given pair, is a standard way in order to reveal
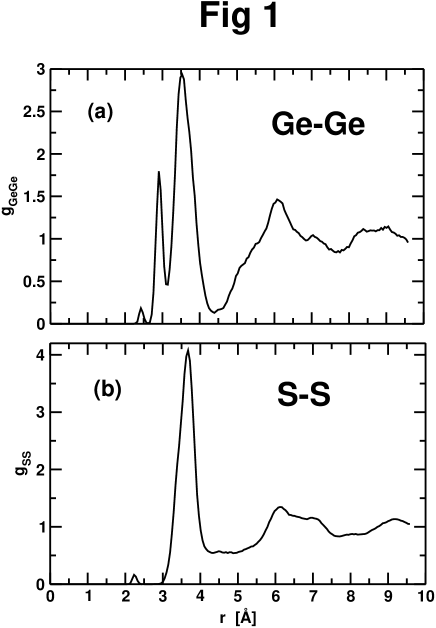
the existence of bond defects in glassy samples. We report in Fig.1 the
results obtained for pairs of the same nature: Ge-Ge and S-S. The peaks
corresponding to second neighbour distances, at
3.64 Å for S-S pairs, and at 2.91 Å and 3.41 Å for Ge-Ge pairs
(depending of whether the intertetrahedral connections are edge or corner-sharing),
have already been analyzed in our previous work on the small sample
[8] (in addition to the g(r) for the Ge-S pairs that does not
change significantly in the large sample).
However in the 258-particle sample, we observe in both graphs a small peak
at short distances (2.42 Å for Ge-Ge pairs and 2.23 Å for S-S pairs),
corresponding to nearest-neighbour bonds. These peaks indicate the presence
of homopolar bonds, albeit in small quantities, in amorphous GeS2 at
ambient temperature. Several studies have been done on this topic, and
recently two experimental studies have yielded conflicting results
concerning the presence or not of homopolar bonds in stoichiometric
glassy GeS2 [17, 18]. Contrarily to Cai et al. who used
Raman scattering [17], Petri et found no
evidence for such bonds in g-GeS2 in a neutron diffraction study
[18]. It should be noted that the small concentration of these bonds,
as we see them in our simulation, could explain why they can not be detected
in the experimental structure factor since their effect is not strong enough to be
clearly distinguished.
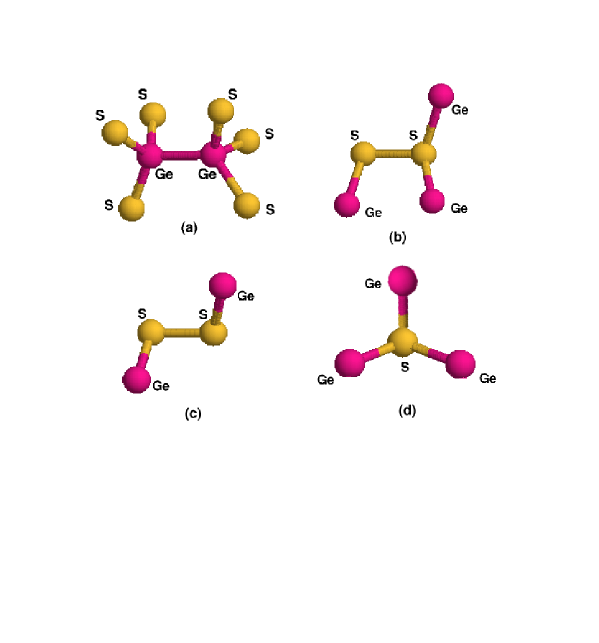
The Ge-Ge homopolar bonds appear in ethane-like units, where
each germanium is linked to another germanium and to three sulfur atoms.
An illustration of this kind of structural unit is
shown in Fig.2(a). The S-S bonds as we see them in our simulation can
appear in two ways: either one of the sulfur atom is non-bridging (linked to one
germanium Fig.2(b)), or both are non-bridging (Fig.2(c)). In both cases
the S-S bond length is 2.26 Å. We have found no S-S bonds containing
two bridging sulfur atoms.
The structural disorder can also appear between atoms of different nature,
when the number of first neighbours of a given particle is different from
what we can expect in a crystal. In stoichiometric -GeS2, one
Ge atom is linked to four S atoms, and each S atom is linked to two Ge atoms.
The “ideal” corresponding amorphous system is then a glassy network of
GeS4 tetrahedra, linked together by one or two S atoms depending on the
type of connection between the tetrahedra. A tetrahedron which is involved
in an edge-sharing link is called an edge-sharing tetrahedron, and their
presence can be experimentally detected using high-resolution neutron
diffraction measures. In our simulation we find that 46 of the tetrahedra
are edge-sharing in glassy GeS2, which is extremely close to the experimental value
of 44 determined by Bychkov et al.[6].
The broken chemical order can also be seen at short length scales through the
analysis of the bond defects of the amorphous sample. If we study the sulfur atoms of our
system, we find that only 68 of them are ”correctly” linked to two Ge atoms
(the Ge-S bond length is 2.23 Å (experiment: 2.21 Å[19])).
We find that 14.53 of them are connected to only one Ge atom,
and are therefore called terminal sulfur (or non-bridging). The interatomic distance
becomes then smaller than usual, and reaches the value of 2.12 Å. This decrease in
the bond length, whether the sulfur atoms are bridging or non-bridging has been
studied experimentally and theoretically and similar results have been
found [20, 21, 22].
The reduced coordination of the sulfur atoms is balanced by the presence of
13.95 of 3-fold coordinated sulfur, which are connected
to three germanium atoms instead of two (Fig.2(d)).
In these configurations, the bond length increases to 2.29 Å. All these values are reported in Table I.
| TABLE I. First neighbours of the S atoms in a g-GeS2 system containing 258 particles | |||
| S | |||
| No. of first Ge neighbours | Amount | Percentage | Bond length |
| 1 | 25 | 14.53 | 2.12 Å |
| 2 | 117 | 68 | 2.23 Å |
| 3 | 24 | 13.95 | 2.29 Å |
| Homopolar bonds S-S | 6 | 3.52 | 2.26 Å |
| Coordination number | ntot=2.005 | nGe=1.97 | nS=0.035 |
If we now focus on the germanium atoms, we see that 95.36 of
them are found in usual GeS4 tetrahedra, with four nearest S neighbours.
Only 1.16 of the Ge atoms are involved in Ge(S units and 1.16 in
Ge(S units. We can therefore say that the bond defects in g-GeS2
are more specific to the sulfur atoms, since the coordination of germanium is
extremely close to that of crystalline -GeS2.
It can be seen that the Ge-S bond length increases in Ge(S and Ge(S
units, and reaches the value of 2.43 Å (Table II).
TABLE II. First neighbours of the Ge atoms
in a g-GeS2 system containing 258 particles
Ge
No. of first neighbours S
Amount
Percentage
Bond length
2
1
1.16
2.43 Å
3
1
1.16
2.43 Å
4
82
95.36
2.23 Å
Homopolar bonds Ge-Ge
2
2.32
2.42 Å
Coordination number
ntot=3.953
nS=3.93
nGe=0.023
An alternative way to analyze the chemical order at medium range can
be obtained through the ring size statistics. We define the size of a ring as the
number of germanium atoms present in the shortest closed path of alternating
Ge-S bonds. Therefore a -membered ring consists of alternating Ge-S bonds.
In crystalline -GeS2, the ring size can only be equal to 2 or 3.
Their respective proportion is 1:2, which means that 33
of them are 2-membered rings and 66 of them are 3-membered rings. However, in amorphous
g-GeS2, these rings may have more variable sizes, and their statistics is a signature of
medium range disorder. We report in Table III the respective amount and percentage
of rings for =2,….,8 in our glassy sample (no -membered ring
with was found in our 258-particles system).
We note that the percentage of 2-membered rings (38) is extremely close to that of
crystalline -GeS2. However, many 3-membered rings
have disappeared in the amorphous structure, to become -membered rings, with
and . These units were probably broken during the
process that led to the glassy structure, allowing for the formation of mainly
larger-sized rings. To our knowledge, neither experimental results nor other
simulation data have been published on the ring size statistics in
g-GeS2.
| TABLE III. Ring statistics in a g-GeS2 system containing 258 particles | ||
| Ring size | No. of rings | Percentage |
| 2 | 22 | 38 |
| 3 | 27 | 46.5 |
| 4 | 1 | 1.7 |
| 5 | 2 | 3.5 |
| 6 | 2 | 3.5 |
| 7 | 3 | 5.1 |
| 8 | 1 | 1.7 |
Once we can describe in detail the chemical “defects” in our glassy GeS2 sample (with respect to the crystal), we can move on to the study of the vibrational properties of this system in order to analyze the impact of these defects on the dynamics, impact which is supposed to be important according to experimental studies [4].
4 DYNAMICAL PROPERTIES
The study of the dynamical properties of g-GeS2 can be done through the calculation of the
Vibrational Density of States (VDOS), which can be measured experimentally by inelastic
neutron diffraction spectroscopy. Even though
Raman and IR measurements have been performed in chalcogenide glasses, no neutron diffraction
experiments have ever been performed on g-GeS2 glasses to our knowledge.
We calculate the VDOS of glassy g-GeS2 through the diagonalization of D, the dynamical
matrix of the system given by:
| (2) |
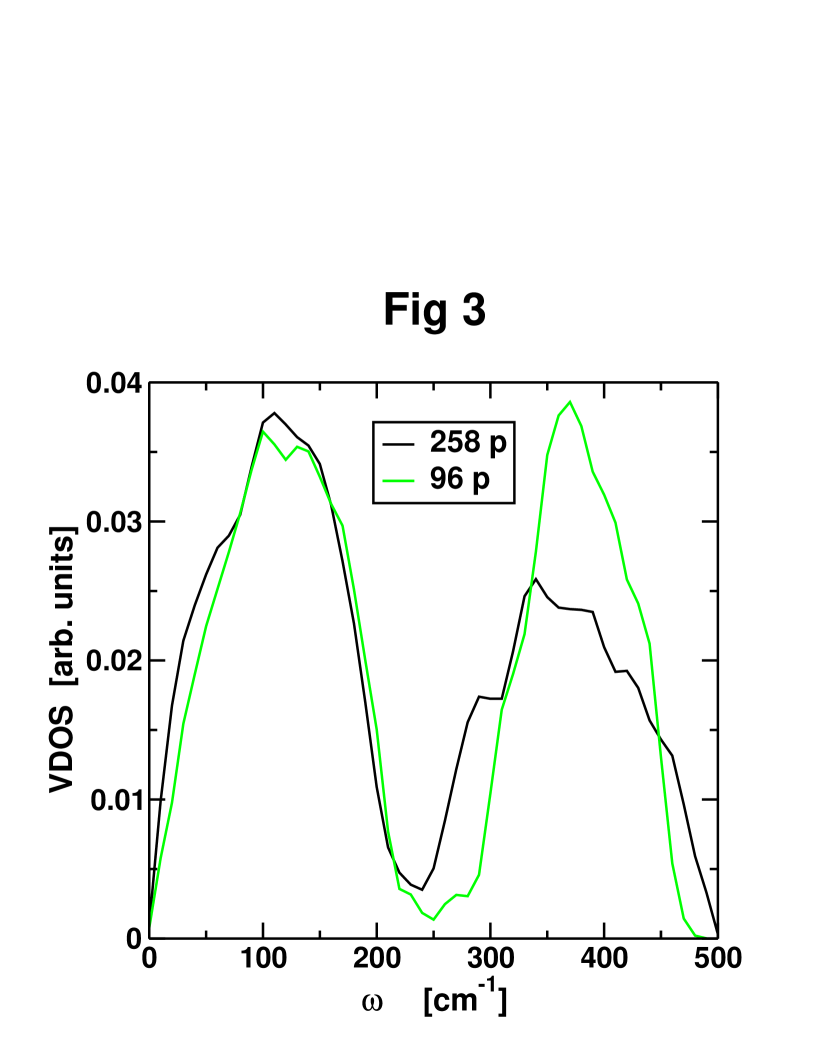
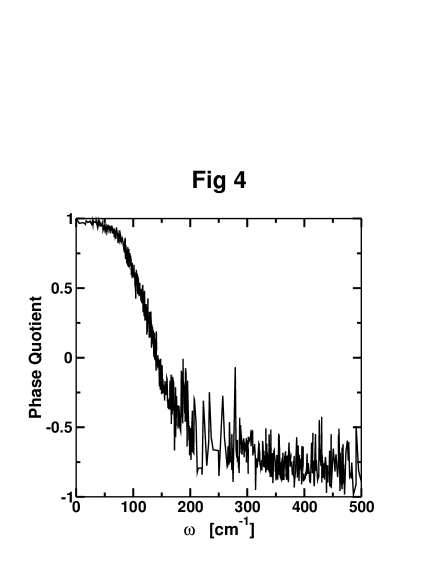
for two particles and . Fig.3 shows the calculated VDOS for two g-GeS2 samples containing respectively 96 and 258 particles. In the larger sample (the topic of the present study) we notice a widening of the optical band leading to an excess of modes (compared to the small sample) between 250 and 300 cm-1 and above 450 cm-1. We will see later that these modes arise from structural defects that are not present in the small sample (as seen previously [8]) but in order to analyze the VDOS and to determine the nature of the atomic displacements responsible of the vibrational modes, we first calculate the Phase Quotient [23], which is defined as:
| (3) |
where the summation is done over all first-neighbour bonds in the system.
and are the eigenvectors for eigenvalue
of the 2 particles involved in the first-neighbour bond.
If the motion of particles 1 and 2
is parallel for all first-neighbour bonds, then PQ() is equal to +1. If, on the
contrary, the motion is antiparallel for all pairs, then PQ() has a value of -1.
Fig.4 represents the calculated Phase Quotient for our glassy GeS2 sample. It can be
seen that the first band in the VDOS at low frequencies is
caused by acoustic-like modes, in which a particle vibrates almost in phase with its first
neighbours. These modes involve therefore extended interblock vibrations. The second
band in the VDOS arises from optic-like modes, in which the eigenvectors of first
neighbours are mostly opposed to each other,
leading mainly to intrablock vibrations. This is consistent with the usual assignment
of the acoustic and optic character of the two main bands in the VDOS.
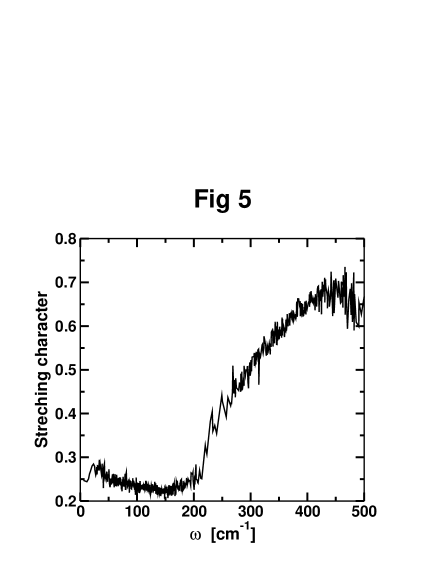
Another interesting tool in the analysis of the vibrations of a system is the Stretching character [24], which is defined as:
| (4) |
The summation is performed over all first neighbour links, and is the unit vector between the two particles of the bond.
The stretching character of g-GeS2 is shown in Fig.5.
We can see that at low frequencies, the vibrational modes arise from bending-like displacements, since Sc is close to 0. On the other hand, high frequency modes in the optic band can be attributed to stretching-like vibrations, in which the eigenvectors are almost parallel to the direction along the first-neighbour bonds, and Sc is close to 1.
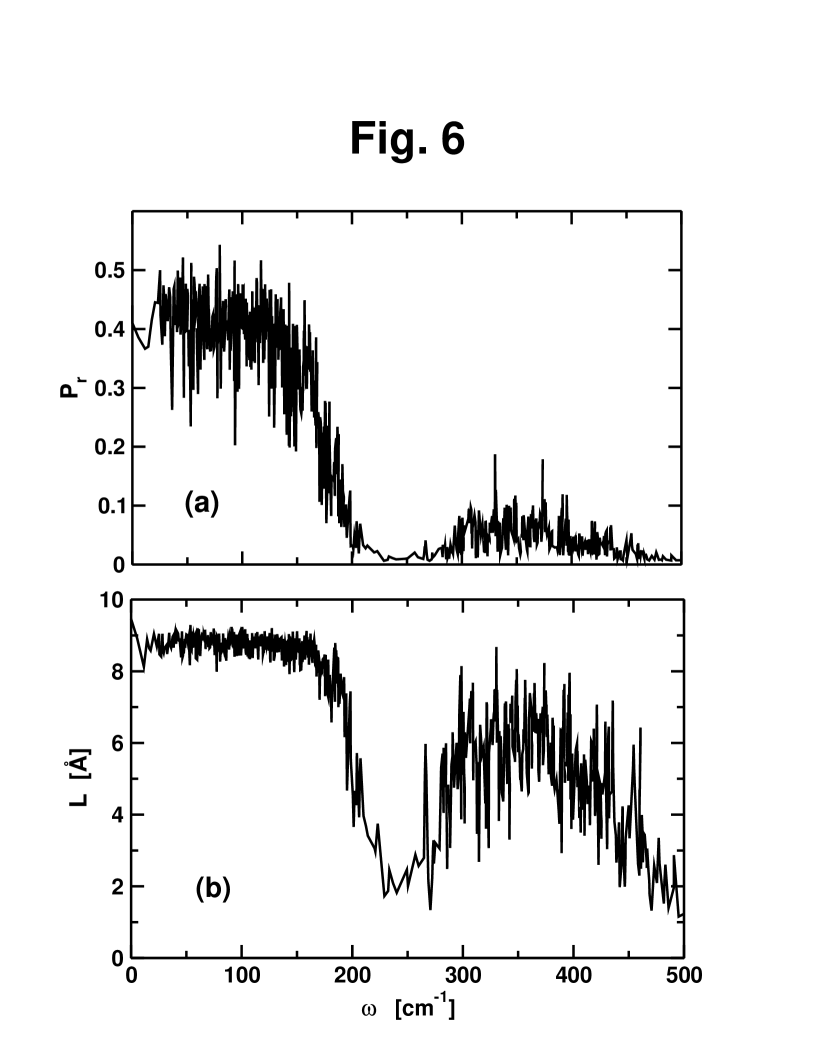
In order to measure the localization of the modes, we calculate the participation ratio Pr [25]:
| (5) |
where the summation is performed over the N particles of the sample. If the mode corresponding to
the eigenvalue is delocalized and all atoms vibrate with equal amplitudes, then Pr() will be close to 1. On the contrary, if the mode is strongly localized, then
Pr() will be close to 0. The results are shown in Fig.6(a) and we can see that the
localized modes are mainly present in the zone between the acoustic and the optic bands and also at
higher frequencies at the upper limit of the optic band. In this work, we will focus on these localized modes, not present in the small sample.
In order to determine which particles are involved in a given mode, we define the center of gravity of each mode of eigenvalue , and the corresponding “localization” length L [24], as
| (6) |
and
| (7) |
where and are respectively the position and the atomic mass of particle . Periodic boundary conditions are of course taken into account in these calculations. The localization length
(Fig.6(b)) represents the spatial localization of a given mode. It is a length beyond which the
amplitude of the atomic vibrations decreases significantly. Its maximal value is half that of the
box size which is in this case equal to 9.6 Å . For each eigenvalue, a sphere of radius L centered at will define the zone in which
the vibration is located. All the particles present inside this sphere will be considered as
involved in the
vibration. This scheme will allow us to determine the atomic displacements responsible of each localized mode.
A very controversial aspect in the study of the dynamics of g-GeS2 is the interpretation of the modes
located in the range close to 250 cm-1, since the origin of the peak observed in Raman spectroscopy has
never been clearly understood. Experiments on Ge-enriched GexS1-x systems, with different
concentrations of germanium, have been performed and the feature at 250 cm-1 was found to increase with the
Ge concentration[4, 6, 26]. This led to the hypothesis that this feature is due to tetrahedral units containing less than 4 sulfur atoms, such as Ge(S or Ge(S units
[26]. In comparable studies these vibrations have been assigned to Ge-Ge homopolar
bonds [27, 28], or to distorted rocksalt units [4]. This feature,
at 250 cm-1, was also found to increase in intensity under high pressure conditions [29]. In our simulation
we find that these vibrational modes are localized around 3-fold coordinated sulfur atoms,
with a corresponding localization length approximately equal to the first-neighbour distance between the
central S atom and the 3 Ge first neighbours. This mode is therefore extremely localized, and the 3 Ge atoms
are almost frozen in comparison to the central S that vibrates between them. This finding is consistent
with all the experimental results mentioned above. Since Ge-rich systems contain more of
these bond defects it can explain why the feature at 250 cm-1 in Raman spectra increases in Ge-rich
compositions. Under high pressure conditions, where Ge-rich and S-rich zones have been proposed to appear [26], the same explanation holds.
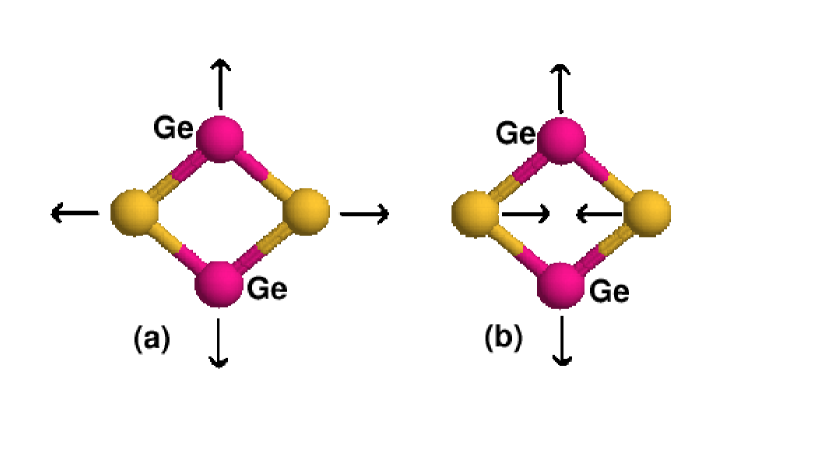
We find that two different zones, at 200 cm-1 and 440 cm-1, are localized around edge-sharing units
(2-membered rings). The high-frequency feature, at 440 cm-1, has been analyzed in several works
[4, 6, 28], and its origin is indeed due to the vibrations of edge-sharing units.
These modes are caused by symmetric breathing-like displacements as depicted in Fig.7(a). The other feature,
at 200 cm-1, which is not yet clearly understood, was found to increase in Ge-rich compositions [6].
We find that these modes are centered around edge-sharing units as well and are due to the vibrations
shown in Fig.7(b). Since the concentration of edge-sharing tetrahedra increases significantly with
Ge concentration [6], this could explain why this feature is more prominent in Ge-rich
compositions.
The homopolar bonds (Ge-Ge and S-S) also have a contribution in the Vibrational Density of States.
We find that the vibrations of ethane-like units, presenting Ge-Ge bonds, have a contribution at 270 cm-1
which is close to the value determined experimentally (260 cm-1) [6] and
theoretically (250 cm-1) [28].
We find the vibrational modes containing S-S homopolar bonds at 486 cm-1, which is exactly the value
found in Raman experiments on sulfur-rich samples [4]. These modes have been attributed to
the S-S bonds present in S8 rings or Sn chains, which appear in S-rich
compositions [2, 26, 28, 30]. However, in our stoichiometric GeS2 glass we find
no presence of these chains and the corresponding localization length of the mode (see Fig.6(b)) is extremely
small (1.5 Å). We can therefore argue that the feature at 486 cm-1 in Raman spectra is not
necessarily caused by extended S8 rings or Sn chains, but exists as soon as localized S-S homopolar bonds
are present. These homopolar bonds are only present in the large sample which explains why we observe in the VDOS
an excess of modes around 270 cm-1 and 486 cm-1 compared to the VDOS of the small
system (Fig.3).
Another region has been extensively studied over the past 20 years, concerning the so-called A1
and A modes, at 340 cm-1 and 370 cm-1 [2, 4, 6, 28].
Their presence in Raman spectra has been determined as arising from the symmetric stretch of
Ge(S
tetrahedra, in which the central germanium atom is frozen. The ”companion” mode A at 370 cm-1 has
been proposed to be due to similar vibrations in edge-sharing tetrahedra. The A1 and A modes are
mainly Raman-active, but cannot be identified clearly in the VDOS. Nevertheless since we have
previously shown that in our simulation the other modes have frequencies very close to the
experimental values, we have
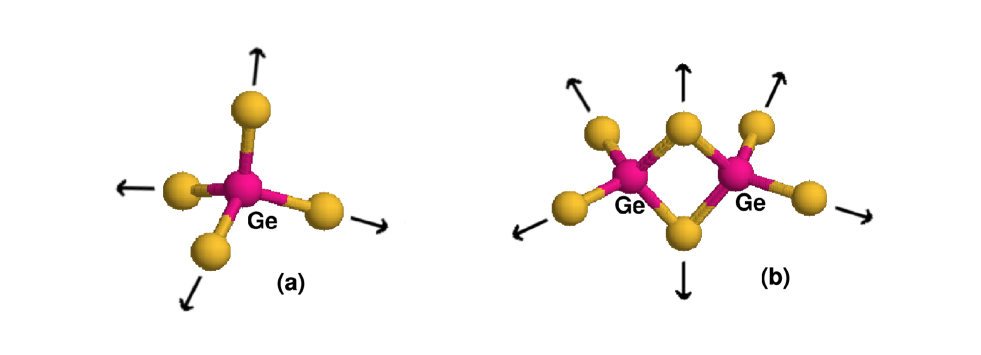
decided to analyze the modes between 340 and 370 cm-1. We indeed find tetrahedral
symmetric-stretching vibrations between 340 cm-1 and 360 cm-1, as represented in Fig.8(a)
We also find at 375 cm-1, symmetric-stretching modes concerning edge-sharing tetrahedra,
which are usually
assigned to the A modes (Fig.8(b)). In addition, many symmetric stretching vibrations of
tetrahedra
containing bond defects are present between the A1 and A zones. This can explain why the feature
at 340 cm-1 in Raman spectra does not disappear in Ge-rich compositions [26, 4],
even though the usual Ge(S tetrahedral units are no longer present in such systems.
5 CONCLUSION
Using DFT based MD simulations, we have analyzed the structural disorder of a
glassy GeS2 sample containing 258 particles and its impact on the vibrational spectrum.
Compared to a previous study on a smaller system [8], we find here the presence of homopolar bonds
(even though in extremely small concentration) which a priori permits the disagreement between
two recent experimental studies to be resolved [17, 18]. The signature of these bonds in the VDOS at 270 cm-1 and
486 cm-1 is in agreement with previous experimental and theoretical results. Nevertheless, the feature at
486 cm-1, previously assigned to S-S vibrations in S8 rings or Sn chains that can be found in S-rich
compositions, is not necessarily due to such medium sized units, but can arise from by S-S vibrations at
short distances. We also propose an alternative explanation of the feature at 250 cm-1 in the Raman spectrum,
showing that the corresponding modes are centered around 3-fold coordinated sulfur atoms, often present in
g-GeS2 (13.95 of the S particles in the present system). This explains the increase of this feature
in Ge-rich compositions, as well as in high-pressure samples, as found experimentally.
Analyzing the ring size distribution we find that in the process leading from the crystal
to the glass a large proportion of 3-membered rings disappears giving rise to larger rings and an
excess of 2-membered rings. These rings manifest themselves in the vibrational properties of glassy GeS2,
and principally 2 modes are found, at 200 cm-1 and 440 cm-1, respectively assigned to bond-bending and
bond-stretching vibrations of edge-sharing tetrahedra.
In the region experimentally assigned to the A1 and A1c modes we find, as
expected, symmetric-stretch vibrations of corner and edge-sharing
Ge(S tetrahedra respectively, but also vibrations of tetrahedra containing bond defects
which allows us to explain why these modes do not disappear in Ge-rich systems.
Acknowledgments
We thank David Drabold for providing some of the codes
necessary to analyze the vibrational properties of our sample. Part of the numerical
simulations were done at the “Centre Informatique National de l’Enseignement
Supérieur” (CINES) in Montpellier.
References
- [1] R. J. Nemanich, Phys. Rev. B, 16, 1655 (1977).
- [2] S. Sugai, Phys. Rev. B 35, 1345 (1987).
- [3] M. Yamaguchi, T. Nakayama, and T. Yagi, Phys. Rev. B, 263-264, 258-260 (1999).
- [4] P. Boolchand, J. Grothaus, M. Tenhover, M. A. Hazle, and R. K. Grasselli, Phys. Rev. B 33, 5421-5434 (1986).
- [5] A. Perakis, I. P. Kotsalas, E. A. Pavlatou, and C.Raptis, Phys. Stat. Sol. (b) 211, 421 (1999).
- [6] E. Bychkov, M. Fourmentin, M. Miloshova and C. Benmore, ILL Millennium Symposium (Grenoble, France, April 6-7, 2001), p. 54.
- [7] D. Foix, Phd. Thesis, Université de Pau, France (2003).
- [8] S. Blaineau, P. Jund and D. Drabold, Phys. Rev. B 67, 094204 (2003).
- [9] A. A. Demkov, J. Ortega, O. F. Sankey, and M. Grumbach, Phys. Rev B 52, 1618 (1995).
- [10] O. F. Sankey an D. J. Niklewski, Phys. Rev. B, 40, 3979 (1989).
- [11] P. Hohenberg and W. Kohn, Phys. Rev 136, B864 (1964).
- [12] D. M. Ceperley and B. J. Alder, Phys. Rev. Lett. 45, 566 (1980).
- [13] G. B. Bachelet, D. R. Hamman, and M. Schluter, Phys. Rev. B 26, 4199 (1982).
- [14] J. Harris, Phys. Rev. B, 31, 1770 (1985).
- [15] M. Durandurdu, D. A. Drabold, and N. Mousseau, Phys. Rev B, 62 15307 (2000).
- [16] J. Li, D.A. Drabold, Phys Rev. B, 64 104206 (2001).
- [17] L. Cai and P. Boolchand, Philos. Mag. B 82, 1649 (2002).
- [18] I. Petri and P. S. Salmon, J. Non-Cryst. Solids 293-295, 169 (2001).
- [19] A. Ibanez, M. Bionducci, E. Philippot, L. Descôtes, R. Bellissent, J. Non-Cryst. Solids 202, 248 (1996).
- [20] J. Olivier-Fourcade, J. C. Jumas, M. Ribes, E. Philippot and M. Maurin, Journal of Solid State Chemistry 23, 155 (1978).
- [21] Z. V. Popovic, Phys. Lett. 94A, 242 (1982).
- [22] I. Fejes, F. Billes, Int. J. Quantum Chem. 85, 85 (2001).
- [23] R. J. Bell and D. C. Hibbins-Butler, J. Phys. Chem. 68, 2926 (1964).
- [24] M. Marinov and N. Zotov, Phys. Rev. B, 55, 2938 (1997).
- [25] R. J. Bell, Methods Comput. Phys. 15, 215 (1976).
- [26] G. Lucovsky, F. L. Galeener, R. C. Keezer, R. H. Geils, and H. A. Six, Phys. Rev. B 10, 5134 (1974).
- [27] G. Lucovsky, R. J. Nemanich, and F. L. Galeener, in Proceedings of the 7th International Conference on Amorphous and Liquid Semiconductors, Edinburgh, Scotland, 1977, edited by W. E. Spear(G. G. Stevenson, Dundee, Scotland, 1977), p.130.
- [28] K. Jackson, A. Briley, S. Grossman, D. V. Porezag, and M. R. Pederson, Phys. Rev. B 60, R14985 (1999).
- [29] B. A. Weinstein and M. L. Slade, in Optical Effects in Amorphous Semiconductors (Snowbird, Utah, 1984), edited by P. C. Taylor and S. G. Bishop (AIP, New York, 1984), p.457; see also B. A. Weinstein and R. Zallen, in Light Scattering in Solids IV, Vol. 54 of Topics in Applied Physics, edited by M. Cardona and G. Guntherodt (Springer, New York, 1984), p.465.
- [30] A. Ibanez, M. Bionducci, E. Philippot, L. Descôtes, R. Bellissent, Journal of Non-Crystalline Solids 202, 248 (1996).