Shot Noise Suppression at Non-integer Conductance
Plateaus
in a Quantum Point Contact
Abstract
We study non-equilibrium differential conductance and current fluctuations in a single quantum point contact. The two-terminal electrical transport properties – differential conductance and shot noise – are measured at 1.5 K as a function of the drain-source voltage and the Schottky split-gate voltage. In differential conductance measurements, conductance plateaus appear at integer multiples of when the drain-source voltage is small, and the plateaus evolve to a fractional of as the drain-source voltage increases. Our shot noise measurements correspondingly show that the shot noise signal is highly suppressed at both the integer and the non-integer conductance plateaus. This main feature can be understood by the induced electrostatic potential model within a single electron picture. In addition, we observe the 0.7 structure in the differential conductance and the suppressed shot noise around 0.7 (); however, the previous single-electron model cannot explain the 0.7 structure and the noise suppression, suggesting that this characteristic relates to the electron-electron interactions.
pacs:
73.23.Ad, 73.40.Cg, 73.40.Kp, 73.61.EyA quantum point contact (QPC) in a two-dimensional electron gas (2DEG) system has been a prototypical device used to investigate low-dimensional mesoscopic physics. The Landauer-Büttiker formalism Buttiker92 ; Landauer92 , which interprets the electrical transport in such devices, is the most widely used theoretical model. By applying a negative voltage to lithographically patterned Schottky gates on top of 2DEG, additional spatial confinements can be achieved. Combinations of QPCs form zero-dimensional quantum dots Kastner93 in which single charge tunnelling occurs, and a single QPC defines one-dimensional conducting channels Houten96 . In the latter situation, the QPC becomes an electron waveguide that regulates the number of transverse modes between electron reservoirs. As a manifestation, a conductance trace consists of quantized steps in integer multiples of the spin degenerate quantum unit of conductance, , where is an electron charge and is Planck’s constant. Recently, the quantum modes of coherent electrons under QPCs were imaged with atomic force microscopy Topinka01 . An additional remarkable feature has been identified around 0.7 , which is called the “ 0.7 structure ” or “ 0.7 anomaly ” in the QPC conductance Fitzgerald02 . Its physical origin is still under investigation in terms of the interaction Thomas96 and spin properties of electrons Cronenwett02 by means of conductance.
The integer-plateau picture is true when a drain-source voltage () is kept small. As increases, the plateaus evolve from integer units to non-integer units , where is a fraction between 0 and 1 and is a non-negative integer Patel91 . The transition of conductance plateaus can be understood by a model of an electrostatic potential which is a function of Moreno92 ; Kouwenhoven89 . Due to the discrepancy between the number of allowed forward and backward transverse modes for a given finite energy window, the location of quantized levels depends on the degree () of the voltage drop across drain and source sides.
Along with experimental and theoretical work on the conductance, the current fluctuations have been studied as well with QPCs since these fluctuations provides information that is not contained, even in principle, in the conductance. Shot noise is the non-equilibrium current fluctuation resulting from the stochastic transport of quantized charge carriers. In mesoscopic conductors, shot noise occurs due to the random partition of electrons by a scatterer. Previous shot noise experiments with a QPC Reznikov95 ; Kumar96 clearly showed that shot noise signals agree well with a non-interacting theory, meaning that shot noise is nearly zero at the integer conductance plateaus where electrons are fully transmitted. We, however, have not yet found any thorough noise studies on the characteristic around the 0.7 structure clearly seen in early noise dataLiu98 ; Heiblum except as reported in the Ph.D. thesis Oliver02 regarding to such structure.
In this Letter, we reexamine a single QPC and report our experimental results on low frequency shot noise as well as differential conductance at 1.5 K by sweeping both and a split-gate voltage . We find a close connection between noise and conductance data. Shot noise is suppressed when conductance approaches quantized values of . Furthermore, the highly reduced shot noise signals are resolved near other fractional regions and around 0.7 for non-zero .
Our QPC devices were fabricated on a high mobility 2DEG formed in an undoped GaAs/AlGaAs heterostructure. A back-gate field-effect configuration allows us to tune the electron density in 2DEG Hirayama02 . The average electron density is 2 1011 cm-2. From the Hall bar pattern, the voltage drop across the QPC can be probed so that QPC conductance was experimentally extracted. Two external parameters — and — were varied in both the differential conductance, , and the low frequency two-terminal shot noise measurements. A standard lock-in technique was used on the differential conductance measurement. In order to improve the signal-to-noise-ratio in the shot noise experiment, an ac modulation lock-in technique and a resonant circuit were used together with a home-built cryogenic low-noise preamplifier Reznikov95 ; Liu98 ; Oliver99 . All measurements were performed in a He3 cryostat, whose base temperature was kept at 1.5 K.
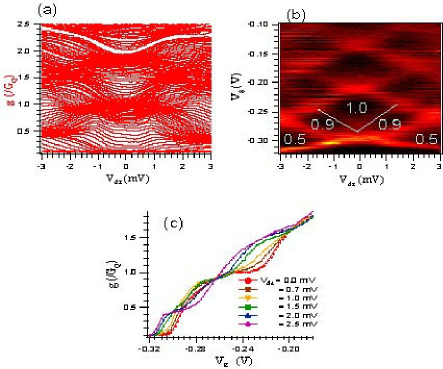
The measured differential conductance with an ac bias voltage 100 is plotted as a function of and in Fig. 1(a). All data on each line are taken at a different , and all measured values are normalized by . Dark regions are formed around the regions of plateaus. Conductance flattens around and 2 along 0, but away from 0, approaches plateaus at different locations. Alternatively, Fig. 1(c) clearly illustrates that the first step appears below 0.5 when = - 2.5 mV. We compute transconductance by differentiating in terms of , and plot it in a two-dimensional image graph (Fig. 1(b)). Here, black areas correspond the plateaus due to the small difference between traces along axis. In the first big diamond black area, there is a V-shape red structure, which separates the 0.9 structures from the plateau.
Furthermore, we notice that the transition behavior is not identical over the whole conductance values for finite . Below , an additional shoulder structure around 0.7 is manifest and it moves to 0.9 , and then the plateau clearly forms below 0.5 at a large . In contrast, above , as increases, no structure similar to the 0.7 anomaly is apparent and the plateau shows an increasing manner. The appearance of the non-integer conductance plateaus in terms of is understood quantitatively by a -dependent saddle-point potential model where the potential in a two-dimensional and plane is given byMoreno92
The first term in the right hand side contains the effect of a non-zero and it is written as:
where the coefficient is determined by the actual voltage drop between the drain and source side, and is related to the trend of plateau movements as gets biggerMoreno92 .
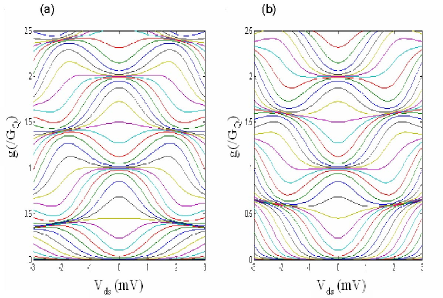
Although the simulation result (Fig. 2) show the qualitative picture of plateau evolution in , it fails to replicate the 0.7 and 0.9 structures, suggesting that more complicated physical mechanism is involved under and especially around 0.7 and 0.9 .
Following the differential conductance experiments, the low frequency two-terminal shot noise measurements performed. In order to extract the distinguishable shot noise signal from background noise, cannot be smaller than 500 . Three representative graphs are drawn as a function of in Fig. 3. Similar behaviors were observed in other devices as well. No matter what value of was applied, the shot noise level was clearly minimal when conductance reached about and 2 . The degree of the suppression at 3 became less smaller for a large . In the transient zones between the multiples of , the noise characteristic was rather complex. Below the first plateau, the noise suppression appeared around 0.6 and 0.9 until 1.5 mV (Fig. 3(a)). As further increased, these locations moved down to 0.5 and 0.8 (Fig. 3(b)), and eventually the suppressed noise was found only at 0.4 for 2.5 mV (Fig. 3(c)). Unlikely, when is higher than , only one additional noise reduction was found about 1.6 or 1.7 regardless of the magnitude of . Meanwhile, the plateau structures in gradually washed out as increased as shown in Fig. 3(d).
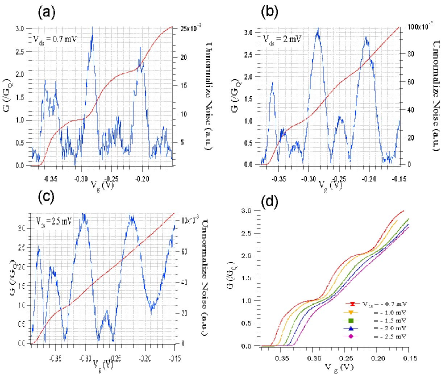
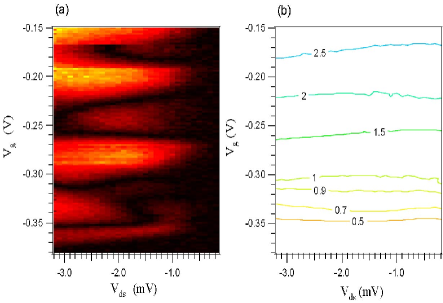
Figure 4 (a) exhibits the above observation of the shot noise response as a function of and in a continuous manner. The black color depicts the base shot noise level. Even though the occurrence of the suppressed shot noise can be easily seen in units of , the actual plot contains other noticeable features. The colored contour plot of conductance (Fig. 4(b)) helps us to see the relation of and the shot noise. Again under , several black strips are visible: The upper strip relates to the shot noise suppression around , and the lower two ones start at the conductance values 0.7 and 0.9 . For a high , the shot noise suppression occurs at less than 0.5 . The shot noise signal in higher G has a rather simple pattern: The reduced noises are observed around 1.6 or 1.7 and 2 as previously stated.
We notice that the shot noise behavior in the transient zone between the integer multiples of shares some features with the transconductance two-dimensional image plot (Fig. 1(b)). The peaks in the transconductance correspond to the larger shot noise signals and the dark areas in the transconductance match to the black strips in the shot noise image. Moreover, both the transconductance and the shot noise share common features for ; 0.7 structure can be distinctive and the location of the noise suppression and the new plateaus in occur around 0.4 as 2 mV. Within the saddle-point potential model, is expressed in terms of where is the i-th one-dimensional (1D) channel transmission probability. Since the shot noise has a term of for a small energy window, two quantities are closely related. It is not, however, obvious to predict the response of the shot noise for a large because the shot noise is obtained from the integral of the energy dependent transmission probability. Qualitatively, the noise suppression around the plateaus can be expected based on the fact that the current fluctuations can be zero or low when the current remains constant.
The different characteristics in both the transconductance and the shot noise are observed in the region of and . This observation is certainly beyond the simple saddle-point potential model in a single-particle approximation. In particular, it is surprising to have the strongly suppressed shot noise at 0.7 , meaning that electrons are regulated by a certain governing physical mechanism. The possible factor relating to the mechanism of the 0.7 anomaly would be the density of electrons. The shot noise study in terms of the electron density would provide more information to explore this question in the future.
In conclusion, we have experimentally studied the low frequency shot noise and the differential conductance with finite values of . We showed that the main feature of shot noise suppression in terms of can be understood by the differential conductance. However, the further investigation of the properties of both the differential conductance and the shot noise around the 0.7 structure should be needed in order to establish better understandings.
We acknowledge the ARO-MURI grant DAAD19-99-1-0215 for supporting this research.
References
- (1) M. Büttiker, Phys. Rev. B46, 12485 (1992).
- (2) Th. Martin and R. Landauer, Phys. Rev. B 45 1742 (1992).
- (3) M. A. Kastner, Physics Today 46(1), 24 (1993).
- (4) H. van Houten and C. Beenakker, Physics Today 49(7), 22 (1996).
- (5) M. A. Topinka, B. J. LeRoy, R. M. Westervelt, S. E. J. Shaw, R. Fleischmann, E. J. Heller, K. D. Maranowski, and A. C. Gossard, Nature 410, 183 (2001).
- (6) Recent review R. Fitzgerald, Physics Today 55(5), 21 (2002).
- (7) K. J. Thomas, J. T. Nicholls, M. Y. Simmons, M. Pepper, D. R. Mace, and D. A. Ritchie, Phys. Rev. Lett. 77, 135 (1996).
- (8) S. M. Cronenwett, H. J. Lynch, D. Goldhaber-Gordon, L. P. Kouwenhoven, C. M. Marcus, K. Hirose, N. S. Wingreen, and V. Umansky, Phys. Rev. Lett. 88, 226805 (2002).
- (9) N. K. Patel, J. T. Nicholls, L. Martin-Moreno, M. Pepper, J. E. F. Frost, D. A. Ritchie, and G. A. C. Jones, Phys. Rev. B 44, 13549 (1991).
- (10) L. Martin-Moreno, J. T. Nicholls, N. K. Patel, and M. Pepper, J. Phys.:Condens. Matter 4, 1323 (1992).
- (11) L. P. Kouwenhoven, B. J. van Wees, C. J. P. M. Harmans, J. G. Williamson, H. van Houten, C. W. J. Beenakker, C. T. Foxon, and J. J. Harris, Phys. Rev. B 39, 8040 (1989).
- (12) M. Reznikov, M. Heiblum, H. Shtrikman, and D. Mahalu, Phys. Rev. Lett. 75, 3340 (1995).
- (13) A. Kumar, L. Saminadayar, D. C. Glattli, Y. Jin, and B. Etienne, Phys. Rev. Lett. 76, 2778 (1996).
- (14) R. C. Liu, B. Odom, Y. Yamamoto, and S. Tarucha, Nature 391, 263 (1998).
- (15) M. Heiblum (Private communication)
- (16) W. D. Oliver, Ph.D. Dissertation (2002).
- (17) W. D. Oliver, J. Kim, R. C. Liu, and Y. Yamamoto, Science 284, 299 (1999).
- (18) Y. Hirayama and Y. Tokura (Private communication)