Shape memory ferromagnets
Abstract
In ferromagnetic alloys with shape memory large reversible strains can be obtained by rearranging the martensitic domain structure by a magnetic field. Magnetization through displacement of domain walls is possible in the presence of high magnetocrystalline anisotropy, when martensitic structure rearrangement is energetically favorable compared to the reorientation of magnetic moments. In ferromagnetic Heusler alloys Ni2+xMn1-xGa the Curie temperature exceeds the martensitic transformation temperature. The fact that these two temperatures are close to room temperature offers the possibility of magnetically controlling the shape and size of ferromagnets in the martensitic state. In Ni2+xMn1-xGa single crystals, a reversible strain of % is obtained in fields of T.
I Introduction
In this review we examine the properties of ferromagnets that exhibit shape memory and hyperelasticity (superplasticity) and that make it possible to control these effects magnetically. Shape memory in such substances is related to a martensitic phase transition, and the effect of a magnetic field on the parameters of the martensitic phase is caused by magnetoelastic interaction. The specific feature of the magnetoelastic interaction is that the entities that participate in the interaction are large intercorrelated ensembles of structural and ferromagnetic domains. In this respect the magnetoelastic interaction in shape memory ferromagnets, which leads to giant magnetically induced strains, differs significantly from magnetostriction, which is essentially a one-particle effect.
The possibility that certain substances can be reversibly controlled both in shape and size by mechanical stresses and electric or magnetic field places them into a separate class of functional materials. Representatives of this class are magnetostrictive materials, piezoelectric materials, and materials with shape memory. The hierarchy of the attainable reversible strains in crystals caused by magnetostriction (MS), the piezoelectric effect (PE), and shape memory (SM) is as follows:
Each of these methods of controlling the size of samples of such materials has its advantages and drawbacks and its own area of application. Magnetostrictors are used as emitters and detectors of sound, frequency stabilizers, and delay lines in wireless and acoustic devices, as microactuators and as magnetomechanical relays. Materials with shape memory are used in thermosensitive force-summing elements, detachable and nondetachable joints that do not require welding or soldering, and in various types of clamps used in medicine. An advantage of magnetostrictive materials is the small response time, while an advantage of materials with shape memory is the large reversible strains.
Studies of shape memory ferromagnets focus on ways to produce materials in which short response times are combined with large reversible strains. Several Heusler alloys and the intermetallic compounds Co–Ni, Fe–Pd, Fe–Pt, and Fe–Ni–Co–Ti have been investigated in this connection. The most promising results have been obtained with the ferromagnetic Heusler alloy Ni2MnGa. This unique alloy (more exactly, the family of Ni2+x+yMn1-xGa1-y alloys) has made it possible to achieve magnetically controlled variations in the linear size of crystals up to 6%, which is the theoretical limit of strains for martensitic transformations in this material.
The general ideas about martensitic transformations and the related special features of the mechanical behavior of alloys with thermoelastic martensitic behavior are examined in Section 2. In Section 3 we discuss the crystal structure of the Heusler alloys Ni2+x+yMn1-xGa1-y and in Section 4, the magnetic properties of these alloys. Section 5 is devoted to a description of the main physical properties of Ni2+x+yMn1-xGa1-y as a function of composition. In Section 6 we describe experimental implementations of the magnetically controlled shape-memory effect in Ni2+x+yMn1-xGa1-y. A summary of the data on other materials for which magnetic control of the shape memory effect is possible is given in Section 7. Section 8 is devoted to the theory of structural and magnetic phase transitions in cubic ferromagnets. In Section 9 we discuss the prospects of further investigations in this field and the possibilities of using this class of materials in applications.
II Martensitic transformations and the shape memory effect
II.1 Thermoelastic and nonthermoelastic martensitic transformations
Martensitic transformations are structural phase transitions of the diffusionless, cooperative type. The characteristic features of such transformations are the cooperative displacements of neighboring atoms by distances smaller than the atomic separation, a rigorous crystallographic connection between the lattices of the initial and final phases, and changes in the shape of the transformed region [1].
Martensitic transformations were first discovered in iron-based alloys (steel). Initially they were interpreted as structural transformations of a high-temperature face-centered cubic (fcc) phase (-phase, austenite) into a low-temperature body-centered cubic (bcc) phase (-phase, martensite). The main laws governing such transformations have been established without doubt. It was found that transformations similar to the martensitic transformation in steel occur in solids of a different nature (metals, insulators, semiconductors, and organic compounds) and belong to one of the main types of phase transformations in the solid state [2–4].
The most general feature of martensitic transformations is that they occur in the solid medium at low temperatures, when all diffusion processes are frozen. The conditions under which martensitic transformations take place (elastic medium, low temperatures) determine all the main features of the transformations. The manifestations of martensitic transformations are multivarious. They may proceed athermally with a rate equal to the speed of sound, or they can be thermally activated and develop with a measurable rate, be reversible or irreversible, or lead to formation of morphologically different structures that depend on the crystal geometry and properties of the initial and final phases and on the development of relaxation processes. Among transformations that are called martensitic are those that may be considered ”nearly second-order” and transformations that are clearly first-order accompanied by large heat and volume effects and a sizable hysteresis between the direct and reverse transformations.
The emergence of a new-phase crystal inside the initial matrix leads to the appearance of elastic and surface energies. If the difference in the crystal lattices is slight and the accommodation of the new-phase and matrix crystals is not accompanied by an irreversible plastic strain, the transformation may be considered fully reversible. The hysteresis between the direct and reverse transformations in this case is small, so that the structure of the initial phase is completely restored as a result of the reverse transformation. The small elasticity modulus and the high elastic limit of the phases (which ensures elastic accommodation of the intrinsic transformation strain), in addition to the small difference in the lattices of the initial and final phases, are conducive to the reversible nature of the transformation. Martensitic transformations of this type are called thermoelastic. The reversible nature of the transformation is the necessary condition for emergence of reversible effects under an external load: hyperelasticity, rubber-like behavior, and the shape memory effect.
If the difference in the crystal lattices of the phases is large and cannot be elastically accommodated, the transformation is accompanied by plastic strain and the emergence of structural defects, which hinder the easy motion of interphase boundaries. Here the reverse transformation proceeds not so much because of the gradual decrease in the size of the martensite crystals but largely because of nucleation and the growth of austenite crystals inside the martensitic matrix. This process is accompanied by an increase in the number of orientations of the high-temperature phase, in contrast to the reproduction of the initial orientation in a thermoelastic transformation. Martensitic transformations of this type are called nonthermoelastic.
Since martensitic transformations are first-order phase transitions, the temperatures of their beginning and end are their characteristic parameters. The transformation of austenite into martensite (direct transformation) is characterized by the temperature of the appearance of nuclei of the martensitic phase in the austenitic matrix and the temperature at which the formation of the martensite ends. In the reverse transformations these temperatures are denoted and .
There is no well-defined boundary between thermoelastic and nonthermoelastic transformations: to one extent or another all martensitic transformations are reversible — the question is how large the size of the hysteresis between the direct and reverse transformations is. In some cases (with Cu–Sn, Fe–Pt, and Fe–Co–Ni–Ti alloys) thermal treatment can change the size of the hysteresis and thus change the type of martensitic transformation.
Anomalies in the mechanical properties are inherent in all low-temperature structural phase transformations, irrespective of the nature of the material and the electrical and magnetic properties of the phases. Specific effects related to the action of an electric or magnetic field manifest themselves only when one of the phases exhibits ferroelectric or ferromagnetic properties, respectively.
If, due to the crystal geometry, the martensitic transformation is of the ”nearly second-order” type and the intrinsic transformation strain is the order parameter, the elastic constant corresponding to this strain vanishes at the start of the transformation or becomes small. Examples are the low-temperature structural transitions in the superconductors Nb3Sn and V3Si [5]. In substances in which the crystal geometry of the transformations is such that they could, in principle, be second-order transitions but proceed as first-order transformations (transformations in the In–Tl, Au–Cd, and Mn–Cu alloys), the elastic constants decrease as the point at which the transformation begins is approached but remain finite [5, 6]. Finally, if the transformation is clearly a first-order one, as it happens to be in Li, Na, and Cs [7] or in the transition of the high-temperature face-centered phase to the low-temperature body-centered phase in iron alloys, the elastic constants have no anomalies as the martensite point is approached.
II.2 Hyperelasticity and superplasticity
Above the martensite point a transformation can be caused by applying external stresses [8]. An external stress performs work along the path determined by the intrinsic transformation strain . This work provides an additional contribution to the thermodynamic driving force of the transformation. The shift in the temperature of the thermodynamic equilibrium of the phases and, respectively, in the martensite point is described by the generalized Clapeyron equation
where are the external stresses corresponding to and is the change in entropy at the transformation. For fixed and , the shift of the martensite point is greater, the higher the external stresses. However, under stresses greater than the elastic limit plastic strain sets in, and this hinders thermoelastic transformation. This limits both the level of admissible stresses and the greatest possible rise in the martensite point at which the transformation remains thermoelastic. If the temperature (the temperature at which the transformation can be caused by stresses not exceeding the elastic limit) is higher than the temperature at which the reversible transformation ends, when the external stresses are lifted the martensite that formed under the stresses transforms into the initial phase, i.e., the transformation proves to be mechanoelastic. Thus, within a certain temperature range that adjoins the martensite point, under an external load there occur a mechanoelastic martensitic transformation and a reversible ”hyperelastic” strain associated with this transformation.
In some alloys subjected to external stresses there can be one or several martensitic transformations of one martensitic phase into other martensitic phases. In this case hyperelasticity caused by these mechanoelastic transformations may be observed even below the martensite point.
In some alloys subjected to an external load in the temperature interval from to , the martensite that was produced as a result of external stresses does not disappear when the load is removed and, instead of hyperelasticity, there is residual strain caused by the emergence of martensite (superplasticity). At the stresses that initiated the transformation and brought on pseudoplastic strain are close to zero. As the temperature is raised, the stresses that caused superplastic strain increase, too, in accordance with the generalized Clapeyron equation. At a certain ”distance” from the martensite point the stresses that initiated the transformation may exceed the yield stress of the material and ordinary plastic strain sets in along with the transformation. Under certain conditions the interaction of plastic strain and martensite transformation may lead to a substantial increase in plastic strain, which precedes the breakup of the sample.
II.3 Shape memory effect
In most alloys with a thermoelastic martensite transformation the application of a load in the martensitic phase leads to residual strain in the material. This strain sets in because of the transformations in the martensitic structure (via twinning, growth of martensite crystals favorably oriented with respect to the external load at the expense of less favorably oriented crystals, etc.). As the temperature is increased, the initial orientation and structure of the high temperature phase, and thus the initial shape of the sample, are restored in the reverse transformation. The effect of restoration of the shape of the deformed sample as a result of a reverse martensitic transformation in the process of heating the sample is called the shape memory effect.
Restoration of shape in the reverse transformation is observed in thermoelastic martensitic transformations as well as in nonthermoelastic martensitic transformations. A specific feature of alloys with thermoelastic transformation is that the degree of shape restoration in them is very high and approaches 100%. All factors that favor the thermoelastic nature of a martensitic transformation also favor the maximum manifestation of the shape memory effect.
Since the formation of nuclei of the low-temperature phase at a martensitic transformation is heterogeneous, a fact corroborated by the microstructural reversibility of the transformation, the creation of the most favorable locations of nucleation of martensite can determine the entire sequence of the emergence of martensite crystals and, consequently, the overall change of shape of the sample in the transformation. The creation and pinning of the centers of heterogeneous nucleation makes it possible to control the process of martensitic transformation under cyclic variations in the temperature. As a result, the transformation follows the same path in cooling and in heating, so that a two-way (reversible) shape memory effect emerges. There are several ways in which a reversible shape memory effect can be achieved: through strains that lie outside the limits of reversible strain in the austenitic or martensitic state [9, 10]; through multiple repetition of the cooling–deformation–heating cycles that lead to the shape memory effect [11]; through multiple repetition of the loading cycles at a temperature above (the final temperature of the reversible transformation) that lead to hyperelasticity (pseudoelasticity) [11]; through repetition of the cycles ”heating above — cooling under load to (the final temperature of the martensitic transformation) — removing the load — heating above ” [12]; and through thermal treatment under load. All these treatments lead to the emergence of spontaneous strain upon cooling, and the value of this strain is smaller than in the ordinary shape memory effect. Moreover, the stresses generated in the direct transformation are much smaller than those characteristic of the reverse transformation. Reversibility disappears even under a small load, although without a load it can be reproduced several hundred times. The explanation of the easy disappearance of the shape memory effect in a direct transformation under load is that for a direct transformation there are several crystallographic variants, and the variant chosen is the one that reduces the external stresses. In view of these crystallographic factors, it is practically impossible to increase the stress that appears in the direct transformation.
All these effects, which are realized in the stress vs temperature plane, have been thoroughly studied for various classes of materials and form the basis of our discussion. The subject of the present review is a description of martensitic transformations and the accompanying shape memory effects in ferromagnets. The presence of a magnetic subsystem in substances that undergo such transformations enriches the picture and makes it possible to study the phenomena that occur in them using three coordinates: load, magnetic field strength, and temperature. The effect of a magnetic field does not amount solely to a modification of these effects – it opens up new possibilities in controlling the shape and size of shape memory ferromagnets. A magnetic field can be used to shift the temperatures of structural phase transitions and to affect the topology of the martensitic phase. Here the parameters of the magnetic subsystem of a ferromagnet play the leading role. The difference in the magnetization of austenite and martensite determines the size of the shift in the temperature of a phase transition in a magnetic field. The magnetoelastic coupling and magnetocrystalline anisotropy constants determine the possibility of transforming the martensitic variants by applying a magnetic field.
The same phenomena that are observed in nonmagnetic materials in the load vs temperature plane can, in principle, be realized in the magnetic field strength vs temperature plane. Magnetically induced strains that are greater than simple single-ion magnetostriction have been observed in some Heusler alloys and in a number of intermetallic compounds. The Heusler alloy Ni2MnGa, in which the martensitic transformation takes place in the ferromagnetic state [13], has so far attracted the greatest attention.
III Heusler alloy Ni2MnGa: elastic subsystem
III.1 Crystal structure
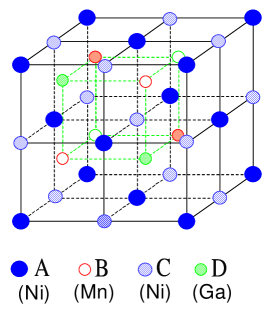
Heusler alloys are ternary intermetallic compounds with the general formula X2YZ. The Ni2MnGa alloy, which belongs to this family, has the L structure at room temperature, which, as shown in Fig. 1, can be represented by a bcc lattice in which the Ni atoms occupy the position at the center of the cube, while the Mn and Ga atoms alternatively occupy the positions at the apexes [14]. The formation of such a structure from the melt (the melting point of Ni2MnGa is roughly 1380 K) is, in principle, possible either from the fully disordered phase A2 or through the partially ordered intermediate phase , in which the Ni atoms already form the frame of the lattice, while the Mn and Ga atoms still occupy arbitrary positions. But with Ni2MnGa the situation is different [15]. As the temperature decreases, this compound passes from the melt directly into the partially ordered phase B, and this phase then experiences a second-order phase transition of the disorder–order type [16]. The transition temperature for Ni2MnGa is about 1070 K. Down to K Ni2MnGa remains in the L phase, and this Heusler alloy then undergoes a first-order phase transition to a martensitic tetragonal phase, with . At room temperature the cubic lattice constant of Ni2MnGa is 5.825 Å and the unit cell volume Å3 (the number of formula units per unit cell is ). At low temperatures the parameters of the tetragonal lattice are Å and Å, with , and the unit cell volume is 195 Å3 [14].1
This does not exhaust the sequence of phase transitions in Ni2MnGa, since these alloys can experience a premartensitic transition and intermartensitic transformations.
Note that in studies of the crystal structure of the non-stoichiometric Ni2MnGa alloys by the X-ray (or electron) diffraction method no reflections corresponding to the L structure have been observed because the atomic scattering factors of the constituent elements are close to each other. Although the reflections observed in X-ray diffraction patterns represent only the short-range order corresponding to the B2 structure, traditionally the crystal structure of the cubic phase of the family of Ni2+x+yMn1-xGa1-y alloys is considered as L structure. It must also be noted that for samples of non-stoichiometric composition a martensitic phase with orthorhombic and monoclinic distortions has been reported (see Section 3.3).
Before we discuss the physical properties of Ni2MnGa any further, a remark concerning the chemical composition of this Heusler alloy is in order. Almost all parameters of Ni2MnGa have proven to be very sensitive to the chemical composition of the samples. The sample’s composition strongly affects the temperatures of phase transformations and the formation of superstructures in the austenitic and martensitic states. In many original publications, the exact composition of the sample is not given and is assumed to be stoichiometric. This has led to a situation in which, for instance, the temperatures (known from the literature) of the martensitic transformation vary from less than 4.2 K to 626 K [17]. Bearing all this in mind, we will give, where possible, not only the nominal composition but also the temperatures of the investigated phase transition. The fact that these parameters do not agree with each other may mean, for one thing, that the chemical composition of the investigated samples does not agree with the component ratio in the working mixture. The dependence of the most important parameters of the Ni2MnGa alloy on composition is discussed in Section 5.
III.2 Premartensitic phenomena
Various pretransitional phenomena occur prior to the structural transformations of the martensitic type observed in a broad class of materials. Among these are the formation of soft modes in the lattice, anomalous broadening of the reflections in the X-ray spectrum, the emergence of a tweed structure, etc. Pretransitional phenomena are observed in superconductors with an A15 structure and in ferroelectrics with a perovskite structure [5] and in a broad class of shape memory alloys [6, 18]. What sets the Heusler alloy Ni2MnGa apart from all other compounds that experience martensitic transformations is that, in addition to pretransitional phenomena [19, 20], there can be a premartensitic phase transition.
The physical nature of the premartensitic transition has been the topic of theoretical [21, 22] and experimental work, including neutron diffraction [23–25], transport [26, 27], magnetic [28], mechanical [29–31], and ultrasonic measurements [32–35], and electron microscopy [36, 37].
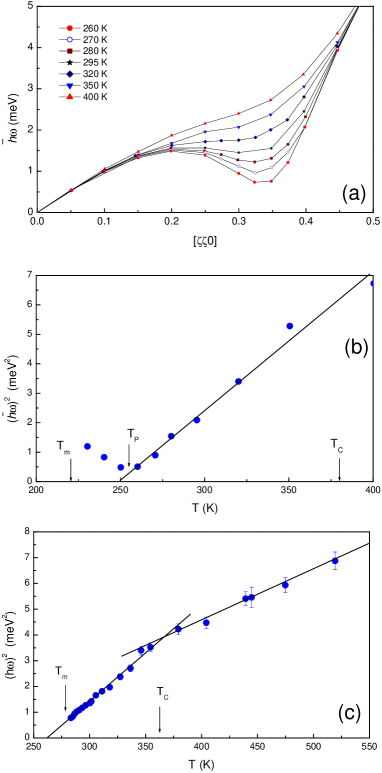
The focus in the inelastic neutron scattering study [20] of a Ni2MnGa single crystal with a martensitic transition K was on the transverse acoustic phonon TA2 mode in the direction. At this mode corresponds to the elastic constant , which, in turn, is determined by the speed of transverse sound propagating in the [110] direction and polarized along the axis. In contrast to the longitudinal LA mode and the transverse TA mode, the dispersion curve of the TA2 mode exhibits substantial softening at . The development of this feature with decreasing temperature is shown in Fig. 2a.
The temperature dependence of the squared frequency of the soft phonon mode is shown in Fig. 2b. This dependence is non-monotonic, with the frequency of the TA2 mode reaching its minimum (but not vanishing) at the premartensitic transition temperature K and increasing, as temperature is decreased further. Since is much higher than the martensitic transformation temperature , this means that in the interval from to the Ni2MnGa crystal is in an intermediate phase between austenite and martensite.
The unconventional temperature dependence of the soft phonon mode indicates that tendencies toward the formation of a micromodulated superstructure in the Ni2MnGa lattice develop long before the transition to the martensitic state. Electron microscopy studies suggest that the overall cubic symmetry of the crystal lattice is conserved in the interval from to but that in this lattice a modulation with a period of six atomic separations develops in the [220] direction, Å [30, 37].
Further development of these neutron diffraction studies [20, 23] was the work done by Zheludev and Shapiro [24], who studied the effect of uniaxial stress on the transverse phonon TA2 mode in Ni2MnGa. The uniaxial stress was applied along the crystallographic [001] axis. In the unstressed sample the minimum in the dispersion curve was also achieved at , . As the stress increased, the minimum in the dispersion curve shifted toward higher values, and at MPa the minimum was at . The temperature dependence of the energy of the anomalous phonons was found to be nonmonotonic. The greatest softening of the mode was achieved at K, and with a further decrease in temperature the energy of the anomalous phonons grew. This indirect indication of the rise in the premartensitic transition temperature was corroborated by data on elastic neutron scattering.
On the microscopic level the softening of the TA2 mode at a certain value means that is a special wave vector of the Fermi surface, and the fact that these vectors coincide in the phonon and electron subsystems (this is known as nesting) of the metal leads to an enhancement of the electron–phonon interaction. When pressure is applied to the sample, the parameters of the unit cell change, which leads to deformation of the Fermi surface. Nesting in this case is achieved at another value of the wave vector, and the anomaly in the phonon dispersion curve shifts to another value of [24].
Neutron diffraction studies of Ni2MnGa single crystals with substantial deviations from stoichiometry have identified several interesting features of these alloys. The temperature dependence of the squared frequency of the phonon mode in a sample of Ni51.5Mn23.6Ga24.9 composition ( K and K) at [38] is depicted in Fig. 2c. Clearly, at the soft acoustic phonons have a finite energy, and the squared phonon energy increases linearly with temperature up to the Curie point . For the dependence is also linear, but its slope is much smaller: at the slope is 0.039 meV2K-1, while at it is 0.019 meV2K-1. The temperatures to which these lines are extrapolated from the ferromagnetic and paramagnetic phases are 264 K and 175 K, respectively. All this points to a substantial effect of magnetic ordering on the elastic subsystem of Ni2MnGa. Softening of the phonon mode with the same wave vector was also observed in a sample of Ni52.9Mn26.6Ga20.5 composition with close temperatures of the structural ( K) and magnetic ( K) phase transitions [39]. In contrast to the samples whose compositions were close to stoichiometric, which were studied by Zheludev et al. [20, 23], where the energy of the soft mode was found to increase as was approached, in the samples with compositions Ni51.5Mn23.6Ga24.9 and Ni52.9Mn26.6Ga20.5 no such effect was observed. This indicates that in the samples in question there was no premartensitic transition.
Ultrasonic measurements have demonstrated that the temperature dependencies of the elastic moduli are qualitatively similar to the temperature dependence of the phonon modes discovered in neutron diffraction studies. For instance, in Ref. [40] it was reported that in non-stoichiometric Ni2MnGa the elastic constants exhibit an anomalous temperature dependence at K approached from higher temperatures; precisely, increases and and decrease, pointing to a softening of the shear modulus , which characterizes the stability of the lattice under shear deformation. The anomalously small value of is a distinctive feature of many alloys undergoing martensitic transitions [41], and, in addition to the tweed structure, broadening of the reflections in the X-ray spectrum and the soft phonon mode, is one of the pretransitional phenomena. No premartensitic transition was observed in the sample studied in Ref. [40], apparently because of the relatively high martensitic transition temperature. Ultrasonic measurements involving single-crystal samples with smaller deviations from stoichiometry have shown the presence of additional anomalies in the temperature dependencies of the elastic constants, anomalies that owe their emergence to a premartensitic transition.
Anomalies in the temperature dependencies of the elastic constants have been observed at the premartensitic transition temperature K for a sample whose composition is close to stoichiometric ( K and K) [33]. Figure 3a shows that the substantial softening of the shear moduli and occurs as we move closer to K. Further cooling only increases these moduli. Such behavior of the elastic constants, especially , is similar to the temperature dependence of the phonon TA2 mode at [20]. Measurements of the speed and damping of ultrasound involving a Ni2MnGa single crystal with K and K [32, 34] have shown that the elastic properties of this sample are qualitatively similar, within a broad temperature interval, to those of a single crystal with lower temperatures of the premartensitic and martensitic transitions studied by Mañosa et al. [33].
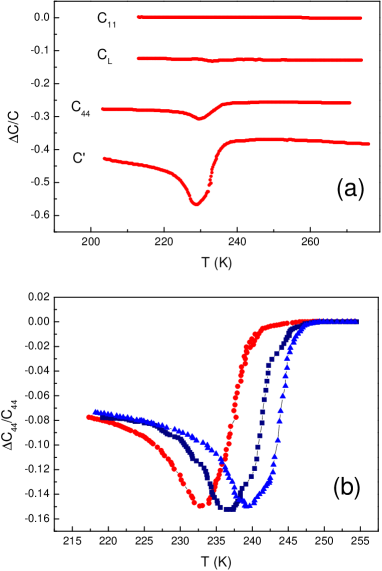
The investigations of Gonzàlez-Comas et al. [35] of the effect of uniaxial compression on the temperature of the premartensitic transition in Ni49.5Mn25.4Ga25.1 with K and K have revealed that the minimum in the temperature dependence of the elastic modulus shifts toward higher temperatures when a load is applied along the crystallographic direction (Fig. 3b). Note that this experiment revealed the presence of pronounced hysteresis phenomena ( K at 9 MPa) at the premartensitic transition temperature. In the absence of uniaxial compression no temperature hysteresis was observed near . The fact that hysteresis phenomena appear in the premartensitic transition [35] agrees with the data on the effect of uniaxial compression on the soft phonon TA2 mode () [24]. An interpretation of this effect was done by Mañosa et al. [42], who found that external pressure applied to the sample results in the singularities characteristic of first-order phase transitions becoming more pronounced.
Measurements of the magnetic-field dependencies of the elastic constants , , and for single-crystal Ni49.5Mn25.4Ga25.1 in magnetic fields up to 10 kOe applied along the crystallographic directions [001] and [110] revealed [35] that the elastic constants increase in the magnetic field and reach saturation in fields kOe for H [001]. For H [110], saturation was reached at kOe. The results of magnetization measurements done with the same sample [43] suggest that the variation of the elastic constants in a magnetic field is proportional to the square of magnetization, .
III.3 Superstructural motives
Almost all X-ray and neutron diffraction studies involving Ni2MnGa reveal the presence of superstructural reflections, in addition to the main reflections of the low-temperature martensitic phase. For instance, in the first neutron diffraction studies of a sample of stoichiometric composition [14] it was found that there are additional reflections of the tetragonal phase and it was assumed that this phase is modulated along, apparently, the [100] direction. Further studies of the crystal structure of the low-temperature phase in non-stoichiometric compounds revealed a complex pattern of formation of different martensitic phases and the presence of intermartensitic phase transitions in the system Ni2+x+yMn1-xGa1-y [44-57]. In the early stages of such studies the superstructural motifs were described as static displacement waves (modulations) [44], although lately an alternative approach is being developed, in which the superstructural reflections of martensite are interpreted as long-period rearrangements of closely packed planes of the type [25, 57]. A comparative analysis of these two approaches in describing the crystal structure of martensite in Ni-Mn-Ga is given in Ref. [56], where it is shown that they often lead to the same results.
As of now, the existence of an unmodulated martensitic phase and martensite with five- and seven-layered modulations along the crystallographic direction [110] has been established. There have also been reports about observations of longer-period modulations and about intermartensitic transformations in Ni2+x+yMn1-xGa1-y induced by temperature or uniaxial strain.
Five-layered modulation of the low-temperature tetragonal phase was observed by the method of diffraction of electrons and X-rays on single crystals of Ni51.5Mn23.6Ga24.9 ( K) [44, 48, 53], Ni49.2Mn26.6Ga24.2 ( K) [51, 52], Ni52.6Mn23.5Ga23.9 ( K) [51], Ni52Mn23Ga25 ( K) [25], and Ni48.5Mn30.3Ga21.2 ( K) [58]. In the process of formation of superstructures in the martensitic phase of these Heusler alloys, the X-ray patterns showed, besides the main diffraction reflections, a number of additional reflections. Modulation occurs in such a way that each fifth (110) plane does not undergo displacements, while the other four are displaced from their regular positions in the body-centered tetragonal lattice along the [110] direction.
Seven-layered modulation of the martensitic phase was observed in single crystals of Ni52Mn25Ga23 ( K) [44] and Ni48.8Mn29.7Ga21.5 ( K) [59]. X-ray studies of Ni48.8Mn29.7Ga21.5 have shown that, as in the case of five-layered martensite, besides the main reflections there are additional diffraction reflections that lie along the [110] direction. The crystal structure of the seven-layered martensite in Ni48.8Mn29.7Ga21.5 was found to be orthorhombic with the lattice parameters Å, Å, and Å [59]. In contrast to this, the crystal structure of seven-layered martensite in Ni52Mn25Ga23 was interpreted as monoclinic with the lattice parameters Å, Å, and Å and with [44].
Unmodulated martensite was observed in single-crystal samples and thin films of alloys of the following compositions: Ni53.1Mn26.6Ga20.3 ( K) [54, 60] and Ni48.5Mn30.3Ga21.2 ( K) [58]. The crystal structure of the unmodulated martensitic phase proved to be tetragonal, but the ratio for it is much higher than for the tetragonal martensitic phases considered above.
The experimental data on modulations of the crystal lattice in the martensitic phase suggest that the type of martensite (modulation period) depends on the composition of the alloys. It is convenient to classify these types according to the martensitic transition temperature [56]. Five-layered martensite has a crystal lattice of tetragonal symmetry and is formed in the process of cooling in alloys that have K. Seven-layered martensite is formed in alloys with a higher and has a crystal structure different from the tetragonal one.
IV Heusler alloy Ni2MnGa: magnetic subsystem
IV.1 Magnetization
The results of band structure calculations for the Heusler alloys Mn [61, 62] suggest that the Mn spin-up -states are almost completely occupied and that the Mn -wave functions overlap with the -wave functions of the atoms. The same calculations show that Mn spin-down -states are almost entirely unoccupied. Recently these calculations have been corroborated by the data from photoemission spectroscopy [63-65]. Webster et al. [14] showed that the magnetic moment in the Heusler alloy Ni2MnGa is localized primarily on the manganese atoms, , while the magnetic moment on nickel atoms .

The temperature dependencies of the magnetization of Ni2MnGa measured in fields ranging from 1 kOe to 16 kOe [14] are shown in Fig. 4. Clearly, this alloy transforms to the ferromagnetic state at the Curie temperature K. In the martensitic transformation region at K in weak fields there is a sharp decline in the magnetization, which corresponds to an increase in magnetocrystalline anisotropy, while measurements in strong fields have shown that the saturation magnetization in the martensitic phase is somewhat greater than the saturation magnetization in the austenitic phase.
The reports of systematic studies of the effect of deviation from the stoichiometric composition on the magnetic properties of Ni2+xMn1-xGa can be found in Refs [66-68]. Substitution of Ni atoms for Mn atoms is accompanied by a decrease in magnetization, an increase in , and a decrease in . The decrease in the Curie temperature and magnetization can be explained by the decrease in the number of atoms that carry the magnetic moment, while the increase in the martensitic transformation temperature is, probably, caused by the increase in the number of conduction electrons. Nickel atoms have three more electrons in the -shell than manganese atoms. Substitution of Ni atoms for Mn atoms leads to an increase in the volume of the Fermi surface and thus to an increase in the temperature at which the structural phase transition takes place. Note that the martensitic transformation disappears even when a small number (%) of Mn atoms are replaced by V atoms [69].
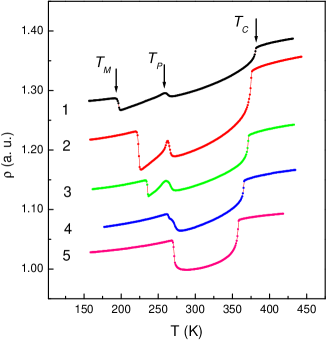
In addition to the anomalies caused by the martensitic transformation, specific features in the temperature and field dependencies of the magnetic properties of Ni2MnGa caused by intermartensitic and premartensitic transitions have also been observed. The anomalies associated with intermartensitic transitions manifest themselves most vividly in the temperature dependencies of the low-field magnetic susceptibility [49, 59, 70], which is an indication that the magnetocrystalline anisotropy changes upon the transition of one martensitic phase into another. For instance, a sequence of intermartensitic transitions has been observed in the reheating of a Ni52.6Mn23.5Ga23.9 single crystal that was first preloaded along the [110] crystallographic direction and then unloaded at liquid nitrogen temperature [49]. Figure 5 shows that, in addition to the anomalies in the low-field magnetic susceptibility at the Curie temperature K and the martensitic transition temperature K, there are two more anomalies, at 190 K and at 230 K. These new anomalies were interpreted as being caused by intermartensitic transitions from the unmodulated martensitic phase to seven-layered martensite at 190 K and then from seven-layered martensite to five-layered martensite at 230 K. The results of the measurements of magnetization in a 15 kOe field that Kokorin et al. [71] conducted on a single crystalline sample of the same composition and in the same experimental conditions (preloading and unloading at 77 K) suggested that the martensitic phases have different magnetizations. However, since the change in magnetization was detected only for one intermartensitic transition, the researchers assumed that the magnetizations of the other two martensitic phases have close values.

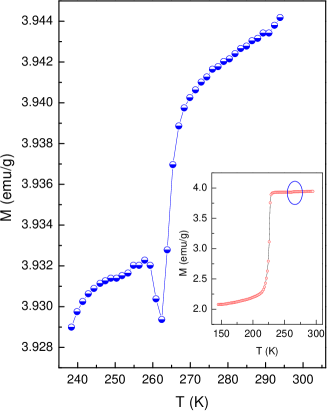
Certain anomalies in the vicinity of the premartensitic phase transition have also been observed at temperature dependencies of the low-field magnetic susceptibility and magnetization of Ni2MnGa [27, 28, 33, 72]. Since the formation of the premartensitic phase is accompanied by the formation of a static displacement wave [37], we can assume that the magnetic anisotropy in the premartensitic phase is higher than in the cubic phase, which is reflected by a drop in magnetization at , as shown in Fig. 6.
The transformation of the martensitic domains with a magnetization vector oriented unfavorably with respect to the external magnetic field may lead to anomalies in the field dependencies of magnetization [73-75]. Figure 7 depicts the field dependencies of magnetization for a single crystal Ni48Mn31Ga21 sample with the following temperatures of the ferromagnetic and martensitic transitions: K and K [74]. Measurements done at 290 K have shown that the slow increase in magnetization is replaced by a rapid increase at a critical value of the field, kOe. The magnetization reaches saturation in a field of the order 5 kOe. In the subsequent reduction of field strength, magnetization remains practically the same down to 1.3 kOe, which results in large hysteresis. Hysteresis is observed only during the first magnetization cycle, while during the second cycle the magnetization reaches its saturation value in a weak magnetic field. The anomalous behavior of the magnetization curves can be explained by the fact that at a certain critical field strength the martensitic domains are redistributed even before the magnetization vector has time to fully rotate into a position parallel to the magnetic field. The redistribution of the martensitic domains proceeds in such a way that the axis, which is the easy magnetization axis of the tetragonal martensitic phase, aligns itself with the external magnetic field.
Although Ni2+x+yMn1-xGa1-y alloys basically exhibit magnetic properties typical of ferromagnets, some alloys of this system demonstrate unusual magnetic characteristics, such as, say, hysteresis of the ferromagnetic transition and ”metamagnetic” anomalies in alloys with the same temperatures of structural and magnetic phase transitions [76, 77]. Such a situation can be achieved if some of the manganese atoms are replaced by nickel atoms or some of the gallium atoms are replaced by nickel atoms. In the first case the coupled magnetic and structural transition is realized in Ni2+xMn1-xGa [67, 78], while in the second case it is realized in Ni53Mn25Ga22 [79]. Hysteresis of the ferromagnetic transition and the metamagnetic behavior of magnetization near the magnetostructural transition are an indication that for Ni2.18Mn0.82Ga and Ni2.19Mn0.81Ga the magnetic transition has the characteristics of a first-order phase transition [76, 77]. The reason for this is that these alloys undergo a first-order phase transition from the tetragonal ferromagnetic phase into the cubic paramagnetic phase.
IV.2 Magnetocrystalline anisotropy
Magnetocrystalline anisotropy can be considered as the determining parameter for the achievement of giant strains induced by a magnetic field in shape memory ferromagnets. Although it seems, at first glance, that the formation and growth of the structural domains favorably oriented with respect to the magnetic field are in no way related to this parameter, it is precisely this parameter that determines the path along which the system proceeds and reaches the state with the lowest possible energy.
Measurements of magnetization in a Ni51.3Mn24.0Ga24.7 single crystal have shown that the easy magnetization axis in the cubic phase is oriented along the crystallographic [100] axis and that the magnetocrystalline anisotropy constant in this phase is relatively moderate. As a result of the transition to the martensitic phase the magnetocrystalline anisotropy changes significantly. The field dependencies of the magnetization of Ni51.3Mn24.0Ga24.7 in the martensitic phase are shown in Fig. 8a. In these curves one can isolate intervals within which the displacement of the domain walls and rotation of the magnetization vectors in the domain occur.
The redistribution of the martensitic variants that is induced by a magnetic field is superimposed on the intrinsic magnetization processes. To exclude this factor, Tickle and James [80] employed the following procedure in their measurements of magnetocrystalline anisotropy.
A thin single crystal plate measuring mm3 whose faces coincided with the crystallographic planes of the type was fabricated for the measurements. The strategy of the experiment consisted in compressing the sample to a single-variant state in a spring minipress [80]. Measurements of the vs dependence were done in a magnetic field that was parallel or perpendicular to the direction along which the sample was compressed. The sample was first cooled below the martensitic transformation temperature in a 6 kOe magnetic field directed along the compression axis in such a way that both the magnetic field and the applied stress facilitated the formation of a single variant of martensite. The sample size in the direction of compression was selected in such a way that in the martensitic phase the sample would be of a square shape. In this case the demagnetization factors for two orientations of the magnetic field proved to be the same, and the uniaxial anisotropy constant could be evaluated by the area between the curves. The field dependencies of the magnetization of the single-variant martensite (Fig. 8b) show that the axis is indeed the easy magnetization axis and that the curves demonstrate uniaxial anisotropy.
The results of measurements under a 1.9 MPa load were used to calculate the areas between the axis and the curves of magnetization along the easy and hard axes. The uniaxial anisotropy constant in the martensitic phase calculated in this manner erg/cm-3 at K) proved to be greater than the constant in the austenitic phase by a factor of 100.
Studies of the magnetocrystalline anisotropy of single crystals Ni2+x+yMn1-xGa1-y of different compositions (the samples were converted to a single-variant state) have shown that the values of at room temperature vary from erg/cm-3 for Ni48Mn31Ga21 [74] to erg/cm-3 for Ni49.7Mn28.7Mn21.6 [81].
The temperature dependencies of the uniaxial magnetocrystalline anisotropy constant for martensite have been measured for polycrystalline Ni2MnGa [82] and for a Ni48.8Mn28.8Ga22.6 single crystal [83]. For the polycrystalline sample it was found that erg/cm-3 at K. As the temperature is lowered, the value of increases linearly and at 77 K reaches the value of erg/cm-3. The increase in with decreasing temperature has also been observed for a single-variant single crystalline sample of Ni48.8Mn28.6Ga22.6 composition. At 283 K the magnetocrystalline anisotropy constant erg/cm-3, while at 130 K its value proved to be equal to erg/cm-3. The theoretical analysis of magnetocrystalline anisotropy done by Enkovaara et al. [84] showed that magnetic anisotropy changes sign at , which corresponds to a change in the easy magnetization axis from [100] for to [110] for .
Just as the other physical parameters, the magnetocrystalline anisotropy of the Ni2+x+yMn1-xGa1-y alloys varies with the chemical composition of these compounds. The lack of experimental data, however, does not allow us to express this dependence more specifically.
IV.3 Structure of magnetic domains
The structure of the magnetic domains in Ni2+x+yMn1-xGa1-y has been studied in single crystalline thin films [85-87] and bulk single crystals [88] faceted along planes of the type. The results of these studies show that the domain structure of the austenitic phase is formed primarily by domains with magnetization vectors M [100]. The magnetic domain structure changes dramatically upon martensitic transformation, when martensitic variants are formed. In the low-temperature phase several magnetic domains are located within a single martensitic variant. Since adjacent martensitic variants are separated by a twin boundary, this leads to the appearance of a relief on the sample’s surface, and the magnetization vectors in adjacent martensitic variants prove to be directed at a certain angle with respect to each other [85]. The domain structure within a single martensitic variant consists of domains, just as in the austenitic phase. The width of magnetic domains varies from 5 to [88]. When a magnetic field is applied to the sample, the ferromagnetic and martensitic domain structures change. A weak field changes the topology of the ferromagnetic domains which come to resemble a ”herring-bone” structure with a common domain wall coinciding with the twin boundary [85]. As the magnetic field strength is increased further, the processes of reorientation of the magnetic moment in the ferromagnetic domains and of displacement of the boundaries between the martensitic variants begin to compete.
V Dependence of properties on composition
Systematic studies of the ferromagnetic shape memory alloys Ni2MnGa have shown that magnetic and structural transitions occur not only in the stoichiometric alloy but also in cases with significant deviations from stoichiometry [17]. Hence it is only natural to examine the entire system of Heusler alloys Ni2+x+yMn1-xGa1-y in which shape memory can be magnetically controlled. Obviously, finding the composition dependencies of the main physical properties is important in order to effectively use these materials in applications. Since the compositions of studied Ni2+x+yMn1-xGa1-y alloys are located on the triple phase diagram of this system in an arbitrary manner, their main properties are considered in the literature as functions of the average electron concentration per atom, . Such an approach was used by Chernenko [89], who built an empirical dependence of the martensitic transition temperature on the electron concentration . The electron concentration in Ni2+x+yMn1-xGa1-y alloys was calculated using the following electrons configurations of the outer shells and the following numbers of electrons per atom (in parentheses): Ni — 3d84s2 (10), Mn — 3d54s2 (7), and Ga — 4s24p1 (3).
V.1 Ferromagnetic transition
In examining the magnetic properties of Ni2+x+yMn1-xGa1-y alloys, the approach based on using the total electron concentration has certain limitations, since the magnetic moment in these alloys is on the manganese atoms. For instance, can be increased in two ways: without changing the Mn content (substituting Ni for Ga), or by changing the Mn content (substituting Ni for Mn). Obviously, the two ways of changing the electron concentration are not equivalent in the effect on the magnetic properties of Ni2+x+yMn1-xGa1-y. With the exception of Ni2+xMn1-xGa alloys, no systematic studies of the composition dependence of theNi2+x+yMn1-xGa1-y alloys have been done. The dependence of the Curie temperature on the electron concentration is shown in Fig. 9a for a large number of Ni2+x+yMn1-xGa1-y alloys [89]. The Curie temperature was found to depend weakly on electron concentration in the interval ; at higher values of the Curie temperature decreases.
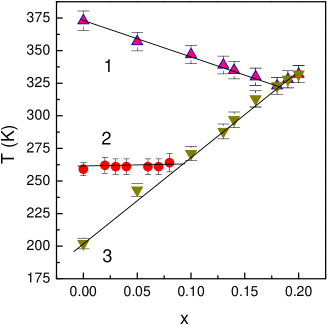
The composition dependencies of magnetic properties for Ni2+xMn1-xGa alloys have been studied in Refs [26, 67, 68, 90, 91]. The phase diagram of these alloys (Fig. 10) clearly shows that the Curie temperature decreases as Ni is substituted for Mn in the interval ; with a further increase in the Ni content the Curie temperature and the martensitic transition temperature merge, and an increase in is observed in the interval . Wang et al. [68] studied Ni2-xMn1+x/2Ga1+x/2 alloys and found that within this concentration range the Curie temperature lowers from roughly 384 K to roughly 370 K . The decrease in the Curie temperature is accompanied by a decrease in the saturation magnetization and the magnetic moment on Mn atoms.
Comparison of the experimental data on the magnetic properties of Ni2+xMn1-xGa and Ni2-xMn1+x/2Ga1+x/2 shows that any deviation from stoichiometry results in a decrease in the Curie temperature and the saturation magnetization. Many experimental observations, such as the decrease in in Ni2+xMn1-xGa alloys [67], the increase in in Ni2Mn ( = Al, Ga, In, Sn, Sb) alloys under pressure [92], the decrease in upon isoelectronic substitution of In atoms for Ga atoms, which leads to an increase in the crystal lattice parameter [93], can be explained by the change in the average distance between the Mn atoms, the carriers of magnetic moment. At the same time, the results of Wang et al. [68] show that a simple increase in the number of Mn atoms per formula unit does not lead to rise in the Curie temperature or to an increase in the magnetic moment of the alloy.
V.2 Martensitic transition
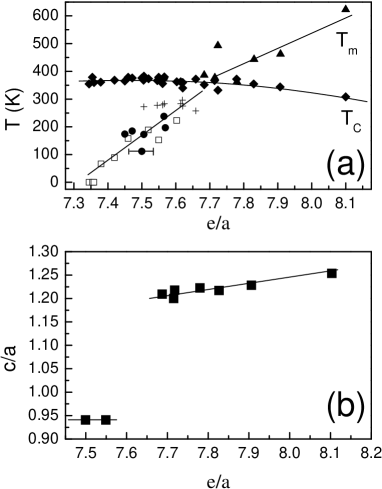
For Heusler alloys the martensitic transition temperature changes substantially under deviations from stoichiometry [17, 67, 68, 91] and under doping [69, 89, 93-95]. As a result of their analysis of the experimental data on Ni2+x+yMn1-xGa1-y alloys, Chernenko et al. [17] concluded that for fixed Mn content the increase in Ga content lowers the martensitic transition temperature . The same effect can be achieved by substituting Mn atoms for Ni atoms with the Ga content constant. Substitution of Mn for Ga with the Ni content constant increases the martensitic transition temperature. The next step in establishing the composition dependencies of was done in Ref. [89], where the martensitic transition temperature of Ni2+x+yMn1-xGa1-y alloys was studied as a function of the electron concentration (Fig. 9a). In alloys with , the martensitic transition temperature increases with electron concentration with a coefficient of roughly 900 K , while for alloys with this coefficient is of the order 500 K . In Ref. [96] the -dependence of is described as K, which makes it possible to define the empirical dependence of on the molar Mn content and the molar Ga content as K. This approach can also be used in examining the composition dependence of the martensitic transition temperature in Ni2+xMn1-xGa alloys (see Fig. 10), since substitution of Ni for Mn increases the electron concentration. The results of Wang et al. [68] are an exception to this empirical formula: they found that under isoelectronic change in composition in Ni2-xMn1+x/2Ga1+x/2 alloys the martensitic transition temperature rises from K to K in the interval . With further increase in the temperature rapidly decreases ( K at and K at ).
V.3 Premartensitic transition
As noted in Section 3.2, premartensitic transitions have been observed in Ni2+x+yMn1-xGa1-y the alloys with relatively small deviations from the stoichiometry and martensitic transition temperatures lower than 270 K. For the family of Ni2+x+yMn1-xGa1-y alloys, the phase diagrams which represent the temperatures of the magnetic, premartensitic, and martensitic transitions as functions of , show that the premartensitic transition temperature increases with electron concentration [31, 35, 72].
Pronounced anomalies at the martensitic transition temperature have been observed, as Fig. 11 shows, in the temperature dependencies of the electrical resistivity of Ni2+xMn1-xGa alloys [27]. The observation of these anomalies has made it possible to modify the phase diagram of Ni2+xMn1-xGa alloys so that it allows for the presence of a modulated premartensitic phase. Figure 10 shows that the premartensitic transition temperature is weakly dependent on the substitution of Mn atoms for Ni atoms in Ni2+xMn1-xGa alloys, which leads to a gradual narrowing of the temperature range within which the premartensitic phase exists, and the phase completely disappears in the Ni2.09Mn0.91Ga alloy.
Zheludev et al. [23] suggested that premartensitic transitions emerge because of nesting singularities in the Fermi surface. Since the premartensitic transition temperature is weakly dependent on deviations from stoichiometry and such a transition is observed only in Ni2+x+yMn1-xGa1-y alloys with K [31], variations in conduction electron concentration have, probably, only a slight effect on the nesting section of the Fermi surface. In alloys with K, martensitic transitions, accompanied by a drastic change of the Fermi surface, occur even before the nesting singularities in the cubic phase have time to manifest themselves. No premartensitic transition is observed in this case.
V.4 Structural distortions
The data in Refs [56, 97, 98] suggest that the ratio , which gives the tetragonal distortion of the cubic lattice caused by the transition to the martensitic state, depends on alloy composition. As Figure 9b shows, for alloys in which the electron concentration . An abrupt change in the tetragonality parameter from to takes place in alloys with . In contrast to the alloys with , for which , in alloys with the martensitic transition takes place in the paramagnetic state.
The exact position of the ”dividing line” for electron concentration, , between the tetragonal phases with and is given in Ref. [98]. This value is characteristic of alloys in which there occurs a combined magnetostructural phase transition, i.e., . It may be assumed that the fact that these two temperatures coincide, which results in an enhancement of magnetoelastic interaction, leads to a considerable increase in the degree of tetragonal distortions of the cubic lattice. In this connection it must be noted that Ni2.16Mn0.84Ga ( and ) and Ni2.19Mn0.81Ga ( and ) alloys have different mechanical properties and, possibly, different martensitic transformation kinetics [99]. Polycrystalline samples of the Ni2.19Mn0.81Ga alloys have been known (through experiments) to rapidly disintegrate under thermocycling through the martensitic transition temperature, while the polycrystalline samples of the Ni2.16Mn0.84Ga alloy prepared by the same method endure multiple thermocycling through without substantial degradation of mechanical properties. Possibly, the rapid disintegration of the Ni2.19Mn0.81Ga samples can be explained by the fact that these samples undergo larger distortions (compared to those in Ni2.16Mn0.84Ga) of the cubic lattice in the martensitic transformation.
VI Magnetostrains in Ni2MnGa
VI.1 Magnetostrain caused by the shift of the martensitic transition
The existence of a structural phase transition in the ferromagnetic matrix opens up new possibilities in magnetically controlling the temperature of this transition. The extent of this control is determined by the difference in the magnetizations of the high- and low-temperature phases. The maximum variation in the linear dimensions of the sample achieved through shifting the structural transition temperature is equal to , where is the variation of the sample volume caused by the structural transition. This is also true for a structural transition of the martensitic type if the distribution of the martensitic variants that form upon the austenite – martensite transformation induced by the magnetic field is isotropic. However, even in polycrystalline samples of a ferromagnetic shape memory the special features of the texture may lead to substantial dilatometric effects of martensitic transformation (up to 0.2%) [100]. In the case of single crystals or highly textured polycrystalline samples, the dilatometric effects can be much stronger. The experimental data taken from Refs [101-105] suggest that upon thermocycling through the martensitic transition temperature the formation of martensitic variants whose orientation is favorable with respect to the applied magnetic field is predominant. Hence the variations of linear dimensions caused by the shift in the martensitic transition temperature in such materials may be much larger than simple transition striction.
If the magnetization of the martensitic phase differs from that of the austenitic phase, application a magnetic field shifts the structural transition temperature, stabilizing the phase with larger magnetization [106]. This effect can be used to obtain giant magnetostrains within the temperature interval of the martensitic transformation. Reports of studies aimed at developing functional Ni2+x+yMn1-xGa1-y-based materials in which giant magnetostrains are obtained through the shift of martensitic transition temperature can be found in Refs [107-111]. Dikshtein et al. [108] observed a reversible shift of the martensitic transition temperature for Ni2+xMn1-xGa alloys that was controlled by a magnetic field. The shape memory effect induced by the magnetic field and the related giant magnetically induced strains have been studied by Cherechukin et al. [109], who used polycrystalline Ni2+x-yMn1-xFeyGa samples. The researchers found that an admixture of iron improves the mechanical properties of Ni2+xMn1-xGa alloys. Samples in the shape of plates were trained for a two-way shape memory effect by thermocycling under a load. The training resulted in an increase in the attainable bending strain from 2% for an untrained sample to 4.5% for the trained sample after multiple thermocycling. The shape memory effect caused by a shift of the martensitic transition temperature induced by a magnetic field was observed for the trained plate of Ni2.15Mn0.81Fe0.04Ga with K. The experiment proceeded as follows. The plate, which in the martensitic state had a curved shape, was subjected to a magnetic field kOe at room temperature. The plate was then heated in this field to 315 K and the temperature was stabilized. In these conditions the bending strain amounted to roughly 3%. When the magnetic field was switched off, the plate passed into the austenitic state and became unbent. Thus, the bending strain % had been induced by the magnetic field kOe.
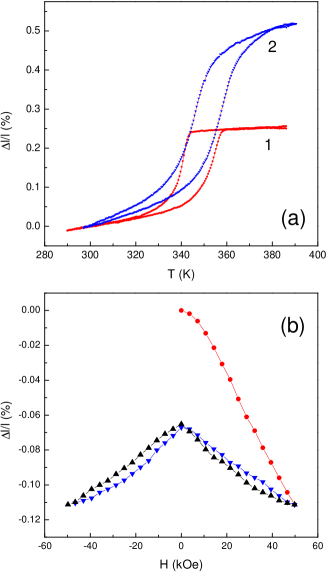
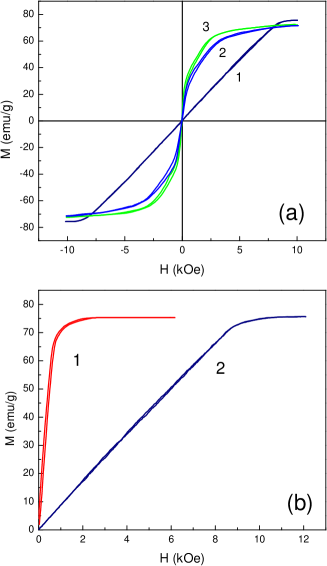
The type of process by which Ni2+xMn1-xGa alloys are prepared strongly affects the magnetomechanical properties of these alloys. One method used in powder metallurgy amounts to sintering the fine powder by an electrical discharge under pressure. The reversible change in the linear dimensions of such samples upon a martensitic transformation reaches 0.2%. Giant magnetostrains in Ni2+xMn1-xGa alloys fabricated by this method have been attained only after preliminary training [111, 112]. The training of a Ni2.18Mn0.82Ga sample amounted to the following. The sample in the martensitic state was subjected to a uniaxial compression of up to 2%. After the sample was unloaded, the residual strain amounted to 1.1%. Upon the first heating - cooling cycle, the sample demonstrated a shape memory effect and almost completely restored its initial shape. Subsequent heating - cooling cycles revealed the presence of a two-way shape memory. Figure 12a shows that the multiple reversible change in the length of this sample in the martensitic transition amounted to 0.5%. Measurements of magnetostrains in the given sample were conducted at a temperature fixed in the interval of direct martensitic transformation. It was found that the increase in the dilatometric effect of the martensitic transformation in the sample with two-way shape memory leads to a rise in the value of magnetically induced strains. In the untrained Ni2.18Mn0.82Ga sample the magnetically induced strain measured in the temperature interval of the martensitic transition did not exceed 0.02%, while in the sample with two-way shape memory the values of magnetically induced strain under the same conditions were as high as %. However, such a strain, as shown in Fig. 12b, was observed only during the first on - off magnetic field cycle, while upon subsequent cycles the reversible value of magnetically induced strain amounted to 0.05%.
These results suggest that the value of magnetically induced strains caused by the shift in the martensitic transition temperature brought on by the magnetic field directly depends on the dilatometric effect of the transformation. Although obtaining large magnetically induced strains through the shift of the martensitic transition temperature requires high magnetic fields, this method has certain potential since the magnetically induced strains in this case are comparable to the striction of the phase transitions induced by a magnetic field in the following alloys, which are being actively investigated: Fe-Rh [113], Mn-As [114], La(FexSi1-x)13 [115], and Gd5(SixGe1-x)4 [116]. Among these materials, La(FexSi1-x)13 exhibits the highest value of linear magnetostriction, % in a 70 kOe magnetic field [115]. The advantage of the Ni2+xMn1-xGa alloys is the possibility of attaining giant magnetically induced strains at temperatures much higher than room temperature, which is important in some applications.
VI.2 Magnetostrain caused by the reorientation of martensitic variants
Shape memory ferromagnetic alloys are unique in the sense that they make it possible to attain giant magnetically induced strains caused by the reorientation of the martensitic variants by a magnetic field. This mechanism was first proposed by Ullakko [117] and was realized by Ullakko et al. [102], who observed a 0.2% strain induced by a 8 kOe magnetic field in a Ni2MnGa single crystal of nonstoichiometric composition with a martensitic transition temperature K. This was followed by the paper of Tickle et al. [118], who used this mechanism to achieve irreversible (1.3%) and reversible cyclic (0.5%) strains induced by a magnetic field kOe in a Ni51.3Mn24.0Ga24.7 single crystal. Finally, in the year 2000, Heczko et al. [74] and Murray et al. [119] reported a 6% magnetic field induced strain in the martensitic phase of single crystalline samples of nonstoichiometric compositions.
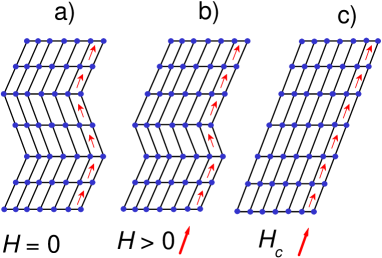
The mechanism by which a magnetic field transforms the magnetic domains is illustrated schematically in Fig. 13 [120]. As is known, the cooling of shape memory alloys to temperatures below leads to the formation of self-accommodated martensitic variants (Fig. 13a). In this representation, the boundaries of the ferromagnetic domains coincide with those of the martensitic variants. Under certain conditions a magnetic field H can lead to growth of martensitic variants whose magnetic moment is oriented favorably with respect to the magnetic field (Fig. 13b). This process changes the shape of the sample. Ideally, at a certain critical value of the magnetic field, , all martensitic variants align themselves along the direction of the magnetic field (Fig. 13c). Such behavior is corroborated by the results of direct optical observations done by Chopra et al. [121] on a Ni53.8Mn23.7Ga22.5 single crystal. Indeed, when a magnetic field is applied to the sample, the volume fraction of favorably oriented martensitic variants was found to increase at the expense of the volume fraction of the unfavorably oriented martensitic variants.
The maximum value of the magnetically induced strain caused by redistribution of martensitic variants is determined by the intrinsic strain in the initial cubic lattice in the martensitic transition, . For instance, for the system of Ni2+x+yMn1-xGa1-y alloys the typical value makes it possible to attain strains of the order of 6%. Magnetic fields needed to achieve such strains are roughly 10 kOe. The giant values of the magnetically induced strain observed in these alloys are caused not only by the large distortions of the initial phase in the martensitic transition but also by the favorable ratio of the effective elastic modulus that blocks the motion of the martensitic domain walls to the uniaxial magnetocrystalline anisotropy constant .
To observe the giant strains induced by magnetic field in Ni2+x+yMn1-xGa1-y alloys, samples are usually placed in a biasing magnetic field or are subjected, prior to experiments, to uniaxial stresses. The same effect can be achieved by changing the orientation of the magnetic field. Moreover, there have been reports about cyclic reproducible magnetically induced strains observed in unstressed samples.
The typical values of magnetically induced strains observed in experiments with unstressed samples are 0.2–2% [68, 70, 94, 102, 104, 122-128]. The highest magnetically induced strains have been observed within temperature ranges from to and from to ; outside these ranges magnetically induced strains are negligible [104, 123]. This suggests that in this case the leading role in generating magnetically induced strains is played by the mobility of the boundaries of the martensitic variants. In addition to observations of magnetically induced strains within the temperature range of the martensitic transition, there have been reports about large (%) reversible variations of the linear dimensions of samples upon thermocycling through the temperatures of martensitic [103, 104] and intermartensitic [70] transitions in the presence of a magnetic field. Such a two-way shape memory effect observed in the presence of a magnetic field can be explained by the predominant growth of martensitic variants that are favorably located with respect to the magnetic field.
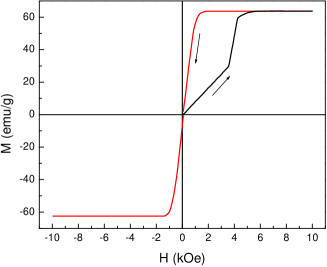
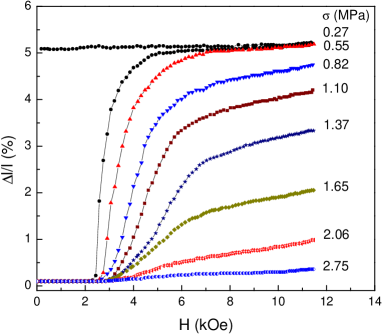
The magnetically induced strains observed in experiments involving prestressed samples or samples placed in a biasing magnetic field or changes in the orientation of the magnetic field may be as high as 6% when [58, 74, 75, 81, 83, 118, 119, 120-140]. Such high values of magnetically induced strains can be explained by the fact that uniaxial compression [119] or the application of a biasing field that is perpendicular to the operating magnetic field [118] facilitates the formation of a single-variant martensitic state. A sample prepared in this way consists of practically one martensitic variant (or, perhaps, several equivalent variants) with the easy magnetization axis directed along the vector of the biasing magnetic field. The application of a magnetic field in the perpendicular direction leads to growth of the martensitic variants whose easy magnetization axes are directed along the operating magnetic field. This occurs if the magnetocrystalline anisotropy energy density exceeds the effective elastic modulus of the displacement of martensitic domain boundaries. Such a process leads to magnetically induced strains of the order of . When the operating magnetic field is switched off in the absence of an external load or a biasing magnetic field, the acquired magnetostrains are preserved. Reversible magnetically induced strain is achieved in the presence of an external load [119, 129] or a biasing magnetic field [118, 122]. Since the magnetically induced strain caused by the transformation of the martensitic variants is observed in weak magnetic fields, it can easily be suppressed by external loads, as shown in Fig. 14.
A comparison of the experimental data for different single crystals shows that the effect of redistribution of martensitic variants depends on many factors. The mobility of martensitic domain walls depends on the method by which the sample was prepared and on the thermal treatment of the sample. For instance, Tickle et al. [118] reported on a reversible magnetically induced strain of 0.5% in single crystal Ni51.3Mn24.0Ga24.7 ( K), and Murray et al. [119] observed a reversible magnetically induced strain of 6% in single crystal Ni49.8Mn28.5Ga21.7 ( K), although the preliminary training that the samples underwent so that a single-variant state could be achieved was almost the same (an external load of about 1 MPa). It is also interesting that the composition of the single crystal used by Murray et al. [119] varied along the direction of growth and that the 6% magnetically induced strain was observed in a sample cut from the beginning of the crystal; for samples cut from the middle of the single crystals no magnetically induced strain was observed [141].
| Composition (at.%) | (K) | MFIS (%) | ( erg/cm3) | References |
|---|---|---|---|---|
| Unspecified | 0.2 | 1.2 | [102] | |
| Ni51.3Mn24Ga24.7 | 0.5 - 1.3 | 2.45 | [118, 122] | |
| Ni52Mn22.2Ga25.8 | 289 | 0.3 | [123] | |
| Ni49.5Mn25.4Ga25.1 | 0.4 | [124] | ||
| Ni48Mn31Ga21 | 301 | 5.1 | 1.7 | [74, 135] |
| Ni48Mn30Ga22 | 308 | 5.0 | [75] | |
| Ni49.8Mn28.5Ga21.7 | 318 | 6.0 | 1.5 | [119] |
| Ni47.4Mn32.1Ga20.5 | 5.7111Shear strain | [130] | ||
| Ni52.3Mn23.1Ga24.6 | 251 | 0.12 | [94] | |
| Ni52Mn24.4Ga23.6 | 276 | 0.6 - 1.2 | [70, 104] | |
| Ni52Mn23Ga25 | 0.27 | [125] | ||
| Ni49.6Mn28.4Ga22 | 0.5 - 5.0 | 1.86 | [81, 131, 132, 134] | |
| Ni49.7Mn28.7Ga21.6 | 5.0 - 5.3 | 2.48 | [81, 131, 132] | |
| Ni46.6Mn29.5Ga23.9 | 2.2 | [235] | ||
| Ni48.1Mn29.4Ga22.5 | 270 | 0.3 | 1.5 | [81] |
| Ni48.2Mn30.8Ga21 | 307 | 7.3 | 2.13 | [81] |
| Ni48.7Mn30.1Ga21.3 | 302 | 4.5 | [133] | |
| Ni53Mn22Ga25 | 1.8 | [68] | ||
| Ni48.8Mn29.7Ga21.5 | 337 | 9.5222 Irreversible strain in the seven-layered martensitic phase | [59] | |
| Ni49Mn29.6Ga21.4 | 306 | 3.8 | [136, 137] | |
| Ni48.8Mn28.6Ga22.6 | 5.0 | 2.0 | [83] | |
| Ni48.5Mn30.3Ga21.2 | 297 | 6.0 | 1.7 | [58] |
| Ni49.7Mn29Ga21.3 | 2.6333At a frequency of 2 Hz under an external load of 1.86 MPa | [140] |
The existing data on magnetically induced strains (MFIS) in single crystalline Ni2+x+yMn1-xGa1-y caused by the redistribution of the martensitic variants are systematized in Table 1. These data suggest that giant magnetically induced strains are observed as in alloys with slight deviations from stoichiometry, as in alloys with a considerable excess of manganese. The largest values of magnetically induced strains have been achieved in samples with Mn content higher than 28 but lower than 31 at.% [58, 74, 75, 81, 83, 119, 131-140].
Shanina et al. [81] assumed that the free electron concentration plays an important role in achieving giant magnetically induced strains in Ni2+x+yMn1-xGa1-y alloys. Studies of non-stoichiometric alloys with different values of magnetically induced strain revealed that alloys with a high concentration of free electrons exhibit the largest magnetically induced strain. Such alloys have the most pronounced metallic nature of the interatomic bonds.
VII Shape memory intermetallic compounds
In addition to the Heusler alloys Ni2+x+yMn1-xGa1-y discussed above, structural phase transformations of the martensitic type in the ferromagnetic matrix occur in several other Heusler alloys, in ternary intermetallic compounds Co-Ni-Al and Co-Ni-Ga, and in iron-based alloys such as Fe-Pd, Fe-Pt, and Fe-Ni-Co-Ti. In this section we will also mention some ferromagnets in which the martensitic transition is of a nonthermoelastic nature.
The giant magnetically induced strains achieved in Ni2+x+yMn1-xGa1-y alloys have stimulated the search for, and intensive studies of, shape memory ferromagnets based on other representatives of Heusler alloys. In this respect the alloy that is being most actively investigated is Ni2MnAl. As for Cu2MnAl-based Heusler alloys, they retain their ferromagnetic properties only when deviations from stoichiometric composition are small. Although a substantial decrease in Mn content in these alloys does lead to the emergence of a martensitic transition, it is accompanied by degradation of the ferromagnetic properties, so that the compounds begin to resemble a superparamagnet or spin glass.
Many intermetallic compounds experience ferromagnetic and structural transitions of the martensitic type. In some of these compounds, however, the type of martensitic transition (thermoelastic or nonthermoelastic) has yet to be established. In many compounds the structural transformation temperature exceeds the Curie temperature , which makes it impossible to attain giant magnetically induced strains via the shift of the martensitic transition temperature. The processes of redistribution of martensitic variants in the compounds described in the sections below have never been studied, which makes it possible to think of these compounds as materials in which magnetic control of the shape memory effect is possible.
VII.1 Fe–Ni–Co–Ti
The low-temperature body-centered tetragonal -phase in iron and its alloys is ferromagnetic. Hence for iron alloys one of the necessary conditions for strain caused by the redistribution of martensitic variants in a magnetic field to appear is met. If such elements as nickel, manganese, ruthenium, carbon, or nitrogen are added to iron, the temperature of the polymorphic transformation lowers, and with a sufficiently high content of doping elements this transformation proceeds according to the martensitic mechanism. It would seem that iron alloys are ideal materials for attaining giant strains induced by a magnetic field. This is not the case, however: neither a pronounced shape memory effect nor a giant magnetically induced strain has been observed in iron alloys. The reason is that the martensitic transformation in iron alloys is not thermoelastic. The high-temperature phase has a low elastic limit. The Bain strain, which describes the transformation of the high-temperature fcc lattice into the low-temperature body-centered tetragonal lattice, incorporates compression of 17% along the cubic axis of the high- temperature phase and elongations of roughly 12% in the directions perpendicular to this axis. The symmetry of the low-temperature phase allows for the formation of several crystallographic variants of the high-temperature phase in the reverse transformation.
The situation can be improved by narrowing the gap between the lattices of the austenitic and martensitic phases and by raising the elastic limit of both phases. To achieve this, the alloy should be doped in such a way so as to cause particles that are coherently coupled to the matrix to precipitate in the high-temperature phase. After the martensitic transformation is completed, the precipitate is inherited by the martensite, and the low-temperature phase experiences tetragonal distortions. As a result, the structures of the initial and martensitic phases resemble each other more closely and the intrinsic strain in the transformation diminishes. The presence of a precipitate strengthens both the austenitic phase and the martensitic phase and, as a result, hampers the process of generation of plastic strain in the transformation. This idea was expressed by Kokorin and Chuistov [142] and was soon corroborated by experiments: a thermoelastic martensitic transformation was realized in Fe57Ni23Co10Ti10 after aging of the low-temperature martensitic phase of this alloy [143].
Kakeshita et al. [144] reported their observations of a martensitic transformation induced by a magnetic field in an Fe43Ni33Co10Ti4 alloy (weight fractions) with K. Since the magnetic field was switched on when , the rise in the martensitic transformation temperature is caused by the difference in the magnetizations of the austenitic and martensitic phases. The martensitic transformation induced by the magnetic field may be accompanied by changes in the linear dimensions of the sample, but such a measurement was not performed in Ref. [144].
VII.2 Fe–Pd
Fe–Pd alloys, which are close in composition to Fe3Pd, can undergo a thermoelastic martensitic transformation with small hysteresis from the fcc phase to the face-centered tetragonal phase with [145-147]. The structural transformation is preceded by a softening of the elastic modulus [148, 149]. The highest temperature at which the martensitic transition occurs in the Fe–Pd system, , is approximately 273 K and rapidly decreases with increasing Pd content [147, 150]. Admixture of Ni or Co also significantly lowers [150]. The tetragonality parameter of the martensitic phase rapidly increases with decreasing temperature [151] and in Fe70.3Pd29.7 reaches the value of 0.91 at 153 K.
Systematic studies of the composition dependence of the Curie temperature for Fe–Pd alloys have yet to be carried out. For the Fe70Pd30 alloy, the Curie temperature K [152] and varies little with Pd content. At 333 K in the austenitic phase of Fe70Pd30 the saturation magnetization is roughly 1100 emu/cm3 and the magnetocrystalline anisotropy constant is erg/cm3 [152]. The fact that is negative implies that the easy magnetization axis is directed along the axis. The alteration of the crystal structure in the process of martensitic transformation strongly affects the magnetic properties of Fe–Pd alloys. The saturation magnetization of the martensitic phase of Fe3Pd is equal to 1400 emu/cm3 and is weakly temperature-dependent [153, 154]. Measurements of the uniaxial magnetocrystalline anisotropy constant of the martensitic phase carried out on polycrystalline samples by Matsui and Adachi [155] and Klemmer et al. [156] revealed a large value of , roughly 107 erg/cm3, which implies that the coupling of the elastic and magnetic subsystems is sufficiently strong for the emergence of magnetically induced strains caused by the redistribution of the martensitic variants. Note, however, that Cui and James [152] recently observed a much smaller uniaxial magnetocrystalline anisotropy constant erg/cm3 in an Fe70Pd30 single crystal. There is also contradictory information about the direction of the easy magnetization axis in the martensitic phase. For instance, Matsui and Adachi [155] and Muto et al. [157] reported that the easy magnetization axis in the martensitic phase is directed along [001]. On the other hand, there have been reports (see Refs [152, 154]) of measurements involving single crystalline samples converted to a single-domain state in which the [001] axis was found to be the hard magnetization axis, while the easy magnetization axis was found to be directed along [100]. These contradictions are probably a reflection of the experimental difficulties in determining the magnetic parameters of the low-temperature phase, difficulties caused by the existence of martensitic variants with different crystallographic orientations.
Studies of magnetically induced strains in the martensitic phase of Fe70Pd30 have been conducted by James and Wuttig [154]. Under the combined action of uniaxial stresses and the operating and reference magnetic fields, a 0.6% strain caused by the redistribution of martensitic variants was reached in the martensitic phase of a single-crystal sample.
Magnetically induced strain in an Fe68.8Pd31.2 single crystal alloy with a martensitic transition temperature of 225 K has been studied by Koeda et al. [158]. The experiment was conducted in the following way: first the sample was cooled to liquid nitrogen temperature, and then it was subjected to a cyclic magnetic field with a strength of up to 40 kOe (the direction of the magnetic field was changed from positive to negative). In the first on–off magnetic-field cycle the sample elongated by 3%, while in the subsequent cycles the reversible value of the magnetically induced strain amounted to roughly 0.1%.
Furuya et al. [159] and Kubota et al. [160] studied the magnetically induced strain in ribbon samples of the Fe70.4Pd29.6 prepared by quenching from melt. The grains of the quenched samples were elongated along the direction of rolling, and the variable parameters were the rate of quenching from the liquid state and the annealing time; these parameters determine the size distribution of the grains, the nature of the grain boundaries, and the extent to which the grains are texturized. A magnetic field of up to 10 kOe was applied perpendicularly to the surface of the ribbon. The greatest strain was observed in samples with grains whose (100) plane was parallel to the sample surface. The strain induced by the magnetic field increased with temperature up to 0.18% (note, for the sake of comparison, that the magnetostriction of the Terfenol-D, Fe2Tb0.37Dy0.23, in a 10 kOe field is 0.17%).
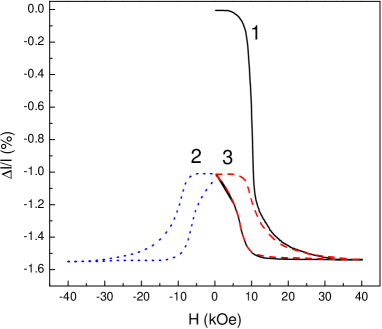
VII.3 Fe–Pt
In disordered Fe–Pt alloys, which are close in composition to the stoichiometric alloy Fe3Pt, the martensitic transformation from the high-temperature fcc phase to the low-temperature body-centered tetragonal phase proceeds with substantial (up to 450 K in the Fe76Pt24 alloy [161]) hysteresis. The degree of shape restoration in the heating of a sample that had been deformed in the martensitic state is small. Annealing leads to the ordering of these alloys in a Cu3Au (L12) structure. Such ordering is accompanied by a rise in the Curie temperature [162] and a drop in the martensitic transition temperature and leads to a substantial decrease in hysteresis [161] and the appearance of the shape memory effect [163-168].
As a result of atomic ordering, the martensitic transformation changes from non-thermoelastic to thermoelastic. The transition proceeds to the low-temperature face-centered tetragonal phase and is preceded by a softening of the lattice of the high-temperature phase as the martensitic transformation temperature is approached [169]. The ordering makes the lattices of the initial and martensitic phases resemble each other more closely, facilitates elastic accommodation, and eliminates plastic relaxation of the stresses generated in the process of formation of martensite crystals in the initial phase.
The Curie temperature of Fe3Pt is roughly 450 K, so that the austenitic and martensitic phases in alloys close in composition to the stoichiometric alloy are ferromagnetic [170]. Thus, the conditions needed for observing magnetically induced strains (thermoelastic martensitic transformation and the ferromagnetism of the martensite) in ordered Fe–Pt alloys are met.
Magnetically induced strains in the single crystal Fe3Pt, whose martensitic transformation temperature is 97 K, have been studied by Kakeshita et al. [171]. The lattice constant of the cubic L12 phase at 100 K is 3.73 Å, and the lattice parameters of the body-centered tetragonal martensitic phase at 77 K are Å and Å, so that . The researchers did not determine the direction of the easy magnetization axis – it was assumed that this is the axis, as in Ni2MnGa.
The sample cooled to liquid helium temperatures was subjected to a cyclic magnetic field with a strength of up to 40 kOe. As Figure 15 shows, when the field was switched on for the first time, the sample contracted by 1.5% along the direction of the field, and became 0.5% longer when the field was switched off. Subsequent on–off magnetic-field cycles revealed a reversible change in the sample length of %, but hysteresis was substantial (up to about 10 kOe).
VII.4 Ni2MnAl
The ordered high-temperature phase of the ternary system Ni–Mn–Al undergoes a thermoelastic martensitic transformation upon cooling [172-174]. The degree of ordering of the high-temperature phase depends on thermal treatment: under quenching from temperatures higher than 1000 ∘C austenite has a B2 structure which, however, changes to L21 structure after ageing the samples at temperatures ranging from 350 to 400 ∘C [174]. The crystal structure of the martensitic phase and the martensitic transformation temperatures in Ni–Mn–Al alloys depend on composition [172-175]. For instance, for Ni50+xMn25Al25-x alloys the temperature of the onset of the martensitic transition, , is in the interval from 200 to 250 K for [176, 177].
Neutron diffraction studies at liquid helium temperatures have shown [178] that Ni2MnAl of stoichiometric composition has antiferromagnetic ordering. The type of magnetic ordering in Ni–Mn–Al alloys strongly depends on the chemical ordering of the high-temperature phase, which changes under thermal treatment. Quenched samples have the B2 structure of the austenitic phase, and they exhibit either antiferromagnetism or a spin glass state. Ageing the samples after quenching leads to the formation of the L21 structure of the austenitic phase, which has a ferromagnetic ordering with a Curie temperature K [176].
Fujita et al. [179] used the capacitance dilatometer method to study the strains induced by magnetic fields in polycrystalline and single crystalline Ni53Mn25Al22. For polycrystalline samples of this alloy with K the value of the magnetostrain was found to be temperature-dependent. The maximum strain of roughly 0.01% was observed at 228 K. The researchers assumed that this was due to the presence of a small amount of the austenitic phase near , which facilitates the movement of the boundaries of the martensitic variants [104]. In a 70 kOe field, the magnetically induced strain in the single crystal sample amounted to 0.1%.
VII.5 Co–Ni–Al, Co–Ni–Ga
Enami and Nenno [180] established that the Ni–Al alloy with a B2 structure exhibits the shape memory effect. The influence of a cobalt admixture on the shape memory effect in Ni–Al was studied by Kainuma et al. [181], who found that Co–Ni–Al alloys may undergo a thermoelastic martensitic transition and that the temperature of this transition decreases with increasing the Co content. The researchers also found that austenite in these alloys is actually a two-phase solid solution, and because of this the polycrystalline Co–Ni–Al alloys exhibit good plastic properties.
In addition to the Co–Ni–Al alloys, ternary Co–Ni–Ga alloys have been studied. It was found [182-184] that these alloys also exhibit shape memory and, in the case of a two-phase microstructure, have good plastic properties. Shape memory in Co45Ni25Ga30 and Co40Ni33Al27 was studied by the three-point bending method involving lamellar samples whose austenitic phase had a two-phase microstructure. It was found that the initial shape of the samples was not restored after the stresses were removed, which, probably, is due to the presence of residual ”inclusion phases”.
The field and temperature dependencies of the magnetization of Co–Ni–Al and Co–Ni–Ga exhibit a behavior typical of ferromagnetic materials. The dependence of the martensitic and ferromagnetic transition temperatures on composition in Co–Ni–Al and Co–Ni–Ga has been studied in Refs [182-185]. In Co–Ni–Al with fixed Al content (at 30 at.%), the martensitic transition temperature increases and the Curie temperature decreases as Ni content grows from 30 to 45 at.%. An important feature of the phase diagram built by the researchers is that, as in the case of Ni2+xMn1-xGa alloys, and merge at K when Ni content reaches at.%. A further increase in Ni content makes higher than and the martensitic transition takes place in the paramagnetic phase. Such concentration dependencies of and were also found to exist for Co–Ni–Ga alloys. For instance, with Ga content fixed (at 30 at.%), the martensitic transition temperature increases and the Curie temperature decreases as Ni content grows from 18 to 33 at.%. For the Co47Ni23Ga30 alloy, the temperatures and merge at 370 K.
Morito et al. [186] found that the value of the magnetocrystalline anisotropy of the martensitic phase of Co–Ni–Al, when measured in single crystal Co37Ni34Al29, amounts to erg/cm3. This value is comparable to the magnetocrystalline anisotropy constants of Ni2+x+yMn1-xGa1-y alloys [81]. Measurements of magnetically induced strain caused by the redistribution of martensitic variants have shown, however, that the reversible magnetically induced strains in this intermetallic compound do not exceed 0.06%, which is smaller than the values for Ni2+x+yMn1-xGa1-y alloys by a factor of 100. Morito et al. [186] assumed that this is because the sample was not in a single-variant state and hence only a fraction of the maximum attainable magnetically induced strain was detected. The crystal structure of martensite in Co37Ni34Al29 (L10, ) also differs significantly from that in Ni2+x+yMn1-xGa1-y alloys, a factor that could affect the mobility of the martensitic variants.
VII.6 Co2NbSn
The ferromagnetic Heusler alloy Co2NbSn undergoes a martensitic transformation when it is cooled. The temperature of this martensitic transition, K, is much higher than the ferromagnetic ordering temperature K [187]. In the low-temperature phase this compound has an orthorhombic crystal lattice with parameters Å, Å, and Å [69, 188]. The magnetic moment in Co2NbSn is on the cobalt atoms and amounts to approximately at 4 K [189]. Studies of the magnetic properties of the martensitic phase of Co2NbSn have shown (see Refs [188, 190, 191]) that magnetization does not reach saturation in fields up to 5 T. Such measurements conducted with the Co50.4Nb25Sn12.9Ga11.7 alloy which does not undergo a martensitic transformation, have shown that magnetization becomes saturated in fields of approximately 0.5 T. Ohtoyo et al. [188] assumed, on the basis of these measurements, that large magnetocrystalline anisotropy is a characteristic feature of the martensitic phase of the Co2NbSn alloys. Variations in composition [188] and doping of Co2NbSn with Ni [69], V, Ga, and Al [192] do not lead to a rise in the Curie temperature . However, the temperature of the martensitic transition decreases. For instance, in the Co50Nb25Sn20Ga5 alloy, K but K [192].
VIII Theory of phase transitions in cubic ferromagnets
The experimental data suggest that both structural and magnetic phase transformations occur in ferromagnetic alloys with shape memory. Moreover, within certain intervals of structural and magnetic parameters of ferromagnets these transformations overlap. Intensive experimental studies of shape memory ferromagnets have stimulated the development of the theory of coupled structural and magnetic transformations.
Theoretical investigations of the interaction of the structural and magnetic order parameters in various crystals have been carried out by many researchers. The results of earlier work of this kind have been gathered and generalized in Izyumov and Syromyatnikov’s monograph [193]. Many theorists have also examined the transition from the cubic phase to the tetragonal in various crystals. Landau theory of phase transitions has been used to describe the given transition. This theory was used to study transitions only in the elastic subsystem [193-198] and transitions in systems where the structural and magnetic order parameters interact [22, 199]. As applied to phase transitions in Ni2+xMn1-xGa alloys, Landau theory has been developed in Refs [66, 67, 91, 200-215].
VIII.1 Total energy
The sequence of phase transformations in Ni2+xMn1-xGa alloys observed in experiments can be described by Landau theory for coupled structural and magnetic phase transitions. The special features of the crystal and magnetic structures of the ferromagnetic Heusler alloys Ni–Mn–Ga require the introduction of three interacting order parameters describing the variation of the structure of the crystal lattice, its modulation, and the magnetization. Within this system of parameters, both the ferromagnetic cubic state and the ferromagnetic tetragonal state (both modulated and unmodulated) can exist at low temperatures.
The distortions of the cubic lattice upon structural transitions are described by homogeneous strains written in the form of linear combinations of the components of the strain tensor [216]:
| (1) | |||||
The strain , which reflects changes in volume, does not violate lattice symmetry. Symmetry breaking occurs because of the strains and , responsible for the transition of the lattice from the cubic phase to the tetragonal. The given transition is accompanied by the softening of the elastic moduli combination . The complete expression for the free energy density, which describes the transition to the tetragonal state, must contain the strains , , and , which lead to the distortion of the unit cell to a symmetry lower than the tetragonal.
In describing the modulated state in the crystal brought on by the presence of acoustic phonon modes of the type , we must bear in mind that there are six different directions of the modulation wave vector. They can be written as follows: , , , , , and , where . In view of this, there should, as a rule, exist an order parameter containing twelve components (six amplitudes and six phases): and , where . The atomic displacements corresponding to each of these order parameters have the form , where are the unit polarization vectors directed along the axes , , , [110], [011], and [101], respectively.
The expression for the free energy density, which describes structural transitions from the cubic phase, must be invariant under spatial transformations of the point symmetry group . It consists of terms of three types:
| (2) |
Here is the elastic energy density, which contains terms responsible for the anharmonicity of the elastic subsystem with respect to the order parameter (). The expression for it has the form [216]
| (3) |
where the coefficients , , and are linear combinations of the components of the elastic moduli of the second, third, and fourth orders, respectively:
| (4) | |||||
Since the right-hand side of Eqn (3) contains terms of the third order, the phase transition in the parameter (, ) is a first-order transition. As the point of the structural transition to the tetragonal phase is approached, the elastic modulus tends to zero, and near the transition point () it can be represented in the form , where is the temperature of the martensitic transition.
The complete expression for can be found in Refs [217, 218]. Here we consider the simplest version of modulation, which allows for only one phonon mode (110). It is described by the order parameter (to simplify the notation, we have dropped the index ), which makes it possible to write the expression for the density of the modulation part of the free energy in the form
| (5) |
The last term of this equation is minimized with respect to the phase:
The minimum of the energy (5) occurs at , , if and at , , , if . In equation (5) we introduce the quantity and, for the sake of stability, assume that . The parameter is temperature-dependent, and near the temperature of transition to the modulated state () it can be written in the form [20, 219, 220].
The part of the free energy density, , that connects the strain, , and the order parameter describing modulation must be invariant under all symmetry operations related to and . If we allow for the phonon mode (110) only, the expression for has the form
| (6) |
Equations (3), (5), and (6) completely determine the free energy density of a cubic crystal, which makes it possible to describe structural phase transitions from the cubic phase to phases of lower symmetry.
Experiments have shown that structural transformations in Ni2+xMn1-xGa alloys take place in the ferromagnetic matrix, which makes it necessary to take into account the effect that the magnetic subsystem has on the structural transitions. In these alloys Mn atoms are the main carriers of magnetic moments, both in the cubic and in the tetragonal phases [14]. This makes it possible to describe Ni2+xMn1-xGa alloys using the model of a single-sublattice magnetic subsystem with a macroscopic magnetization vector M. In describing the behavior of the magnetic subsystem we introduce, for the sake of convenience, the dimensionless magnetization vector , where is the saturation magnetization.
The contribution of the magnetic subsystem to the total energy of the cubic ferromagnet consists of two parts. The first is of exchange origin and is needed to allow for the dependence of the magnetization vector m on temperature. This term can be written as follows:
| (7) |
Here and are the exchange constants. The parameter of the exchange interaction is temperature-dependent and near the Curie point, , can be written as . The second term is the magnetic anisotropy energy of the cubic ferromagnet, which can be written as
| (8) |
where is the first cubic anisotropy constant.
The expression for the free energy must also contain a terms that relate the components of M with the other order parameters of the system. The first of such terms connects the magnetization components with the strains and has the form
| (9) |
This formula is the simplest expression for magnetoelastic energy with phenomenological magnetoelastic constants , , and .
The second term describes the interaction between the magnetization vector components and the order parameter and can be written as follows:
| (10) |
Here the coefficients are the coupling parameters between the magnetic and modulation subsystems.
As a result, we arrive at the following final expression for the free energy density:
| (11) |
This expression for the free energy density contains variables that are not responsible for phase transitions, i.e., variables that are indirect order parameters: , , , and . After the free energy is minimized in all these variables, some of the constants in Eqn (11) become renormalized:
After such renormalization has been carried out, the expression for the free energy density of the cubic ferromagnet becomes
| (12) |
VIII.2 Phase diagram at
In Ni2+xMn1-xGa alloys the temperatures of the structural and magnetic phase transitions strongly depend on composition. In view of this it would be interesting to study the phase diagrams at (compositions close to stoichiometric) and at (compositions with ). The review of the experimental research in magnetic anisotropy measurements (see Section 4.3) suggests that the first cubic- anisotropy constant also depends on composition. For instance, in alloys close to the stoichiometric composition, the constant is positive [80], while in alloys with considerable deviations from stoichiometry it proves to be negative [81]. In view of this, when describing phase transitions in Ni2+xMn1-xGa alloys by theoretical means, both cases, and , must be considered. It has turned out that the second case leads to more complicated phase diagrams than the first (see Refs [66, 67, 91, 200-210] and [211-215] for and , respectively). In view of this we will focus on the case where . The interested reader can find material on the case in the above-cited works [66, 67, 91, 200-210]. To be more definite, we assume in what follows that the magnetostriction constant is positive (this follows from the measurements of magnetostriction constants [80]) and that the fourth-order elastic modulus . But first we assume that there is no lattice modulation, i.e., .
We begin with the case where the structural transition takes place in a ferromagnetic matrix (). Here in formula (12) we can put and go from the Cartesian coordinates , , and to the polar and azimuthal angles of this vector. Minimization of the free energy (12) in respect to , , , and leads to the following equilibrium states.
1. Cubic (C) and tetragonal (T) phases with magnetizations along the [001] axis and with strains determined from the equations
| (13) |
are stable at and exist in the region specified by the inequality
| (14) |
At the regions of existence of these phases are separated by the branches of the discriminant curve
| (15) |
of the cubic equation (13). Inside the region bounded by the branches of the discriminant curve (15), both phases are stable.
2. The orthorhombic (R) phase with magnetization along the [001] axis () and with strains determined from the equations
| (16) |
is stable at
| (17) |
For there is a region in which a metastable phase R′ coinciding in symmetry with the phase R is stable, while for there is a region in which a metastable phase C′(T′) coinciding in symmetry with the phase C(T) is stable. The signs of the strains in the metastable phases are opposite to those of the given strains in the phases R and C(T). The existence regions of the metastable phases are bounded by the following curves. At (phase R′),
| (18) |
and at [phase C′(T′)],
and the discriminant curve (15).
Note that according to Eqn (1), the sign of the strain determines the sign of (here and are the structural lattice parameters). At the quantity is positive, while at it is negative. If we assume that the elastic moduli also depend on the composition of the Ni2+xMn1-xGa alloys, equations (16) – (18) suggest that at certain values of stable and metastable phases of different symmetries may coexist in these alloys. This fact agrees with the experimental results of Inoue et al. [221, 222], who observed martensitic phases of different symmetries.
Symmetry considerations suggest that in addition to the above states in the ferromagnet there can be similar phases with magnetizations along the [100] and [010] axes, states whose energies and regions of existence coincide with those given above.
Analysis of distortions of the initial cubic lattice in phases C and T shows that these phases have the same tetragonal symmetry and differ only in the values of spontaneous strains. In the C phase these strains are determined by the distortions of the cubic lattice caused by magnetostriction, while in the T phase they are determined by structural distortions in the transition to the martensitic state. The phase transition lines between the states C, T, and R are determined by the condition that the phase energies (12) be equal.
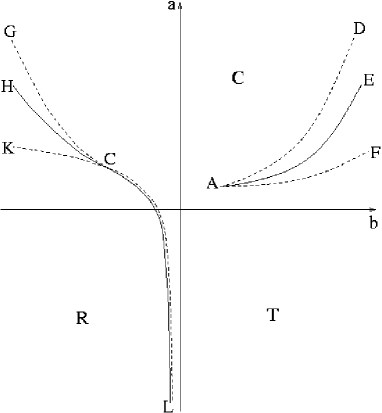
The phase diagram of the cubic ferromagnet in the plane at is depicted in Fig. 16. Depending on the values of the elastic moduli of the second and third orders, the following structural transformations can occur in the ferromagnet. At , a first-order phase transition from phase C to phase T occurs on the line determined by the equation
| (19) |
This transition is accompanied by a discontinuity of the strain and is a martensitic transformation. In relation to symmetry, it is an isostructural transition and ends at point (the critical point) with coordinates and . To the left of point the transition from phase C to phase T proceeds smoothly, without discontinuity in . At , a martensitic transformation (a first-order structural phase transition) from the cubic phase C to the orthorhombic phase R, accompanied by discontinuities in the strains and , occurs on the line . On the line a second-order structural phase transition between these two phases occurs. The expression for the line of a first-order phase transition can be found by equalizing the energies of phases C and R. Line of a second-order phase transition is determined by using the equal sign in Eqn (14). The critical point where the first-order phase transition is terminated has the coordinates
Clearly, the coordinates of the points and are determined by the size of the magnetostriction . At the phase diagram coincides with that of a nonmagnetic cubic crystal [193].
VIII.3 Phase diagram at
Now let us examine the phase diagram of the cubic ferromagnet for the case where the temperatures of the martensitic () and magnetic () transitions are close. In this situation, to find the equilibrium states of the cubic ferromagnet, the free energy (12) must be minimized with respect to the variables , , , , and . To be more definite, we will assume here that and that the signs of the other quantities are the same as in the case where (the case with and has been examined in Ref. [207]).
Minimization of Eqn (12) leads to the following equilibrium states of the ferromagnet.
1. The paramagnetic cubic (PC) phase:
| (20) |
The PC phase is stable at and .
2. The paramagnetic tetragonal (PT) phase:
| (21) |
The PT phase is stable at
| (22) |
3. The ferromagnetic cubic (FC) phase and the ferromagnetic tetragonal (FT) phase with magnetization along the [001] axis,
| (23) |
and with strains specified by the equations
| (24) |
The FC phase is stable at
| (25) |
while the FT phase is stable at
| (26) |
The stability region for the phases FC and FT is also bounded by the inequalities
| (27) |
which follow from the condition that .
Symmetry considerations suggest that, in addition to the above states, other equilibrium phases with energies and stability regions coinciding with the former ones can take place in the crystal. Among these are tetragonal paramagnetic phases with strains along the [100] and [010] axes, ferromagnetic cubic phases with magnetizations along the [100] and [010] axes, and tetragonal phases with strains and magnetizations along the [100] and [010] axes.
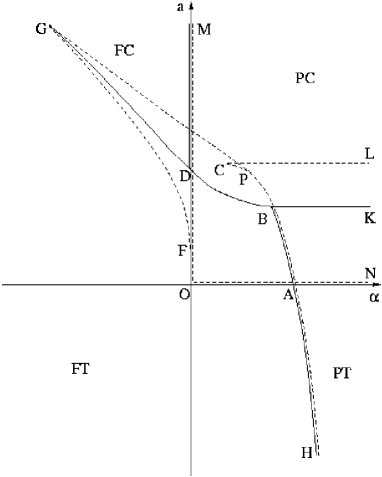
As in the case where , in the stability regions of the stable phases there can also be metastable phases of other symmetries with energies close to those of the stable phases. Similarly, analysis of the distortions of the cubic lattice in the FC and FT phases, which are determined by equations (24), shows that, from the viewpoint of symmetry, these phases have the same, tetragonal, symmetry. The two phases differ in the values of the spontaneous strains . In the FC phase they are determined chiefly by magnetostriction, while in the FT phase they are determined chiefly by structural distortions that emerge as a result of the transition to a martensitic state.
Figure 17 is the phase diagram of a cubic crystal at in the plane. The following phase transitions from the cubic phase PC are possible. On the line , given by the equation , there occurs a first-order structural phase transition to a paramagnetic tetragonal phase PT with large lattice distortions (a martensitic transformation). Along the line () there proceeds a second-order magnetic phase transition to a ferromagnetic cubic phase FC with small tetragonal lattice distortions. On the line there occurs a first-order coupled structural and magnetic phase transition to a ferromagnetic tetragonal phase FT with large tetragonal lattice distortions. The equation of this line can be found by equalizing the energies of the phases PC and PT. In addition to the above PT–PC transition on the line , there can occur a second-order isostructural magnetic phase transition from the paramagnetic tetragonal phase PT to a ferromagnetic tetragonal phase FT along the line . The equation of this line follows from the second condition of stability of the FT phase in Eqn (26) if the inequality sign is replaced by the equality sign. Between the ferromagnetic phases FC and FT there can occur a first-order isostructural phase transition on the line . The equation of this line is
| (28) |
The given transition is accompanied by a discontinuity in the strain and is a martensitic transformation. Its termination point in the () plane may be the point . This happens if the point is located to the right of the line of stability of the FC and FT phases in Eqn [27] (we have not depicted this line so as not to clutter up the figure). Analysis of inequality (27) and equation (28) combined with conditions (25) and (26) of stability of the FC and FT phases shows that the point of termination of the phase transition of FT and FC phases will exist only at large values of the magnetoelastic constant . In this case the transition between the FT and FC phases to the left of point proceeds smoothly, without a discontinuity in the strain .
The region of absolute stability of the PC phase is limited by the lines and . For the PT phase this region is limited by the lines and . The FT phase is absolutely stable in the region to the left of the line and the FC phase above the curve . The points and are critical: at these points the line of second-order phase transitions splits into two lines of first-order phase transitions. The coordinates of points and are
Our analysis of the effect of magnetoelastic interaction on the phase diagrams of the cubic ferromagnet shows that when the first anisotropy constant is positive, structural phase transitions are not accompanied by reorientation of magnetization. The explanation is that, strictly speaking, the magnetoelastic interaction already in the cubic phase lowers the symmetry of this phase to tetragonal. The symmetry of the low-temperature phase proves to be either tetragonal () or orthorhombic (). And because the high- and low- temperature phases contain the same symmetry elements (say, 2-fold and 4-fold axes), no reorientation of magnetization occurs in structural transitions.
When the symmetries of the high- and low-temperature phases coincide perfectly (), the line of structural phase transition may have a termination point. To the right of this point a structural transition is accompanied by a discontinuity of strains and by hysteresis and represents a martensitic transformation. To the left of this point there is no transition the strains gradually change their nature from quasicubic to tetragonal, and there is no hysteresis. When , the symmetries of the low- and high-temperature phases do not coincide. In this case, at large values of the structural transition between the phases is a first-order phase transition (a martensitic transformation), while at small values of the transition is of the second order. Thus, at we have a critical point in the phase diagram (at this point the type of transition changes). The coordinates of the structural-transition termination point at and the critical point at are determined by the magnetostriction constant . The presence of magnetoelastic interaction leads to a situation in which within a certain interval of the parameters of the cubic ferromagnet there occur first-order coupled structural and magnetic phase transitions. The size of this interval in the phase diagram where such transitions occur is determined by the magnitude of the magnetoelastic interaction.
VIII.4 T vs. x phase diagram at
The experimental data (e.g., see Refs [66, 67, 91]) suggest that in Ni2+xMn1-xGa alloys the Curie temperature and the martensitic transformation temperature vary with concentration almost linearly. This fact can be used to build a theoretical phase diagram of the given alloys. To this end we write the coefficients and in the free energy (12) in the form
| (29) |
where and , with and the temperatures of the martensitic and magnetic transitions at , and and are proportionality factors. The values of , , , and can be found from experiments.
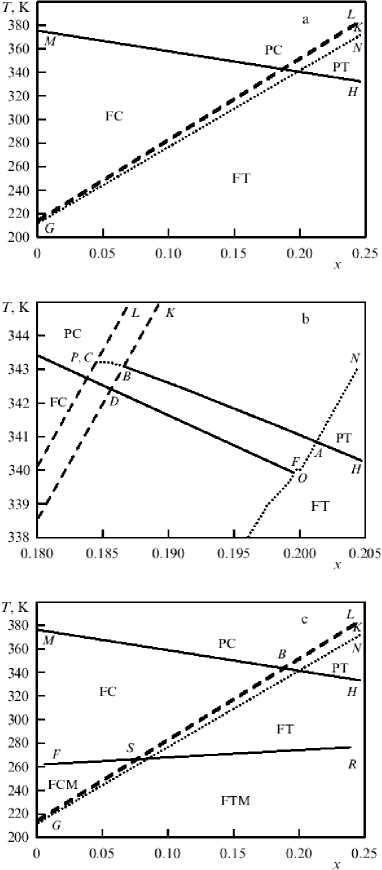
Figure 18a shows a phase diagram of Ni2+xMn1-xGa alloys built numerically with allowance for Eqn (29). The following values of the parameters in Eqns (12) and (29) (see Refs [14, 20, 21, 23, 66, 67, 80, 91, 123, 223]) were used in calculating this diagram:
| (30) |
In view of the smallness of the magnetoelastic constant , the region in Fig. 18a where the temperatures and intersect is not resolved on the given scale. To resolve it, in Fig. 18b we show this region on a larger scale. Figures 18a and 18b suggest that with the parameters chosen according to Eqn (30), the region where first-order structural and magnetic phase transitions coexist is small and is located near . The size of this interval is determined by the magnetoelastic constant . The phase diagram in Figs 18a and 18b is in good agreement with the experimental diagram [66, 67, 91] (see Fig. 10). We also note that in the region where a coupled structural and magnetic phase transition exists (line in Fig. 18b), the Curie temperature increases with concentration. Outside this region the Curie temperature always decreases (with increasing or decreasing). This fact also agrees with the experimental data (see Section 5.1).
As noted earlier [see Eqn (18)], within the region of existence of stable phases in which the lattice parameter ratio is less than unity, there can also be metastable phases (with energies close to those of the stable phases), in which the lattice parameter ratio is greater than unity. Figures 18a and 18b show that within a narrow interval of concentrations near the point of intersection of and , phases with cubic symmetry may exist in addition to martensitic phases of different symmetries and different lattice parameter ratios . Crystal phases of different symmetries and different values of have indeed been observed in experiments [99, 221, 222] in alloys with .
VIII.5 T vs. x phase diagram at with allowance for the modulation order parameter
To find all the equilibrium states of the Ni2+xMn1-xGa alloys when the modulation order parameter is taken into account, we must minimize expression (12) in the order parameters , , , , , and . The resulting system of nonlinear algebraic equations can be solved only numerically. To do the necessary numerical calculations, the following values of parameters in equation (12) were chosen on the basis of the existing experimental data [14, 20, 21, 23, 66, 67, 80, 91, 123, 223] (in units of erg/cm-3):
The other parameters were taken from Eqn (30). The experimental data (see Fig. 10) suggest that the premartensitic transformation temperature is practically independent of the composition of the alloys investigated. This makes it possible to write the parameter in Eqn (12) in the form , where K.
The T vs. x phase diagram of Heusler alloys Ni2+xMn1-xGa calculated with the given values of the parameters is shown in Fig. 18c. Clearly, with the parameters chosen in this way the following phases emerge as a result of concentration and temperature variations: the paramagnetic cubic (PC), the paramagnetic tetragonal (PT), the ferromagnetic quasicubic (FC), the ferromagnetic tetragonal (FT), the ferromagnetic quasicubic modulated (FCM), and the ferromagnetic tetragonal modulated (FTM). In all the ferromagnetic phases magnetization is directed along the [001] axis. and are the lines of second-order magnetic phase transitions between the paramagnetic and ferromagnetic cubic and tetragonal phases, respectively. is the line of the first-order phase transition between the ferromagnetic phases FC and FCM. is the line of a similar transition between the tetragonal phases FT and FTM. These first-order phase transitions are accompanied by the emergence of lattice modulation. The hysteresis of the given transitions with the selected values of parameters is very small and therefore is not resolved on the scale of Fig. 18c. , , and are the lines of the martensitic phase transitions FCM–FTM, FC–FT, and PC–PT, respectively. A characteristic feature of these transitions is that they are accompanied by the emergence of large tetragonal strains of the lattice. and are lines of loss of stability of the phases FTM, FT, PT and FCM, FC, PC, respectively. Figure 18c shows that, compared to a transition to a modulated state, the martensitic transition is accompanied by a large hysteresis. This fact is in good agreement with the experimental data from resistivity measurements (see Fig. 11). In the concentration interval , the hysteresis regions of the premartensitic and martensitic transitions overlap, with the result that these transitions are partially superimposed and are poorly resolved in experiments.
VIII.6 Effect of magnetic field on martensitic structure
Analysis of the phase diagrams done in the previous sections shows that at the Heusler alloys Ni2+xMn1-xGa divide into structural domains. Defects in the crystal lattice play an important role in the nucleation of martensitic structures [224-226]. Detailed analysis of martensitic domain structures has been carried out in Refs [226-228]. Curnoe and Jacobs [229] proposed a model of a twin boundary separating two tetragonal variants. The structural domains in the ferromagnetic alloys Ni2+xMn1-xGa, in turn, divide into magnetic domains. When an external magnetic field is applied, both the magnetic and the structural domains undergo a transformation [75, 154, 230-238].
L’vov et al. [231] calculated the temperature curves for the magnetization of a ferromagnetic martensite at different values of the external magnetic field strength. They found that the presence of a martensitic domain structure helps to explain the temperature dependences of magnetization observed in experiments (see Fig. 4).
James and Wuttig [154] found the field dependence of the strains induced in an alloy by numerical minimization of the alloy energy averaged over the different martensitic variants. They assumed that each martensitic variant that is possible for the specific sample enters into the total magnetization and strain with its own volume fraction. The total energy was expressed by the sum of Zeeman energy, the external stresses energy and the demagnetization energy, which, in turn, were expressed in terms of the averaged magnetization and strain. Numerical minimization of the total energy made it possible to determine the volume fractions of the optimal martensitic variants for the given value of the magnetic field, which made it possible to construct the field dependencies of the strains induced by the magnetic field in the samples. A fuller analysis of the effect of an external magnetic field on the martensitic domain structure of Ni2+xMn1-xGa alloys was carried by O’Handley [230], who, however, did not examine the specific magnetic domain structure observed in experiments.
The structural and magnetic domains in the martensitic phase of ferromagnetic Heusler alloys Ni2+xMn1-xGa have been observed in experiments by Chopra et al. [121] (who used the photomicrography method) and by Pan and James [85] (who used the magnetic-force microscopy method). On the basis of the experimental results [85, 121] and the theoretical analysis of the phase diagram of Ni2+xMn1-xGa alloys [66, 67, 91, 200-215] Buchel’nikov et al. [236-238] proposed a model of the self-consistent structure of martensitic and magnetic domains, studied the behavior of this structure under an applied magnetic field, and calculated the strains induced by the magnetic field in the Ni2+xMn1-xGa alloys.
As a result of the transition from the high-temperature cubic modification to the low-temperature tetragonal modification, the Ni2+xMn1-xGa single crystal divides into three types of martensitic domains, each of which corresponds to a strain (compression or extension) of the crystal lattice along directions of the {100} type. In the ferromagnetic crystal, the structural domains, in turn, divide into magnetic domains. The direction of the magnetization in each magnetic domain coincides with the principal crystallographic axis of the structural domain. For definiteness, in the structural domain of the first type the tetragonal axis is directed along the x axis, while in the domains of the second and third types this axis is directed along the y and z axes, respectively. It is assumed that each structural domain divides into 180-degree magnetic domains.
When there is no magnetic field, all structural domains have the same energy, with the result that the volumes occupied by each type of domain are the same, too. When a magnetic field directed along the x axis is switched on, the volume of domains of the first type increases at the expense of the domains of the second and third types. In the presence of the field the volume fractions of domains of different types can be written as follows:
| (31) |
where is the volume fraction of domains of the first type, is the volume fraction of domains of the second and third types, and is a parameter that takes into account the variation of domain volumes under the applied magnetic field.
The results obtained in the previous sections suggest that in a zero magnetic field the cubic ferromagnet can transform into tetragonal phases with magnetizations along axes of the {001} type. For instance, in the phase with the spontaneous strain tensor has the form
| (32) |
where
and the constant can be found by solving the equation
For the other two phases with magnetizations along the [100] and [010] axes, the spontaneous strain tensor can be obtained from Eqn (32) through a cyclic permutation of the indices. Thus, in the ferromagnet there can exist three tetragonal phases with the same energy, with the result that there can be three types of structural domains in the crystal. The first terms in the expressions for describe the changes in strains caused by bulk magnetostriction. Compared to effects associated with structural lattice distortions, these terms are small and can be ignored.
Plugging Eqn (32) into the total energy (12) of the cubic ferromagnet leads to the following expression for the energy of each type of domains in the system of coordinates associated with the crystal lattice:
| (33) |
where is the induced uniaxial anisotropy and H is the internal magnetic field. Tickle and James [80] measured the magnetic anisotropy of Ni2+xMn1-xGa alloys and found that the uniaxial anisotropy is much larger than the cubic one, so that in all further calculations the cubic anisotropy is dropped.
We write the energy of the domain structure in the following form:
| (34) |
where is the energy of the elastic subsystem, is the energy of the magnetic subsystem, and is the Zeeman energy.
Next we write the energy of the elastic subsystem as follows:
| (35) |
where stands for volume averaging, and is the effective elastic modulus tensor for the Ni2+xMn1-xGa alloy with the domain structure in question. According to Eqn (31), the average values of the components of the strain tensor of the alloy can be written as
| (36) |
where is the strain tensor for -type domains defined in Eqn (32). Plugging these strains into Eqn (36) yields the following formula for the strain tensor averaged over the sample’s volume:
| (37) |
Plugging Eqn (37) into expression (35), we arrive at the following expression for the elastic energy of the domain structure in question:
| (38) |
where .
According to our choice of the direction of the external magnetic field, magnetization in domains of the first type is directed parallel or antiparallel to the field, while in domains of the second and third types it is perpendicular to the field. In view of this, in domains of the first type under magnetization there can only be processes in which the domain walls are displaced while in domains of the second and third types there can only be processes in which magnetization is rotated. In this case the anisotropy energy and the Zeeman energy can be written as follows:
| (39) |
Here the projection of the magnetization vector on the direction of the magnetic field has the form
| (40) |
and the internal magnetic field is given by the formula , where is the external magnetic field and is the demagnetization factor. In equations (39) and (40), is the angle between the directions of the magnetization and the magnetic field vectors in domains of the second and third types, and is the average magnetization in domains of the first type. This magnetization can be expressed by the following formula:
| (41) |
where the phenomenological parameter is the field strength at which all processes of displacement of magnetic domain walls in martensitic domains of the first type are terminated.
Plugging Eqns (38) and (39) into formula (34), we arrive at the following expression for the energy of the domain structure:
| (42) |
The equilibrium values of the parameters and of the domain structure in question can be found by minimizing the expression (42) with respect to these variables. This leads to the following equations for finding and :
| (43) |
Plugging the solution of equations (43) into the expressions for the strain tensor (37) and the magnetization (40), we can find the dependence of these characteristics of Ni2+xMn1-xGa alloy on the size of the external magnetic field. The results of numerical calculations of the field dependencies of the magnetization, the parameter , and the strain for different values of the effective elastic modulus and the demagnetization factor are shown in Fig. 19. The following values of the parameters of Ni2+xMn1-xGa alloy [80, 85] were used in the calculations:
These calculations also took into account the fact that when the parameter reaches the value of 2/3, the alloy becomes a single-domain alloy, the strain reaches the value of roughly 0.06 (this is determined by the ratio of the crystal lattice parameters in the tetragonal phase, ), and no further strain of the alloy under a magnetic field occurs.
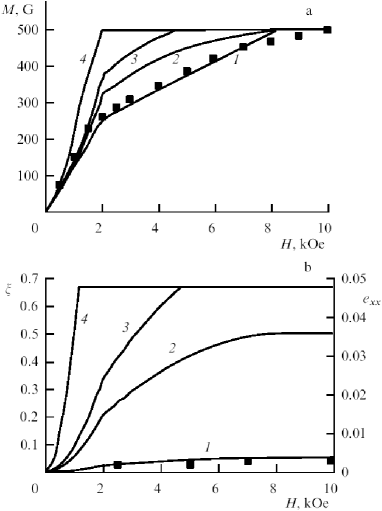
The field dependencies of , , and have kinks at field strengths and , where . The explanation is as follows. When , the increase in magnetization is caused by the displacement of the magnetic domain walls in structural domains of the first type and by rotation of magnetization vectors in structural domains of the second and third types. At the magnetic domains in the structural domains of the first type disappear completely, and the further increase in magnetization in fields is due solely to the rotation of magnetization in the structural domains of the second and third types. At the vectors M in the structural domains of the second and third types align themselves with the direction of the external field, so that the sample’s magnetization reaches its saturation value.
Figure 19 suggests that the transformation of magnetic domains under an external field takes place simultaneously with the transformation of the structural domains. As the magnetic field gets stronger, the structural domains of the first type grow bigger. In fields higher than , when the magnetization is the same in all structural domains, the Zeeman energy of these domains is also the same. Since it is due to the increase in the Zeeman energy that structural domain walls begin to move under a magnetic field, at a further growth of the structural domains of the first type at the expense of the domains of the second and third types becomes impossible.
The limit value of the volume fraction that can be reached in magnetization saturation is given by the formula
| (44) |
and the corresponding value of the strain caused by the magnetic field is given by the formula
| (45) |
Figure 19 clearly shows that at large values of the effective elastic modulus the values of and are smaller than the maximum values determined by changes in the lattice. From equations (44) and (45) it follows that to achieve maximum strains induced by a magnetic field in Ni2+xMn1-xGa alloys, the elastic energy must be of the order of the anisotropy energy. This can be achieved at small values of the elastic modulus near the martensitic transformation point. The results of the calculated field dependencies of magnetization and strain are in good agreement with the experimental data [80, 19, 123].
VIII.7 Shift in the structural phase transition temperature caused by a magnetic field
The shift in the temperature of a martensitic transformation caused by a magnetic field and by mechanical stresses has been studied in Refs [108-111, 198, 206, 239-245]. The vs. and vs. phase diagrams of some Ni2+xMn1-xGa alloys have been calculated in Refs [198, 206, 239, 240, 242-245].
There are two reasons why a magnetic field shifts the martensitic transition temperature. The first is the displacement of the phase transition line caused by changes in the free energies (12) of the austenitic and martensitic phases in the presence of a magnetic field. The second reason is the change in the thermodynamic equilibrium temperature of the austenitic and martensitic phases in a magnetic field. The first factor changes the phase transition temperature only slightly but considerably narrows the hysteresis of the martensitic transition in relatively weak magnetic fields [202, 206, 239]. This happens because the energy of the magnetoelastic interaction is low compared to the Zeeman energy already in fields of several kOe. The second factor can significantly change the phase transition temperature. It is this effect that we will now consider.
Experimenters usually measure the temperatures of the beginning of the martensitic () and austenitic () transformations. Their dependence on the magnetic field strength can be found from the phase equilibrium condition (the Clausius– Clapeyron equation) [109]. At the phase equilibrium condition can be written as
| (46) |
at this condition is
| (47) |
Here, are the thermodynamic potentials of the austenitic and martensitic phases, and are the magnetizations and the volumes of these phases, are additional energies related to the emergence of additional stresses due to phases matching at the austenite–martensite twin boundaries and to the surface energy of these twin boundaries, and , with and are, respectively, the latent heat and the temperature of the phase transformation.
Combining equations (46) and (47), we obtain the following formula for the field dependence of the temperatures and :
| (48) |
To find the unknown quantities and in Eqn (48), Cherechukin et al. [109] used the results of minimization of the free energy (12) with allowance for the Zeeman term . Figure 20 shows the field dependencies of temperatures and calculated by using Eqn (48) with the numerical values of the parameters in the expression for the free energy (12) adopted by Cherechukin et al. [109]. Here we also sow the experimental results for a Ni2.15Mn0.81Fe0.04Ga alloy. Clearly, there is good agreement between theory and experiment.
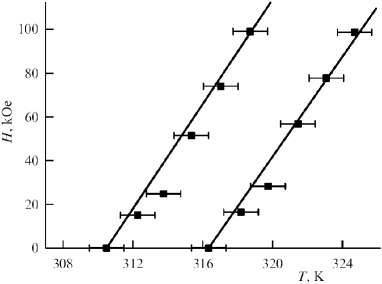
IX Conclusion
Extensive studies of shape memory ferromagnets has led to the discovery of a new mechanism of controlling the size and shape of a solid by subjecting the samples to a magnetic field. The strains that develop as result of such action exceed the record values of magnetostrains in magnetostrictors. There are already certain advances in the practical applications of shape memory ferromagnets (see, e.g., Ref. [246]). The introduction of actuators and sensors whose operation is based on this class of materials requires, however, solving a whole range of problems. The main factors here are the increase of durability of the materials, the reproducibility of reversible magnetically induced strains, the study of the role of aging, etc. An important area of research of Ni2+x+yMn1-xGa1-y alloys is the study of ways of improving the dynamic characteristics of actuators and sensors whose operation is based on giant magnetically induced strains [140].
In conclusion we would like to note that, notwithstanding the enormous body of information that has already been gathered, some of the physical properties of Heusler alloys Ni2+x+yMn1-xGa1-y require further investigation. This is true, first and foremost, of the phase diagram of the given ternary compound, the information about which is fragmentary [15, 141, 247, 248]. It would be especially interesting to establish the main laws governing the concentration dependence of magnetically induced strains in Ni2+x+yMn1-xGa1-y alloys. Since many characteristics of Ni2+x+yMn1-xGa1-y alloys depend on composition, it is imperative that the concentration dependencies of the anisotropy constant, elastic moduli, and other characteristics be measured. In the area of theory, further development of the statistical model of phase transformations in Ni2+x+yMn1-xGa1-y alloys is necessary so as to make it possible to model the specific temporal behavior of samples (the kinetics of the transformation) subjected to external stresses and magnetic fields [249, 250].
References
- (1) Roitburd A L, ”Martensitnoe Prevrashchenie” (”Martensitic transformation”), in Fizicheskaya Entsiklopediya (Physics Encyclopedia) (Ed A M Prokhorov) Vol. 3 (Moscow, 1992) p 49
- (2) Nishiyama Z, Martensitic Transformation (Academic Press, 1978)
- (3) Otsuka K et al. Shape Memory Alloys (Precision Machinery and Robotics, Vol. 1, Ed H Funakubo) (Gordon and Breach Sci Publ., 1987)
- (4) Otsuka K, Wayman C M (Eds) Shape Memory Materials (Cambridge Univ. Press, 1998)
- (5) Nakanisi N, Nagasawa A, and Murakami Y, J. Phys. (Paris) 43, C4-35 (1982)
- (6) Kondrat’ev V V and Pushin V G, Fiz. Met. Metalloved. 60, 629 (1985)
- (7) Smith H G, Berliner R, and Trivisonno J, in Proc. of the Intern. Conf. on Martensitic Transformations (ICOMAT-92), Monterey, Calif., USA, July 1992 (Eds C M Wayman, J Perkins) (Monterey Institute for Advanced Studies, 1993) p 141
- (8) Patel J R and Cohen M Acta Metall. 1 531 (1953)
- (9) Nagasawa A, Enami K, Ishino Y, Abe Y, and Nenno S Scripta Metall. 8 1055 (1974)
- (10) Saburi T and Nenno S Scripta Metall. 8 1363 (1974)
- (11) Schroeder T A and Wayman C M Scripta Metall. 11 225 (1977)
- (12) Delaey L and Tienel J Shape Memory Effects in Alloys (Ed. J Perkins) (Plenum Press, 1975) p 341
- (13) Kokorin V V and Chernenko V A Phys. Met. Metallogr. 68(6) 111 (1989)
- (14) Webster P J, Ziebeck K R A, Town S L, and Peak M S Philos. Mag. B 49 295 (1984)
- (15) Overholser R W, Wuttig M, and Neumann D A Scripta Mater. 40 1095 (1999)
- (16) Khovailo V V, Takagi T, Vasil’ev A N, Miki H, Matsumoto M, and Kainuma R phys. stat. sol. (a) 183 R1 (2001)
- (17) Chernenko V A, Cesari E, Kokorin V V, and Vitenko I N Scripta Metal. 33 1239 (1995)
- (18) Planes A and Mañosa L, in Solid State Physics Vol 55 (Academic Press, 2001) p 159
- (19) Fritsch G, Kokorin V V, and Kempf A J. Phys.: Condens. Matter 6 L107 (1994)
- (20) Zheludev A, Shapiro S M, Wochner P, Schwartz A, Wall M, and Tanner L E Phys. Rev. B 51 11310 (1995)
- (21) Planes A, Obradó E, Gonzàlez-Comas A, and Mañosa L Phys. Rev. Lett. 79 3926 (1997)
- (22) Castán T, Vives E, and Lindgård P-A Phys. Rev. B 60, 7071 (1999)
- (23) Zheludev A, Shapiro S M, Wochner P, and Tanner L E Phys. Rev. B 54 15045 (1996)
- (24) Zheludev A and Shapiro S M Solid State Comm. 98 35 (1996)
- (25) Mañosa L, Planes A, Zarestky J, Lograsso T, Schlagel D L, and Stassis C Phys. Rev. B 64 024305 (2001)
- (26) Zuo F, Su X, Zhang P, Alexandrakis G C, Yang F, and Wu K H J. Phys.: Condens. Matter 11 2821 (1999)
- (27) Khovailo V V, Takagi T, Bozhko A D, Matsumoto M, Tani J, and Shavrov V G J. Phys.: Condens. Matter 13 9655 (2001)
- (28) Wang W H, Chen J L, Gao S X, Wu G H, Wang Z, Zheng Y F, Zhao L C, and Zhan W S J. Phys.: Condens. Matter 13 2607 (2001)
- (29) Segui C, Cesari E, Pons J, Chernenko V A, and Kokorin V V J. Phys. (Paris) IV 6 C8-381 (1996)
- (30) Cesari E, Chernenko V A, Kokorin V V, Pons J, and Seguí C Acta Mater. 45 999 (1997)
- (31) Chernenko V A, Pons J, Seguí C, and Cesari E Acta Mater. 50 53 (2002)
- (32) Worgull J, Petti E, and Trivisonno J Phys. Rev. B 54 15695 (1996)
- (33) Mañosa L, Gonzàlez-Comas A, Obradó E, Planes A, Chernenko V A, Kokorin V V, and Cesari E Phys. Rev. B 55 11068 (1997)
- (34) Stenger T E and Trivisonno J Phys. Rev. B 57 2735 (1998)
- (35) Gonzàlez-Comas A, Obradó E, Mañosa L, Planes A, Chernenko V A, Hattink B J, and Labarta A Phys. Rev. B 60 7085 (1999)
- (36) Kokorin V V, Chernenko V A, Cesari E, Pons J, and Segui C J. Phys.: Condens. Matter 8 6457 (1996)
- (37) Kokorin V V, Chernenko V A, Pons J, Segui C, and Cesari E Solid State Comm. 101 7 (1997)
- (38) Stuhr U, Vorderwisch P, Kokorin V V, and Lindgård P-A Phys. Rev. B 56 14360 (1997)
- (39) Stuhr U, Vorderwisch P, and Kokorin V V J. Phys.: Condens. Matter 12 7541 (2000)
- (40) Vasil’ev A N, Kokorin V , Savchenko Yu I, and Chernenko V A Sov. Phys. JETP 71 803 (1990)
- (41) Nagasawa A, Nakanishi N, and Enami K Philos. Mag. A 43 1345 (1981)
- (42) Mañosa L, Gonzàlez-Comas A, Obradó E, and Planes A Mater. Sci. Eng. A 273-275 329 (1999)
- (43) Gonzàlez-Comas A, Obradó E, Mañosa L, Planes A, and Labarta A J. Magn. Magn. Mater. 196-197 637 (1999)
- (44) Martynov V V J. Phys. (Paris) IV 5 C8-91 (1995)
- (45) Zasimchuk I K, Kokorin V V, Martynov V V, Tkachenko A V, and Chernenko V A Phys. Met. Metallogr. 69 (6) 104 (1990)
- (46) Kokorin V V, Martynov V V, and Chernenko V A Sov. Phys. Solid State 33 708 (1991)
- (47) Kokorin V V and Martynov V V Phys. Met. Metallogr. 72 (3) 101 (1991)
- (48) Martynov V V and Kokorin V V J. Phys. (Paris) III 2 739 (1992)
- (49) Vasil’ev A N, Keiper A, Kokorin V V, Chernenko V A, Takagi T, and Tani J JETP Lett. 58 306 (1993)
- (50) Vasil’ev A N, Keiper A R, Kokorin V V, Chernenko V A, Takagi T, and Tani J Int. J. Appl. Electromagn. Mater. 5 163 (1994)
- (51) Chernenko V A, Amengual A, Cesari E, Kokorin V V, and Zasimchuk I K J. Phys. (Paris) IV 5 C2-95, (1995)
- (52) Fritsch G, Kokorin V V, Chernenko V A, Kempf A, and Zasimchuk I K Phase Transitions 57 233 (1996)
- (53) Chernenko V A, Seguí C, Cesari E, Pons J, and Kokorin V V J. Phys. (Paris) IV 7 C5-137 (1997)
- (54) Chernenko V A, Seguí C, Cesari E, Pons J, and Kokorin V V Phys. Rev. B 57 2659 (1998)
- (55) Chernenko V A, Kokorin V V, Babii O M, and Zasimchuk I K Intermetallics 6 29 (1998)
- (56) Pons J, Chernenko V A, Santamarta R, and Cesari E Acta Mater. 48 3027 (2000)
- (57) Wedel B, Suzuki M, Murakami Y, Wedel C, Suzuki T, Shindo D, and Itagaki K J. Alloys Comp. 290 137 (1999)
- (58) Heczko O, Lanska N, Soderberg O, and Ullakko K J. Magn. Magn. Mater. 242-245 1446 (2002)
- (59) Sozinov A, Likhachev A A, Lanska N, and Ullakko K Appl. Phys. Lett. 80 1746 (2002)
- (60) Chernenko V A, Cesari E, Pons J, and Seguí C J. Mater. Res. 15 1496 (2000)
- (61) Kübler J, Williams A R, and Sommers C B Phys. Rev. B 28 1745 (1983)
- (62) Deb A and Sakurai Y J. Phys.: Condens. Matter 12 2997 (2000)
- (63) Brown D, Crapper M D, Bedwell K H, Butterfield M T, Guifoyle S J, Malins A E R, and Petty M Phys. Rev. B 57 1563 (1998)
- (64) Kimura A, Suga S, Shishidou T, Imada S, Muro T, Park S Y, Miyahara T, Kaneko T, and Kanomata T Phys. Rev. B 56 6021 (1997)
- (65) Plogmann S, Schlathölter T, Braun J, Neumann M, Yarmoshenko Yu M, Yablonskikh M V, Shreder E I, Kurmaev E Z, Wrona A, and Ślebarski A Phys. Rev. B 60 6428 (1999)
- (66) Bozhko A D, Vasil’ev A N, Khovailo V V, Buchel’nikov V D, Dikshtein I E, Seletskii S M, and Shavrov V G JETP Lett. 67 227 (1998)
- (67) Vasil’ev A N, Bozhko A D, Khovailo V V, Dikshtein I E, Shavrov V G, Buchel’nikov V D, Matsumoto M, Suzuki S, Takagi T, and Tani J Phys. Rev. B 59 1113 (1999)
- (68) Wang W H, Hu F X, Chen J L, Li Y X, Wang Z, Gao Z Y, Zheng Y F, Zhao L C, Wu G H, and Zhan W S IEEE Trans. Magn. 37 2715 (2001)
- (69) Endo K, Ooiwa K, and Shinogi A J. Magn. Magn. Mater. 104-107 2013 (1992)
- (70) Wang W H, Wu G H, Chen J L, Gao S X, Zhan W S, Wen G H, and Zhang X X Appl. Phys. Lett. 79 1148 (2001)
- (71) Kokorin V V, Chernenko V A, Val’kov V I, Konoplyuk S M, and Khapalyuk E A Phys. Solid State 37 2049 (1995)
- (72) Tsuchiya K, Nakamura H, Ohtoyo D, Nakayama H, Umemoto M, and Ohtsuka H J. Phys. IV France 11 Pr8-263 (2001)
- (73) Heczko O and Ullakko K IEEE Trans. Magn. 37 2672 (2001)
- (74) Heczko O, Sozinov A, and Ullakko K IEEE Trans. Magn. 36 3266 (2000)
- (75) Likhachev A A and Ullakko K Phys. Lett. A 275 142 (2000)
- (76) Khovailo V V, Takagi T, Tani J, Levitin R Z, Cherechukin A A, Matsumoto M, and Note R Phys. Rev. B 65 092410 (2002)
- (77) Filippov D A, Khovailo V V, Koledov V V, Krasnoperov E P, Levitin R Z, Shavrov V G, and Takagi T J. Magn. Magn. Mater. 258-259 507 (2003)
- (78) Vasil’ev A, Bozhko A, Khovailo V, Dikshtein I, Shavrov V, Seletskii S, and Buchel’nikov V J. Magn. Magn. Mater. 196-197 837 (1999)
- (79) Jiang C, Feng G, and Xu H Appl. Phys. Lett. 80 1619 (2002)
- (80) Tickle R and James R D J. Magn. Magn. Mater. 195 627 (1999)
- (81) Shanina B D, Konchits A A, Kolesnik S P, Gavriljuk V G, Glavatskij I N, Glavatska N I, Söderberg O, Lindroos V K, and Foct J J. Magn. Magn. Mater. 237 309 (2001)
- (82) Albertini F, Morellon L, Algarabel P A, Ibarra M R, Pareti L, Arnold Z, and Calestani G J. Appl. Phys. 89 5614 (2001)
- (83) Heczko O, Straka L, Lanska N, Ullakko K, and Enkovaara J J. Appl. Phys. 91 8228 (2002)
- (84) Enkovaara J, Ayuela A, Nordström L, and Nieminen R M Phys. Rev. B 65 134422 (2002)
- (85) Pan Q and James R D J. Appl. Phys. 87 4702 (2000)
- (86) De Graef M, Willard M A, McHenry M E, and Zhu Y IEEE Trans. Magn. 37 2663 (2001)
- (87) Pan Q, Dong J M, Palmstrøm C J, Cui J, and James R D J. Appl. Phys. 91 7812 (2002)
- (88) Heczko O, Jurek K, and Ullakko K J. Magn. Magn. Mater. 226-230 996 (2001)
- (89) Chernenko V A Scripta Mater. 40 523 (1999)
- (90) Perov N, Vasil’ev A, Matsumoto M, Takagi T, and Tani J J. Magn. Soc. Jpn. 23 626 (1999)
- (91) Bozhko A D, Vasil’ev A N, Khovailo V V, Dikshtein I E, Koledov V V, Seletskii S M, Tulaikova A A, Cherechukin A A, Shavrov V G, and Buchel’nikov V D JETP 88 954 (1999)
- (92) Kanomata T, Shirakawa K, and Kaneko T J. Magn. Magn. Mater. 65 76 (1987)
- (93) Kokorin V V, Osipenko I A, and Shirina T V Fiz. Met. Metalloved. 67 601 (1989)
- (94) Tsuchiya K, Ohashi A, Ohtoyo D, Nakayama H, Umemoto M, and McCormick P G Mater. Trans. JIM 41 938 (2000)
- (95) Nakamura H, Tsuchiya K, and Umemoto M Trans. Mater. Res. Soc. Jpn. 26 287 (2001)
- (96) Jin X, Marioni M, Bono D, Allen S M, and O’Handley R C J. Appl. Phys. 91 8222 (2002)
- (97) Chernenko V, L’vov V, Cesari E, Pons J, Portier R, and Zagorodnyuk S Mater. Trans. 43 856 (2002)
- (98) Tsuchiya K, Nakamura H, Ohtoyo D, Ohtsuka H, and Umemoto M Proc. the Fourth Pacific Rim International Conference on Advanced Materials and Processing (PRICM4) (Eds. S Hanada, Z Zhong, S M Nam and R N Wright) (The Japan Institute of Metals, 2001) p 1665
- (99) Koledov V V and Shavrov V G (to be published)
- (100) Vasil’ev A N, Estrin E I, Khovailo V V, Bozhko A D, Ischuk R A, Matsumoto M, Takagi T, and Tani J Int. J. Appl. Electromagn. Mech. 12 35 (2000)
- (101) Chu S-Y, Cramb A, De Graef M, Laughlin D, and McHenry M E J. Appl. Phys. 87 5777 (2000)
- (102) Ullakko K, Huang J K, Kantner C, O’Handley R C, and Kokorin V V Appl. Phys. Lett. 69 1966 (1996)
- (103) Wang W H, Wu G H, Chen J L, Yu C H, Gao S X, Zhan W S, Wang Z, Gao Z Y, Zheng Y F, and Zhao L C Appl. Phys. Lett. 77 3245 (2000)
- (104) Wang W H, Wu G H, Chen J L, Yu C H, Wang Z, Zheng Y F, Zhao L C, and Zhan W S J. Phys.: Condens. Matter 12 6287 (2000)
- (105) Kokorin V V and Wuttig M J. Magn. Magn. Mater. 234 25 (2001)
- (106) Krivoglaz M A, Sadovskii V D Fiz. Met. Metalloved. 18 502 (1964)
- (107) Dikshtein I, Koledov V, Shavrov V, Tulaikova A, Cherechukin A, Buchel’nikov V, Khovailo V, Matsumoto M, Takagi T, and Tani J IEEE Trans. Magn. 35 3811 (1999)
- (108) Dikshtein I E, Ermakov D I, Koledov V V, Koledov L V, Takagi T, Tulaikova A A, Cherechukin A A, and Shavrov V G JETP Lett. 72 373 (2000)
- (109) Cherechukin A A, Dikshtein I E, Ermakov D I, Glebov A V, Koledov V V, Kosolapov D A, Shavrov V G, Tulaikova A A, Krasnoperov E P, and Takagi T Phys. Lett. A 291 175 (2001)
- (110) Cherechukin A A, Glebov A V, Krasnoperov E P, Shavrov V G, and Takagi T Proc. the Fourth Pacific Rim International Conference on Advanced Materials and Processing (PRICM4) (Eds. S Hanada, Z Zhong, S M Nam and R N Wright) (The Japan Institute of Metals, 2001) p 1677
- (111) Takagi T, Khovailo V, Nagatomo T, Miki H, Matsumoto M, Abe T, Wang Z, Estrin E, Vasil’ev A, and Bozhko A Trans. Mater. Res. Soc. Jpn. 26 197 (2001)
- (112) Takagi T, Khovailo V, Nagatomo T, Matsumoto M, Ohtsuka M, Abe T, and Miki H Int. J. Appl. Electromagn. Mech. 16 173 (2002)
- (113) Ibarra M R and Algarabel P A Phys. Rev. B 50 4196 (1994)
- (114) Chernenko V A, Wee L, McCormick P G, and Street R J. Appl. Phys. 85 7833 (1999)
- (115) Fujieda S, Fujita A, Fukamichi K, Yamazaki Y, and Iijima Y Appl. Phys. Lett. 79 653 (2001)
- (116) Morellon L, Blasco J, Algarabel P A, and Ibarra M R Phys. Rev. B 62 1022 (2000)
- (117) Ullakko K J. Mater. Eng. Performance 5 405 (1996)
- (118) Tickle R, James R D, Shield T, Wuttig M, and Kokorin V V IEEE Trans. Magn. 35 4301 (1999)
- (119) Murray S J, Marioni M, Allen S M, O’Handley R C, and Lograsso T A Appl. Phys. Lett. 77 886 (2000)
- (120) Ullakko K, Huang J K, Kokorin V V, and O’Handley R C Scripta Mater. 36 1133 (1997)
- (121) Chopra H D, Ji C, and Kokorin V V Phys. Rev. B 61 R14913 (2000)
- (122) James R D, Tickle R, and Wuttig M Mater. Sci. Eng. A 273-275 320 (1999)
- (123) Wu G H, Yu C H, Meng L Q, Chen J L, Yang F M, Qi S R, Zhan W S, Wang Z, Zheng Y F, and Zhao L C Appl. Phys. Lett. 75 2990 (1999)
- (124) Chernenko V A, L’vov V A, Pasquale M, Besseghini S, Sasso C, and Polenur D A Int. J. Appl. Electromag. Mech. 12 3 (2000)
- (125) Yu C H, Wang W H, Chen J L, Wu G H, Yang F M, Qi S R, Zhan W S, Wang Z, Zheng Y F, and Zhao L C J. Appl. Phys. 87 6292 (2000)
- (126) Pasquale M, Sasso C P, Besseghini S, and Chernenko V IEEE Trans. Magn. 37 2669 (2001)
- (127) Matsumoto M, Ohtsuka M, Miki H, Khovailo V V, and Takagi T Mater. Sci. Forum 394-395 545 (2002)
- (128) Pasquale M, Sasso C P, Besseghini S, Villa E, and Chernenko V J. Appl. Phys. 91 7815 (2002)
- (129) Murray S J, Marioni M, Tello P G, Allen S M, and O’Handley R C J. Magn. Magn. Mater. 226-230 945 (2001)
- (130) Murray S J, Marioni M A, Kukla A M, Robinson J, O’Handley R C, and Allen S M J. Appl. Phys. 87 5774 (2000)
- (131) Ge Y, Söderberg O, Glavatska N, Ullakko K, and Lindroos V K J. Phys. IV France 11 Pr8-317 (2001)
- (132) Glavatska N, Gavriljuk V, Glavatsky I, Ge Y, Söderberg O, Jääskeläinen A, Ullakko K, and Lindroos V K J. Phys. IV France 11 Pr8-281 (2001)
- (133) Sozinov A, Ezer Y, Kimmel G, Yakovenko P, Giller D, Wolfus Y, Yeshurun Y, Ullakko K, and Lindroos V K J. Phys. IV France 11 Pr8-311 (2001)
- (134) Ullakko K, Ezer Y, Sozinov A, Kimmel G, Yakovenko P, and Lindroos V K Scripta Mater. 44 475 (2001)
- (135) Söderberg O, Ge Y, Glavatska N, Heczko O, Ullakko K, and Lindroos V K J. Phys. IV France 11 Pr8-287 (2001)
- (136) Glavatska N, Glavatsky I, Mogilny G, and Gavriljuk V Appl. Phys. Lett. 80 3533 (2002)
- (137) Glavatska N, Mogylny G, Glavatskiy I, and Gavriljuk V Scripta Mater. 46 605 (2002)
- (138) Zhao Y, Qian M, Chen S, and Hsu T Y Mater. Sci. Forum 394-395 557 (2002)
- (139) Lu X, Qin Z, and Chen X Mater. Sci. Forum 394-395 549 (2002)
- (140) Henry C P, Bono D, Feuchtwanger J, Allen S M, and O’Handley R C J. Appl. Phys. 91 7810 (2002)
- (141) Schladel D L, Wu Y L, Zhang W, and Lograsso T A J. Alloys Comp. 312 77 (2000)
- (142) Kokorin V V and Chuistov K V, in Synopses of Reports Presented at the Intern. Conf. on Martensitic Transformations (Kiev, 1977) p 175
- (143) Kokorin V V, Thesis for Doctorate of Physico-Mathematical Sciences (Kiev, 1978)
- (144) Kakeshita T, Shimizu K, Maki T, Tamura I, Kijima S, and Date M Scripta Metal. 19 973 (1985)
- (145) Sohmura T, Oshima R, and Fujita F E Scripta Metal. 14 855 (1980)
- (146) Matsui M, Yamada H, and Adachi K J. Phys. Soc. Jpn. 48 2161 (1980)
- (147) Sugiyama M, Oshima R, and Fujita F E Trans. JIM 25 585 (1984)
- (148) Sato M, Grier B H, Shapiro S M, and Miyajima H J. Phys. F: Met. Phys. 12 2117 (1982)
- (149) Muto S, Oshima R, and Fujita F E Acta Metal. 38 685 (1990)
- (150) Taya M, Kato H, Wada T, Tagawa T, Liang Y, and Mori T Proc. Asian Pacific Conf. on Fracture and Strength and Intern. Conf. on Advanced Technology in Experimental Mechanics (APCFS—ATEM-2001), Sendai, Japan, Oct. 20-22, 2001 (Sendai, 2001) p 11
- (151) Oshima R and Sugiyama M J. Phys. Paris 43 C4-383 (1982)
- (152) Cui J and James R D IEEE Trans. Magn. 37 2675 (2001)
- (153) Matsui M and Adachi K Physica B 161 53 (1989)
- (154) James R D and Wuttig M Philos. Mag. A 77 1273 (1998)
- (155) Matsui M and Adachi K J. Magn. Magn. Mater. 31-34 115 (1983)
- (156) Klemmer T, Hoydick D, Okumura H, Zhang B, and Soffa W A Scripta Metal. 33 1793 (1995)
- (157) Muto S, Oshima R, and Fujita F E Scripta Metal. 21 465 (1987)
- (158) Koeda J, Nakamura Y, Fukuda T, Kakeshita T, Takeuchi T, and Kishio K Trans. Mater. Res. Soc. Jpn. 26 215 (2001)
- (159) Furuya Y, Hagood N W, Kimura H, and Watanabe T Mater. Trans. JIM 39 1248 (1998)
- (160) Kubota T, Okazaki T, Furuya Y, and Watanabe T J. Magn. Magn. Mater. 239 551 (2002)
- (161) Tadaki T Trans. JIM 18 864 (1977)
- (162) Kakeshita T, Shimizu K, Funada S, and Date M Trans. JIM 25 837 (1984)
- (163) Wayman C M Scripta Metal. 5 489 (1971)
- (164) Dunne D P and Wayman C M Metal. Trans. 4 137 (1973)
- (165) Dunne D P and Wayman C M Metal. Trans. 4 147 (1973)
- (166) Kajiwara S and Owen W S Metal. Trans. 4 1988 (1973)
- (167) Kajiwara S and Owen W S Metal. Trans. 5 2047 (1974)
- (168) Kajiwara S and Owen W S Scripta Metal. 11 137 (1977)
- (169) Kästner J, Petry W, Shapiro S M, Zheludev A, Neuhaus J, Roessel Th, Wassermann E F, and Bach H Eur. Phys. J. B 10 641 (1999)
- (170) Wasserman E F, in Ferromagnetic Materials: A Handbook on the Properties of Magnetically Ordered Substances Vol. 5 (Eds K H J Buschow, E P Wolfarth) (Amsterdam: North-Holland, 1990) p 237
- (171) Kakeshita T, Takeuchi T, Fukuda T, Tsujiguchi M, Saburi T, Oshima R, and Muto S Appl. Phys. Lett. 77 1502 (2000)
- (172) Kainuma R, Nakano H, and Ishida K Metall. Mater. Trans. A 27 4153 (1996)
- (173) Otsuka K and Morito S Mater. Sci. Eng. A 208 47 (1996)
- (174) Sutou Y, Ohnuma I, Kainuma R, and Ishida K Metall. Mater. Trans. A 29 2225 (1998)
- (175) Inoue T, Morito S, Murakami Y, Oda K, and Otsuka K Mater. Lett. 19 33 (1994)
- (176) Gejima F, Sutou Y, Kainuma R, and Ishida K Metall. Mater. Trans. A 30 2721 (1999)
- (177) Kainuma R, Gejima F, Sutou Y, Ohnuma I, and Ishida K Mater. Trans. JIM 41 943 (2000)
- (178) Ziebeck K R A and Webster P J J. Phys. F: Metal. Phys. 5 1756 (1975)
- (179) Fujita A, Fukamichi K, Gejima F, Kainuma R, and Ishida K Appl. Phys. Lett. 77 3054 (2000)
- (180) Enami K and Nenno S Metall. Trans. 2 1487 (1971)
- (181) Kainuma R, Ise M, Jia C C, Ohtani H, and Ishida K Intermetallics 4 S151 (1996)
- (182) Oikawa K, Ota T, Gejima F, Ohmori T, Kainuma R, and Ishida K Mater. Trans. 42 2472 (2001)
- (183) Wuttig M, Li J, and Craciunescu C Scripta Mater. 44 2393 (2001)
- (184) Oikawa K, Wulff L, Iijima T, Gejima F, Ohmori T, Fujita A, Fukamichi K, Kainuma R, and Ishida K Appl. Phys. Lett. 79 3290 (2001)
- (185) Murakami Y, Shindo D, Oikawa K, Kainuma R, and Ishida K Acta Mater. 50 2173 (2002)
- (186) Morito H, Fujita A, Fukamichi K, Kainuma R, Ishida K, and Oikawa K Appl. Phys. Lett. 81 1657 (2002)
- (187) Terada M, Fujita Y, and Endo K J. Phys. Soc. Jpn. 36 620 (1974)
- (188) Ohtoyo D, Tsuchiya K, and Umemoto M Trans. Mater. Res. Soc. Jpn. 26 295 (2001)
- (189) Ziebeck K R A and Webster P J J. Phys. Chem. Solids 35 1 (1974)
- (190) Neumann K-U, Kanomata T, Ouladdiaf B, and Ziebeck K R A J. Phys.: Condens. Matter 14 1371 (2002)
- (191) Wolter A U B, Klau, Litterst F J, Geibel C, and S llow S, J. Magn. Magn. Mater. 242-245 888 (2002)
- (192) Garde C S and Ray J J. Phys.: Condens. Matter 14 3775 (2002)
- (193) Izyumov Yu A, Syromyatnikov V N Phase Transitions and Crystal Symmetry (Dordrecht: Acad. Publ., 1990)
- (194) Falk F Acta Metall. 28 1773 (1980)
- (195) Lyakos J K and Saunders G A Philos. Mag. A 46 217 (1982)
- (196) Izyumov Yu A, Laptev V M, and Syromyatnikov V N Sov. Phys. Solid State 30 938 (1988)
- (197) Falk F and Konopka P J. Phys.: Condens. Matter 2 61 (1990)
- (198) Gomonaj E V and L’vov V A Phase Transitions 47 9 (1994)
- (199) Hoffmann E Herper H, Entel P, Mishra S G, Mohn P, and Schwarz K Phys. Rev. B 47 5589 (1993)
- (200) Buchel’nikov V D, Vasil’ev A N, Dikshtein I E, and Shavrov V G Phys. Met. Metallogr. 85 1 (1998)
- (201) Buchel’nikov V D, Vasil’ev A N, Dikshtein I E, Zayak A T, Romanov V S, and Shavrov V G Phys. Met. Metallogr. 85 282 (1998)
- (202) Buchel’nikov V D et al. Vestn. Chelyabinsk. Univ., Ser. 6 Fiz. (1) 20 (1998)
- (203) Buchel’nikov V D et al. Vestn. Chelyabinsk. Univ., Ser. 6 Fiz. (1) 5 (1998)
- (204) Buchelnikov V D, Romanov V S, and Zayak A T J. Magn. Magn. Mater. 191 203 (1999)
- (205) Buchelnikov V D, Dalidovich D L, Zayak A T, and Shavrov V G Zh. Radioelektron. (virtual journal) (5) (2000); http://jre.cplire.ru/
- (206) Buchelnikov V D et al., in Non-Linear Electromagnetic Systems (ISEM’99) (Studies in Applied Electromagnetics and Mechanics, Vol. 18, Eds P Di Barba, A Savini) (Amsterdam: IOS Press, 2000) p 23
- (207) Buchelnikov V D et al., in Non-Linear Electromagnetic Systems (ISEM’99) (Studies in Applied Electromagnetics and Mechanics, Vol. 18, Eds P Di Barba, A Savini) (Amsterdam: IOS Press, 2000) p 63
- (208) Buchelnikov V, Zayak A, Vasil’ev A, and Takagi T Int. J. Appl. Electromagn. Mech. 12 19 (2000)
- (209) Shavrov V G, Buchel’nikov V D, and Zayak A T Phys. Met. Metallogr. 89 S84 (2000); Shavrov V G, Buchel’nikov V D, and Zayak A T, in Magnetizm Perekhodnykh Metallov i Splavov (Magnetism of Transition Metals and Alloys) (Ed. Yu A Izyumov) (Ekaterinburg: Izd. UrO RAN, 2000) p 166
- (210) Buchel’nikov V D, Zayak A T, Vasil’ev A N, Dalidovich D L, Shavrov V G, Takagi T, and Khovailo V V JETP 92 1010 (2001)
- (211) Buchel’nikov V D, Vasil’ev A N, Zayak A T, and Entel P JETP 92 1019 (2001)
- (212) Buchelnikov V, Zayak A, Vasil’ev A, Takagi T, Entel P, and Shavrov V, in Proc. Fourth Pacific Rim Intern. Conf. on Advanced Materials and Processing (PRICM4), (Eds S Hanada et al.) (Sendai: The Japan Institute of Metals, 2001) p 1697
- (213) Zayak A T, Buchelnikov V D, and Entel P Phase Transitions 75 243 (2002)
- (214) Buchel’nikov V D, Zayak A T, Vasil ev A N, Takagi T, Entel P, and Shavrov V G Phys. Met. Metallogr. 93 S69 (2002)
- (215) Buchelnikov V D, Zayak A T, and Entel P J. Magn. Magn. Mater. 242-245 1457 (2002)
- (216) Fradkin M A Phys. Rev. B 50 16326 (1994)
- (217) Gooding R J and Krumhansl J A Phys. Rev. B 38 1695 (1988)
- (218) Folkins I and Walker M B Phys. Rev. B 40 255 (1989)
- (219) Krumhansl J A and Gooding R J Phys. Rev. B 39 3047 (1989)
- (220) Krumhansl J A Solid State Comm. 84 251 (1992)
- (221) Inoue K Enami K, Yamaguchi Y, Ohoyama K, Morii Y, Matsuoka Y, and Inoue K J. Phys. Soc. Jpn. 69 3485 (2000)
- (222) Inoue K Enami K, Igawa M, Yamaguchi Y, Ohoyama K, Morii Y, Matsuoka Y, and Inoue K Int. J. Appl. Electromagn. Mech. 12 25 (2000)
- (223) Zuo F, Su X, and Wu K H Phys. Rev. B 58 11127 (1998)
- (224) Kartha S, Krumhansl J A, Sethna JP , and Wickham L K Phys. Rev. B 52 803 (1995)
- (225) Krumhansl J A Phase Transitions 65 109 (1998)
- (226) Cano A and Levanyuk A P Phys. Rev. B 62 12014 (2000)
- (227) Roitburd A L Sov. Phys. Usp. 17 326 (1974)
- (228) Hane K F and Shield T W Philos. Mag. A 78 1215 (1998)
- (229) Curnoe S H and Jacobs A E Phys. Rev. B 62 R11925 (2000)
- (230) O’Handley R C J. Appl. Phys. 83 3263 (1998)
- (231) L’vov V A, Gomonaj E V, and Chernenko V A J. Phys.: Condens. Matter 10 4587 (1998)
- (232) Chernenko V A, L’vov V A, and Cesari E J. Magn. Magn. Mater. 196-197 859 (1999)
- (233) Likhachev A A and Ullakko K Eur. Phys. J. B 14 263 (2000)
- (234) O’Handley R C, Murray S J, Marioni M, Nembach H, and Allen S M J. Appl. Phys. 87 4712 (2000)
- (235) Murray S J, O’Handley R C, and Allen S M J. Appl. Phys. 89 1295 (2001)
- (236) Buchel’nikov V D, Romanov V S, Vasil’ev A N, Takagi T, and Shavrov V G JETP 93 1302 (2001)
- (237) Buchel’nikov V D et al., in Splavy s Effektom Pamyati Formy i Drugie Perspektivnye Materialy: Materialy 38 Seminara ”Aktual’nye Problemy Prochnosti”, Posvyashchennogo Pamyati V A Likhacheva (Shape Memory Alloys and Other Promising Materials: Proc. 38th Workshop on the Pressing Problems of Strength of Materials, Dedicated to the Memory of V A Likhachev) Pt. 1 (St. Petersburg, 2001) p 48
- (238) Buchelnikov V D et al., in Applied Electromagnetics and Mechanics (Proc. of the 10th Intern. Symp. on Applied Electromagnetics and Mechanics, Tokyo, Japan, May 13-16, 2001) (JSAEM Studies in Applied Electromagnetics and Mechanics, Vol. 9, Eds T Takagi, M Uesaka) (Tokyo: JSAEM, 2001) p 437
- (239) Buchelnikov V D, Zayak A T, in Proc. of the Moscow Intern. Symp. on Magnetism (MISM’99), Moscow, June 20-24, 1999 Pt. 2 (Moscow: Izd. MSU, 1999) p 117
- (240) Buchel’nikov V D et al., in Novye Magnitnye Materialy Mikroelektroniki: Sbornik Trudov XVII Mezhdunarodnoi Shkoly-Seminara (New Magnetic Materials of Microelectronics: Proc. 17th Intern. Workshop), Moscow, June 20–23, 2000 (Moscow: URSS, 2000) p 784
- (241) Cherechukin A A, Dikstein I E, Khovailo V V, Kosolapov D V, Krasnoperov E P, Shavrov V G, Takagi T, Tulaikova A A, and Vasil’ev A N, in Proc. Fourth Pacific Rim Intern. Conf. on Advanced Materials and Processing (PRICM4) (Eds S Hanada et al.) (Sendai: The Japan Institute of Metals, 2001) p 1681
- (242) L’vov V A and Chernenko V A Eur. Phys. J.: Appl. Phys. 8 25 (1999)
- (243) Chernenko V, Babii O, L’vov V, and McCormick P G Mater. Sci. Forum 327-328 485 (2000)
- (244) Ge Y Sozinov A, Söderberg O, Lanska N, Heczko O, Ullakko K. and Lindroos V K Mater. Sci. Forum 394-395 541 (2002)
- (245) Taskaev S V and Buchel’nikov V D, in Novye Magnitnye Materialy Mikroelektroniki: Sbornik Trudov XVIII Mezhdunarodnoi Shkoly-Seminara (New Magnetic Materials of Microelectronics: Proc. 18th Intern. Workshop), Moscow, June 24–28, 2002 (Moscow: Izd. MGU, 2002) p 924
- (246) Intern. Conf. on Martensitic Transformations (ICOMAT-02), Espoo, Finland, June 10–14, 2002; J. Phys. IV (Paris) (to be publ.)
- (247) Wedel C, PhD Thesis (Sendai, Japan: Tohoku Univ., 2001)
- (248) Wedel C and Itagaki K J. Phase Equilib. 22 324 (2001)
- (249) Buchelnikov V D and Bosko S I, in Moscow Intern. Symp. on Magnetism, Moscow, June 20–24, 2002, Book of Abstracts (Moscow: Izd. MSU, 2002) p 230
- (250) Buchelnikov V D and Bosko S I J. Magn. Magn. Mater. 258 497 (2003)