The architecture of complex weighted networks
Abstract
Networked structures arise in a wide array of different contexts such as technological and transportation infrastructures, social phenomena, and biological systems. These highly interconnected systems have recently been the focus of a great deal of attention that has uncovered and characterized their topological complexity. Along with a complex topological structure, real networks display a large heterogeneity in the capacity and intensity of the connections. These features, however, have mainly not been considered in past studies where links are usually represented as binary states, i.e. either present or absent. Here, we study the scientific collaboration network and the world-wide air-transportation network, which are representative examples of social and large infrastructure systems, respectively. In both cases it is possible to assign to each edge of the graph a weight proportional to the intensity or capacity of the connections among the various elements of the network. We define new appropriate metrics combining weighted and topological observables that enable us to characterize the complex statistical properties and heterogeneity of the actual strength of edges and vertices. This information allows us to investigate for the first time the correlations among weighted quantities and the underlying topological structure of the network. These results provide a better description of the hierarchies and organizational principles at the basis of the architecture of weighted networks.
I Introduction
A large number of natural and man-made systems are structured in the form of networks. Typical examples include large communication systems (the Internet, the telephone network, the World-Wide-Web), transportation infrastructures (railroad and airline routes), biological systems (gene and/or protein interaction networks), and a variety of social interaction structures. barabasi99 ; barabasi02 ; mendesbook ; amaral . The macroscopic properties of these networks have been the subject of an intense scientific activity that has highlighted the emergence of a number of significant topological features. Specifically, many of these networks show the small-world property watts98 , which implies that the network has an average topological distance between the various nodes increasing very slowly with the number of nodes (logarithmically or even slower), despite showing a large degree of local interconnectedness typical of more ordered lattices. Additionally, several of these networks are characterized by a statistical abundance of “hubs” with a very large number of connections compared to the average degree value . The empirical evidence collected from real data indicates that this distinctive feature finds its statistical characterization in the presence of scale-free degree distributions , i.e., showing a power-law behavior for a significant range of values of barabasi02 ; mendesbook . These topological features turn out to be extremely relevant since they have a strong impact in assessing such networks’ physical properties as their robustness or vulnerability havlin00 ; newman00 ; barabasi00 ; pv01a .
While these findings alone might provide possibilities for threats analysis and policy decisions, yet networks are not only specified by their topology but also by the dynamics of information or traffic flow taking place on the structure. In particular, the heterogeneity in the intensity of connections may be very important in the understanding of social systems. Analogously, the amount of traffic characterizing the connections of communication systems or the quantity of traffic in large transport infrastructures is fundamental for a full description of these networks.
Motivated by these observations, we undertake in this paper the
statistical analysis of complex networks whose edges have assigned a
given weight (the flow or the intensity) and thus can be generally
described in terms of weighted graphs
weightbook ; yookwt . Working with two typical examples of this
kind of networks, we introduce some new metrics that combine in a
natural way both the topology of the connections and the weight
assigned to them. These quantities provide a general characterization
of the heterogenous statistical properties of weights and identify
alternative definitions of centrality, local cohesiveness, and
affinity. By appropriate measurements it is also possible to exploit
the correlation between the weights and the topological structure of
the graph, unveiling the complex architecture shown by real weighted
networks.
II Weighted networks data
In order to proceed to the general analysis of complex weighted networks we consider two specific examples for which it is possible to have a full characterization of the links among the elements of the systems, the world-wide airport transportation network and the scientist collaboration network.
World-wide Airport Network (WAN): We analyze the International Air Transportation Association (IATA) 111http://www.iata.org. database containing the world list of airports pairs connected by direct flights and the number of available seats on any given connection for the year 2002. The resulting air-transportation graph comprises vertices denoting airports and edges accounting for the presence of a direct flight connection. The average degree of the network is , while the maximal degree is . The topology of the graph exhibits both small-world and scale-free properties as already observed in different dataset analyses china ; luisair . In particular, the average shortest path length, measured as the average number of edges separating any two nodes in the network, shows the value , very small compared to the network size . The degree distribution, on the other hand, takes the form , where and is an exponential cut-off function, that finds its origin in physical constraints on the maximum number of connections that a single airport can handle amaral ; luisair . The airport connection graph is therefore a clear example of heterogeneous network showing scale-free properties on a definite range of degree values.
Scientific Collaboration Network (SCN): We consider the network of scientists who have authored manuscripts submitted to the e-print archive relative to condensed matter physics (http://xxx.lanl.gov/archive/cond-mat) between 1995 and 1998. Scientists are identified with nodes and an edge exists between two scientists if they have co-authored at least one paper. The resulting connected network has nodes, with an average degree (i.e. average number of collaborators) and maximal degree . The topological properties of this network and other similar networks of scientific collaborations have been studied in Ref. newman01 ; vicsek01 .
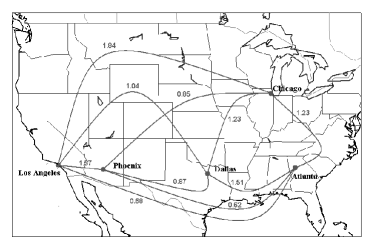
The properties of a graph can be expressed via its adjacency matrix , whose elements take the value if an edge connects the vertex to the vertex and otherwise. The data contained in the previous datasets permit to go beyond this topological representation by defining a weighted graph weightbook that assigns a weight or value characterizing each connecting link. In the case of the WAN the weight of an edge linking airports and represents the number of available seats in flights between these two airports. The inspection of the weights shows that the average numbers of seats in both directions are identical for an overwhelming majority of edges. In the following we will thus work with the symmetric undirected graph and avoid the complication deriving from flow imbalances. We show an example of the resulting weighted graph in Fig. 1. Noticeably, the above definition of weights is a straightforward and an objective measure of the traffic flow on top of the network.
For the SCN we follow the definition of weight introduced in Ref. newman01 : The intensity of the interaction between two collaborators and is defined as
| (1) |
where the index runs over all papers, is the number of
authors of the paper , and is if author has
contributed to paper , and otherwise. While any definition of
the intensity of a connection in social networks is depending on the
particular elements chosen to be relevant, the above definition seems
to be rather objective and representative of the scientific
interaction: It is large for collaborators having many papers in
common but the contribution to the weight introduced by any given
paper is inversely proportional to the number of
authors.
III Centrality and weights
In order to take into account the information provided by the weighted graph, we shall identify the appropriate quantities characterizing it structure and organization at the statistical level. The statistical analysis of weights between pairs of vertices indicates the presence of right skewed distributions, already signaling a high level of heterogeneity in the system for both the WAN and the SCN as also reported in Refs. china ; newman01 . It has been observed, however, that the individual edge weights do not provide a general picture of the network’s complexity yookwt . A more significative measure of the network properties in terms of the actual weights is obtained by looking at the vertex strength , defined as
| (2) |
This quantity measures the strength of vertices in terms of the total weight of their connections. In the case of the WAN the vertex strength simply accounts for the total traffic handled by each airport. For the SCN, on the other hand, the strength is a measure of scientific productivity since it is equal to the total number of publications of any given scientist. This quantity is a natural measure of the importance or centrality of a vertex in the network.
The identification of the most central nodes in the system is a major issue in networks characterization freeman77 . The most intuitive topological measure of centrality is given by the degree—more connected nodes are more central. However, more is not necessarily better. Indeed, by considering solely the degree of a node we overlook that nodes with small degree may be crucial for connecting different regions of the network by acting as bridges. In order to quantitatively account for the role of such nodes it has been introduced the concept of betweenness centrality freeman77 ; newman01 ; goh01 , that is defined as the number of shortest paths between pairs of vertices that pass through a given vertex notebet . Central nodes are therefore part of more shortest paths within the network than peripheral nodes. Moreover, the betweenness centrality is often used in transport networks to provide an estimate of the traffic handled by the vertices, assuming that the number of shortest paths is a zero-th order approximation to the frequency of use of a given node 222For the airport network, the analysis of the betweenness centrality and its correlation with the degree has been discussed in Ref. luisair .. The above definition of centrality relies only on topological elements. It is therefore intuitive to consider the alternative definition of centrality constructed by looking at the strength of the vertices as a more appropriate definition of the importance of a vertex in weighted networks. For instance, in the case of the WAN this quantity provides the actual traffic going through the vertex , and it is natural to study how it compares and correlates with the topological measures of centrality.
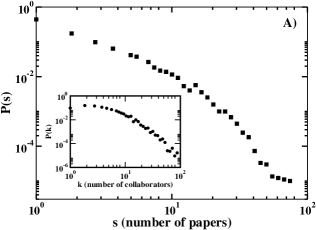
The probability distribution that a vertex has strength is heavy tailed in both networks and the functional behavior exhibits similarities with the degree distribution (see Fig. 2). A precise functional description of the heavy-tailed distributions may be very important in understanding the network evolution and will be deferred to future analysis. This behavior is not unexpected since it is plausible that the strength increases with the vertex degree , and thus the slow decaying tail of stems directly from the very slow decay of the degree distribution.
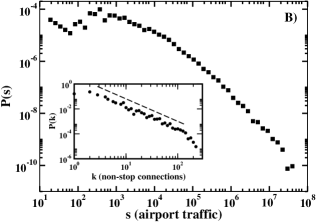
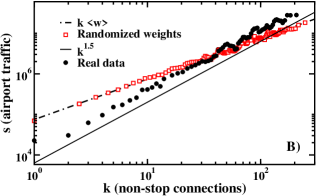
In order to shed more light on the relation between the vertices’ strength and degree, we investigate the dependence of on . We find that the average strength of vertices with degree increases with the degree as
| (3) |
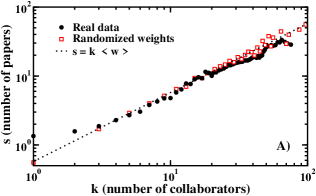
In the absence of correlations between the weight of edges and the degree of vertices, Eq. (2) implies that , where is the average weight in the network. The strength of a vertex is then simply proportional to its degree, yielding an exponent , and the two quantities provide therefore the same information on the system. In Fig. 3 we report the behavior obtained for both the real weighted networks and their randomized versions, generated by a random re-distribution of the actual weights on the existing topology of the network. For the SCN the curves are very similar and well fitted by the uncorrelated approximation . Strikingly, this is not the case of the WAN. Fig. 3B clearly shows a very different behavior for the real data set and its randomized version. In particular, the power-law fit for the real data gives an “anomalous” exponent . This implies that the strength of vertices grows faster than their degree, i.e. the weight of edges belonging to highly connected vertices tends to have a value higher than the one corresponding to a random assignment of weights. This denotes a strong correlation between the weight and the topological properties in the WAN, where the larger is an airport, the more traffic it can handle.
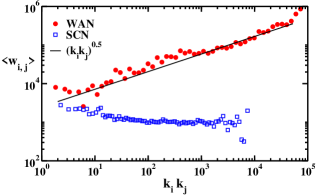
The fingerprint of these correlations is also observed in the dependence of the weight on the degrees of the end point nodes and . As we can see in Fig. 4, for the WAN the behavior of the average weight as a function of the end points degrees can be well approximated by a power-law dependence
| (4) |
with an exponent . This exponent can be related to the exponent by noticing that , resulting in , if the topological correlations between the degree of connected vertices can be neglected. This is indeed the case of the WAN where the above scaling relation is well satisfied by the numerical values provided by the independent measurements of the exponents. In the SCN, instead, is almost constant for over two decades confirming a general lack of correlations between the weights and the vertices degree.
Analogously, a study of the average value of the strength for vertices with betweenness shows that the functional behavior can be approximated by a scaling form with and for the SCN and the WAN, respectively. As before, the comparison between the behavior of the real data and the randomized case shows more pronounced differences in the case of the WAN. In both networks, the strength grows with the betweenness faster than in the randomized case, specially in the WAN. This is another clear signature of the correlations between weighted properties and the network topology.
IV Structural organization of weighted networks
Along with the general vertices hierarchy imposed by the strength distribution—the larger the more central—complex networks show an architecture imposed by the structural and administrative organization of these systems. For instance, topical areas and national research structures give rise to well defined groups or communities in the SCN. In the WAN, on the other hand, different hierarchies correspond to domestic or regional airport groups and intra-continental transport systems; political or economical factors can as well impose additional constraints to the network structure luisair . In order to uncover these structures, some topological quantities are customarily studied. The clustering coefficient measures the local group cohesiveness and is defined for any vertex as the fraction of connected neighbors of watts98 . The average clustering coefficient thus expresses the statistical level of cohesiveness measuring the global density of interconnected vertices’ triples in the network. Further information can be gathered by inspecting the average clustering coefficient restricted to classes of vertices with degree . Often, exhibits a highly non-trivial behavior with a power-law decay as a function of , signaling a hierarchy in which low degree vertices belong generally to well interconnected communities (high clustering coefficient), while hubs connect many vertices that are not directly connected (small clustering coefficient) alexei02 ; ravasz02 . Another quantity used to probe the networks’ architecture is the behavior of the average degree of nearest neighbors, , for vertices of degree alexei . This last quantity is related to the correlations between the degree of connected vertices maslov02 since it can be expressed as , where is the conditional probability that a given vertex with degree is connected to a vertex of degree . In the absence of degree correlations, does not depend on and neither does the average nearest neighbors’ degree; i.e. alexei . In the presence of correlations, the behavior of identifies two general classes of networks. If is an increasing function of , vertices with high degree have a larger probability to be connected with large degree vertices. This property is referred in physics and social sciences as assortative mixing assortative . On the contrary, a decreasing behavior of defines disassortative mixing, in the sense that high degree vertices have a majority of neighbors with low degree, while the opposite holds for low degree vertices.
The above quantities provide clear signatures of a structural organization of networks in which different degree classes show different properties in the local connectivity structure. However, they are defined solely on topological grounds and the inclusion of weights and their correlations might change consistently our view of the hierarchical and structural organization of the network (see Fig. 5). This can be easily understood with the simple example of a network in which the weights of all edges forming triples of interconnected vertices are extremely small. Even for a large clustering coefficient, it is clear that these triples have a minor role in the network dynamics and organization, and that the clustering properties are definitely overestimated by a simple topological analysis. Similarly, high degree vertices could be connected to a majority of low degree vertices while concentrating the largest fraction of their strength only on the vertices with high degree. In this case the topological information would point out to disassortative properties while the network could be considered assortative in an effective way, since the more relevant edges in term of weights are linking high degree vertices.
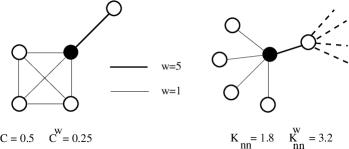
In order to solve the previous incongruities we introduce new metrics that combine the topological information with the weight distribution of the network. First, we consider the weighted clustering coefficient defined as
| (5) |
This is a measure of the local cohesiveness that takes into account the importance of the clustered structure on the basis of the amount of traffic or interaction intensity actually found on the local triples. Indeed, is counting for each triple formed in the neighborhood of the vertex the weight of the two participating edges of the vertex . In this way we are not just considering the number of closed triangles in the neighborhood of a vertex but also their total relative weight with respect to the vertex’ strength. The normalization factor account for the weight of each edge times the maximum possible number of triangles it may participate, and it ensures that . Consistently, the definition recovers the topological clustering coefficient in the case that . Next we define and as the weighted clustering coefficient averaged over all vertices of the network and over all vertices with degree , respectively. This quantities provide global information on the correlation between weights and topology, specially by comparing them with their topological analogs. In the case of a large randomized network (lack of correlations) it is easy to see that and . In real weighted networks, however, we can face two opposite cases. If , we are in presence of a network in which the interconnected triples are more likely formed by the edges with larger weights. On the contrary, signals a network in which the topological clustering is generated by edges with low weight. In this case it is obvious that the clustering has a minor effect in the organization of the network since the largest part of the interactions (traffic, frequency of the relations, etc.) is occurring on edges not belonging to interconnected triples. The same may happen for , for which it is also possible to analyze the variations with respect to the degree class .
Along with the weighted clustering coefficient, we introduce the weighted average nearest neighbors degree, defined as
| (6) |
In this case, we perform a local weighted average of the nearest neighbor degree according to the normalized weight of the connecting edges, . This definition implies that if the edges with the larger weights are pointing to the neighbors with larger degree and in the opposite case. The thus measures the effective affinity to connect with high or low degree neighbors according to the magnitude of the actual interactions. As well, the behavior of the function marks the weighted assortative or disassortative properties considering the actual interactions among the system’s elements.
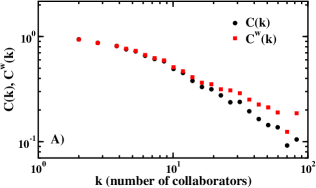
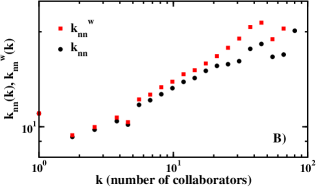
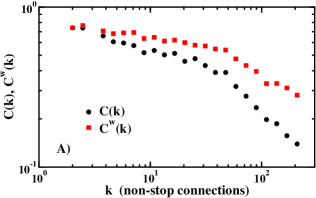
As a general test, we inspect the results obtained for both the SCN and the WAN by comparing the regular topological quantities with those obtained with the weighted definition introduced here. The topological measurements tell us that the SCN has a continuously decaying spectrum (see Fig. 6a). This implies that hubs present a much lower clustered neighborhood than low degree vertices. This effect can be interpreted as the evidence that authors with few collaborators usually work within a well defined research group in which all the scientists collaborate together (high clustering). Authors with a large degree, however, collaborate with different groups and communities which on their turn do not have often collaborations, thus creating a lower clustering coefficient. Furthermore, the SCN exhibits an assortative behavior in agreement with the general evidence that social networks are usually denoted by a strong assortative character assortative (see Fig. 6b). The analysis of weighted quantities confirms this topological picture, providing further information on the network architecture. The weighted clustering coefficient is very close to the topological one (). This fact states in a quantitative way that group collaborations tend on average to be stable and determine the average intensity of the interactions in the network. In addition, the inspection of (see Fig. 6a) shows generally that for the weighted clustering coefficient is larger than the topological one. This implies that high degree authors (i.e. with many collaborators) tend to publish more papers with interconnected groups of co-authors. This is eventually a signature that influential scientists form stable research groups where the largest part of their production is obtained. Finally, the assortative properties find a clearcut confirmation in the weighted analysis with a strikingly growing as a power-law as a function of .
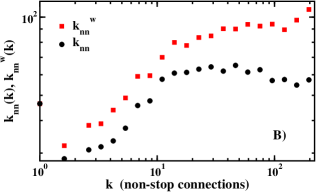
A different picture is found in the WAN, where the weighted analysis provides a richer and somehow different scenario. This network also shows a decaying , consequence of the role of large airports that provide non-stop connections to very far destinations on an international and intercontinental scale. These destinations are usually not interconnected among them, giving rise to a low clustering coefficient for the hubs. We find, however, that , indicating an accumulation of traffic on interconnected groups of vertices. The weighted clustering coefficient also has a different behavior in that its variation is much more limited in the whole spectrum of . This implies that high degree airports have a progressive tendency to form interconnected groups with high traffic links, thus balancing the reduced topological clustering. Since high traffic is associated to hubs, we have a network in which high degree nodes tend to form cliques with nodes with equal or higher degree, the so-called rich-club phenomenon richclub . An interesting evidence emerges also from the comparison of and . Indeed, the topological does show an assortative behavior only at small degrees. For , approaches a constant value, a fact revealing an uncorrelated structure in which vertices with very different degrees have a very similar neighborhood. The analysis of the weighted , however, exhibits a pronounced assortative behavior in the whole spectrum, providing a different picture in which high degree airports have a larger affinity for other large airports where the major part of the traffic is directed.
V Conclusions
We have shown that a more complete view of complex networks is
provided by the study of the interactions defining the links of these
systems. The weights characterizing the various connections exhibit
complex statistical features with highly varying distributions and
power-law behavior. In particular we have considered the specific
examples of the scientific collaboration and world-wide airport
networks where it is possible to appreciate the importance of the
correlations between weights and topology in the characterization of
real networks properties. Indeed, the analysis of the weighted
quantities and the study of the correlations between weights and
topology provide a complementary perspective on the structural
organization of the network that might be undetected by quantities
based only on topological information. Our study thus
offer a quantitative and general approach to understand
the complex architecture of real weighted networks.
Acknowledgements.
We thank IATA for making the airline commercial flight database available to us. We also thank M.E.J. Newman for conceding us the possibility of using the scientific collaboration network data (see http://www-personal.umich.edu/mejn/collaboration/). We are grateful to L. A. N. Amaral and R. Guimerà for the many discussions and sharing of results during the various stages of this work. A.B., R.P.-S. and A.V. are partially funded by the European Commission - Fet Open Project COSIN IST-2001-33555. R.P.-S. acknowledges financial support from the Ministerio de Ciencia y Tecnología (Spain) and from the Departament d’Universitats, Recerca i Societat de la Informació, Generalitat de Catalunya (Spain).References
- (1) Barabási, A.-L & Albert, R. (1999) Science 286, 509.
- (2) Albert, R. & Barabási, A.-L. (2002) Rev. Mod. Phys. 74, 47–97.
- (3) Dorogovtsev, S. N. & Mendes, J. F. F. (2003) Evolution of networks: From biological nets to the Internet and WWW. (Oxford University Press, Oxford).
- (4) Amaral, L. A. N., Scala, A., Barthélemy, M, & Stanley, H. E. (2000) Proc. Natl. Acad. Sci. USA 97, 11149–11152.
- (5) Watts, D. J. & Strogatz, S. H. (1998) Nature 393, 440–442.
- (6) Cohen, R., Erez, K., ben Avraham, D., & Havlin, S. (2000) Phys. Rev. Lett. 85, 4626–4628.
- (7) Callaway, D. S., Newman, M. E. J., Strogatz, S. H., & Watts, D. J. (2000) Phys. Rev. Lett. 85, 5468–5471.
- (8) Albert, R., Jeong, H., & Barabási, A.-L. (2000) Nature 406, 378–382.
- (9) Pastor-Satorras, R. & Vespignani, A. (2001) Phys. Rev. Lett. 86, 3200–3203.
- (10) Clark, J. & Holton, D. A. (1998) A first look at graph theory. (World Scientific, Singapore).
- (11) Yook, S. H., Jeong, H., Barabási, A.-L., & Tu, Y. (2001) Phys. Rev. Lett. 86, 5835–5838.
- (12) Li, W. & Cai, X. (2003) Statistical analysis of airport network of china. e-print cond-mat/0309236.
- (13) Guimerà, R., Mossa, S., Turtschi, A., & Amaral, L. A. N. (2003). submitted.
- (14) Newman, M. E. J. (2001) Phys. Rev. E 64, 016131; (2001) Phys. Rev. E 64, 016132.
- (15) Barabási A. L., Jeong H., Néda Z., Ravasz E., Schubert A. & Vicsek T. (2001) Physica A 299, 559.
- (16) Freeman, L. C. (1977) Sociometry 40, 35–41.
- (17) Goh, K.-I., Kahng, B. & Kim D. (2001) Phys. Rev. Lett. 87, 278701.
- (18) More precisely, if is the total number of shortest paths from to and is the number of these shortest paths that pass through the vertex , the betweenness of the vertex is defined as , where the sum runs over all pairs with . An efficient algorithm to compute betweenness centrality is reported Brandes, U. (2001) Journal of Math. Sociology 25, 163–177.
- (19) Vázquez, A., Pastor-Satorras, R., & Vespignani, A. (2002) Phys. Rev. E 65, 066130.
- (20) Ravasz, E. & Barabási, A.-L. (2003) Phys. Rev. E 67, 026112.
- (21) Pastor-Satorras, R., Vázquez, A., & Vespignani, A. (2001) Phys. Rev. Lett. 87, 258701.
- (22) Maslov, S. & Sneppen, K. (2001) Science 296 910.
- (23) Newman, M. E. J. (2002) Phys. Rev. Lett. 89, 208701.
- (24) Zhou, S. & Mondragon, R. J. (2003) The missing links in the BGP-based AS connectivity maps. e-print cs.NI/0303028.