Dynamical Motifs: Building Blocks of Complex Network Dynamics
Abstract
Spatio-temporal network dynamics is an emergent property of many complex systems which remains poorly understood. We suggest a new approach to its study based on the analysis of dynamical motifs – small subnetworks with periodic and chaotic dynamics. We simulate randomly connected neural networks and, with increasing density of connections, observe the transition from quiescence to periodic and chaotic dynamics. We explain this transition by the appearance of dynamical motifs in the structure of these networks. We also observe domination of periodic dynamics in simulations of spatially distributed networks with local connectivity and explain it by absence of chaotic and presence of periodic motifs in their structure.
pacs:
89.75.Hc, 87.18.Sn, 05.45.-a, 82.39.RtDynamics in networks underlie functioning of many complex systems such as the brain Koch and Laurent (1999), cellular regulatory machinery Goldbeter (2002), ecosystems Kondoh (2003) and many others. These systems exhibit a wide repertoire of dynamics, ranging from periodic oscillations in cell cycle and brain rhythms to chaos in food webs and chemical reactions. Despite the recent rapid advancements in our ability to elucidate statistical properties of the underlying networks Albert and Barabasi (2002); Dorogovtsev and Mendes (2002); Newman (2003), surprisingly little is understood about their dynamical behavior. This is due to several reasons, in particular, inadequacy of the methods of nonequilibrium statistical mechanics in the domain of heterogeneous mesoscopic systems and inability of the dynamical systems theory to deal with systems having more than order-1 dimensions.
Fundamental problem which one faces while trying to understand dynamics in complex networks is the strong influence of their structure on their non-Hamiltonian dynamics. This influence may induce long term connectivity-dependent spatio-temporal correlations which present formidable problem for understanding of the dynamics. Statistical methods allow to solve this problem in the limit of infinite-size networks Sompolinsky et al. (1988), but they are not applicable to the study of realistic networks with non-uniform connectivity and a relatively small size.
It was recently found that many real networks include statistically significant subnetworks, so-called motifs, in their structure Milo et al. (2002). In this Letter we suggest the use of dynamical motifs – small subnetworks with non-trivial dynamics – as a new approach to the study of recurrent dynamics in complex networks. In it we combine dynamical and statistical methods to identify dynamical motifs and evaluate probability of their occurrence in the structure of networks. We show that the emergence of periodic and chaotic dynamics in networks of increasing structural complexity is linked to the appearance of periodic and chaotic motifs in their connectivity. We also consider spatially distributed networks with local connectivity and show that chaotic motifs are absent in their structure. We also suggest that this approach may be useful for study of the dynamics in networks of arbitrary structure and size.
In many complex systems the dynamics of individual elements and the rules of their interaction are relatively simple and the resulting complex behavior is an emergent consequence of these interactions. Hence, in order to study the influence of the structure on the dynamics of networks let us focus on models with simplest interactions and dynamics at each node. Let , be a set of variables describing properly scaled states of elements connected in a network. Consider the time evolution of network’s state vector described by the following set of first order differential equations
| (1) |
where is a set of sigmoid nonlinearities with value ranges. This general class of models includes continuous version of Random Boolean (Genetic) Networks (cRBN) Mestl et al. (1997); Glass and Hill (1998), in which are randomly chosen Boolean functions of their arguments, and continuous-time Artificial Neural Networks (cANN) Hopfield (1984), in which , where is the coupling matrix and are thresholds. Both of these models were shown to exhibit complex periodic and chaotic dynamics in the biologically relevant cases of intermediate probabilities of gene expression in cRBN Glass and Hill (1998) and non-symmetric interactions in cANN Sompolinsky et al. (1988).
To illustrate the use of dynamical motifs we employ a simple cANN model with , uniform external excitation and inhibitory interactions of the same strength: , where and is the adjacency matrix of the directed graph on which the network is defined. In this setting the model is similar to the simplified version of a balanced network model vanVreeswijk and Sompolinsky (1996) with excitatory connections replaced by a uniform field and can be viewed as a simple model of a cortical microcircuit. It is also an extension of the concept of winnerless competitive networks Rabinovich et al. (2001) to the case of arbitrary connectivity. However, methods presented in this Letter can be used for other models as well.
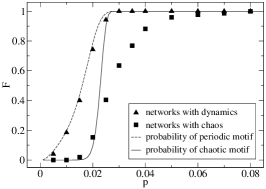
We have performed Monte Carlo simulations of the described above cANN model defined on an ensemble of random networks with nodes and uniform probability of node-to-node connections, i.e., an Erdős-Rényi (ER) ensemble. A sample of random networks was generated for each considered and cANN dynamics was simulated 100 times on each of the networks, each time starting with different initial condition taken at random from the hypercube . Sets of initial conditions were considered in order to eliminate the influence of the basins of attraction in multistable networks which in itself is a complicated issue requiring separate research. Largest Lyapunov exponent was calculated in each simulation. Networks with at least one initial condition leading to , typically were classified as having limit cycle dynamics and with , typically as having chaotic dynamics. As the probability of connections was increased, the transition from fixed point to periodic and chaotic dynamics was observed around (Fig. 1, triangles). The transition to solely chaotic dynamics occurred around (Fig. 1, squares).
We now apply the concept of dynamical motifs in order to explain such observations and make further predictions about the dynamics in networks. The main idea behind this approach is that the transition to periodic or chaotic overall dynamics in a network occurs due to the appearance in its structure of small, not necessary isolated, subnetworks which have the same type of dynamics. We call these subnetworks dynamical motifs. Of course many dynamical motifs may be present in a given dynamical network, but at least one is needed in order for the network to have a given type of dynamics. The dynamical phase transitions that are observed in models of complex networks are then identified with the percolations of dynamical motifs, i.e., -to- transitions in the probability of their occurrence.
Let us consider an ER network with the probability of node-to-node connection . The probability that some nodes of this network form a given motif with links and no self-loops is equal to . It is possible that some of the nodes in the motif are suppressed by connections from a number of nodes outside of a motif that are frozen in the state. Such connections would suppress dynamics of the motif and should be ruled out. By excluding them we obtain corrected probability
| (2) |
It is difficult to calculate exactly the probability to find such motifs in a network. However, approximate calculation of the probability to encounter one or more motifs is straight forward and is expected to work well in the case of sparsely connected networks ():
| (3) | |||||
where is the number of ways to pick nodes of the motif from the -node network multiplied by – number of ways to label a motif, with being the order of motif’s automorphism group. This formula predicts percolation of these motifs at some intermediate value of which depends on and . We are interested in the values of and for which the percolation occurs at the smallest . Let us define it by the point where . Then
| (4) |
Assuming and we find that . To minimize , should be maximized and hence subnetworks with most nodes and least links will appear first as is increased from .
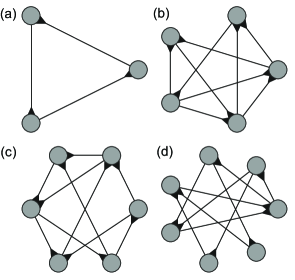
Subnetworks with limit cycle dynamics include 3-loop (Fig. 2(a)), 4-loop and other, more complicated, structures. Since for the -loop and , 3-loop has smallest . According to (3), its probability of occurrence is given by
| (5) |
and is plotted in Fig. 1 by a dashed line (with evaluated from simulations). This estimate predicts the appearance of dynamics in ER networks very accurately.
In order to find chaotic motifs we used the nauty package McKay (1998) to generate all possible non-isomorphic directed graphs with up to 8 nodes and 11 links, simulated the cANN dynamics on them and calculated the largest Lyapunov exponent for each. Digraphs with , typically were classified as chaotic. In Fig. 2(b-d) we show the first three chaotic motifs in the order of increasing number of nodes (5, 6 and 7 nodes) and minimal number of links (9, 10 and 10 links). Also, we found six non-isomorphic chaotic motifs with 8 nodes and 11 links, four of them with and two with . Numerical evaluations of according to (4) indicate that the latter motifs have smallest . Probability to find one or more such motifs in an ER network is given by
| (6) |
and is piloted in Fig. 1 by a solid line (with evaluated from simulations of chaotic networks). As can be seen from the plot, this prediction is reasonably good. The discrepancy may be caused by the approximate nature of the estimate (3), severe undersampling of the network space in simulations and disregard of the fact that not only frozen, but also periodically oscillating external nodes suppress chaos in these motifs.
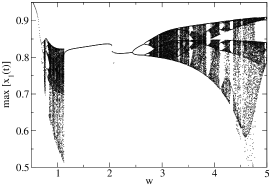
While the origin of periodic dynamics in -loops is obvious as they merely are negative feedback loops, the nature of chaos in chaotic motifs is not self-evident. We have traced the route to chaos in the first chaotic motif by lowering to and then gradually increasing it. In Fig. 3 the bifurcation diagram of the local maxima of oscillations is plotted. This diagram reveals two period doubling cascades, one starting around and another one around .
However, there are no conclusive experimental observations of chaotic dynamics in either genetic or neuronal networks. Presence of chaotic dynamics would be inconsistent with the requirements of robustness and reproducibility of the response imposed on the living organisms by the environment. On the other hand, periodic dynamics in these networks are very common. Hence, some of the assumptions that were used in these simplified models must be wrong. As we show below, one of them is the assumption of uniformly random connectivity. Recent experimental data suggests that metabolic networks possess scale-free structure Jeong et al. (2000) while neuronal networks are highly clustered on both small Shefi et al. (2002) and large Hilgetag et al. (2000) spatial scales. Moreover, neurons in the brain frequently form ordered spatial structures with distance-dependent probabilities of connections, so-called cortical microcircuits Silberberg et al. (2002); Maass et al. (2002).
To illustrate the influence of spatial structure on the dynamical properties of networks we simulated the cANN model on the 12-by-12 two-dimensional square lattice with neuron-to-neuron connection probabilities obeying Gaussian distribution and forbidden self-connections:
| (7) |
where is a metric distance between neurons and , is the length scale of the distribution, is the average number of connections per neuron and is the Kronecker delta. In effect, controls clustering of the connectivity, with values close to corresponding to networks with mostly local connectivity and large values effectively diminishing the role of spatial structure and corresponding to ER-like connectivity.
We generated a random sample of 1000 such networks with and . As in the case of an ER sample, cANN dynamics was simulated in each of the networks for 100 different random initial conditions and the largest Lyapunov exponent was calculated in each simulation. An average connectivity corresponds to which has led to approximately of chaotic networks in a sample of ER ensemble (Fig. 1(b)). On the contrary, around of the networks with exhibited periodic dynamics and only about were chaotic. This result indicates that clustering plays an important role in defining dynamical properties of neural networks. It may support an observation that many real neuronal networks are locally clustered and exhibit reproducible, except for stochastic effects, dynamics.
We now show how the idea of dynamical motifs may be used to understand these observations. Let us enumerate grid nodes by and consider a motif with nodes and links placed on the grid. We label its nodes by and its links by , , …, with , denoting ordered pairs of nodes that are connected. Probability for the grid nodes and to be connected is distance-dependent and is given by (7). Then the average probability that nodes of a network form this motif is obtained by averaging over all possible placements of its nodes on a grid:
| (8) |
where and are all the pairs of unconnected nodes. For example, an average probability for a 3-loop (Fig. 2(a)) is As expected, in the limit of distance-independent probabilities expression (8) becomes equivalent to the ER case. Probability of occurrence of one or more motifs in a network can again be approximated by (3). It is approximately 1 for 3- and 4-loops and for the (5; 9) motif in networks with . Other chaotic motifs would be even less probable because connection probability falls off quickly with distance in these networks. Also, for the (5; 9) motif in networks with . Hence, periodic motifs are present and chaotic motifs are absent in spatial networks with local connectivity (), but chaotic motifs are present in non-local networks with . These calculations may also explain recent observations of periodic and chaotic dynamics in models of cortical neural microcircuits with local and non-local spatial organization of connectivity Maass et al. (2002). Eq. (8) may also be applied in the study of networks with other distributions of connectivity.
In conclusion, a method to study dynamical behavior of networks by examining minimal building blocks of the dynamics was suggested. Calculations of abundance of dynamical motifs in networks with different structure allow to study and control dynamics in these networks by choosing connectivity that maximizes the probability of motifs with desirable dynamics and minimizes probability of motifs with unacceptable dynamics. Using this method we predict that connectivity of cortical microcircuits might be such that it minimizes the occurrence of chaotic motifs in their structure.
It was shown in Milo et al. (2002) that many real networks have 3-loops in their structure. In most cases there are very few of such loops and it was argued that their presence is not statistically significant. However, we suggest that such dynamical motifs are important because presence of even one or two of them may profoundly influence dynamical behavior of the whole network by slaving dynamics of many adjacent nodes.
Acknowledgements.
The author would like to thank Ramon Huerta, Mikhail Rabinovich, Michael Cross and Dmitri Chklovskii for usefull discussions, Brendan McKay for extending his nauty package with digraphs and Gilles Laurent for continuous inspiration and support. This work was partially supported by NSF grants EIA-0130708 and EIA-0130746 and DOE grant DE-FG03-96ER14592.References
- Koch and Laurent (1999) C. Koch and G. Laurent, Science 284, 96 (1999).
- Goldbeter (2002) A. Goldbeter, Nature 420, 238 (2002).
- Kondoh (2003) M. Kondoh, Science 299, 1388 (2003).
- Albert and Barabasi (2002) R. Albert and A. L. Barabasi, Rev. Mod. Phys. 74, 47 (2002).
- Dorogovtsev and Mendes (2002) S. N. Dorogovtsev and J. F. F. Mendes, Adv. Phys. 51, 1079 (2002).
- Newman (2003) M. E. J. Newman, SIAM Rev. 45, 167 (2003).
- Sompolinsky et al. (1988) H. Sompolinsky, A. Crisanti, and H. J. Sommers, Phys. Rev. Lett. 61, 259 (1988).
- Milo et al. (2002) R. Milo et al., Science 298, 824 (2002).
- Mestl et al. (1997) T. Mestl, R. J. Bagley, and L. Glass, Phys. Rev. Lett. 79, 653 (1997).
- Glass and Hill (1998) L. Glass and C. Hill, Europhys. Lett. 41, 599 (1998).
- Hopfield (1984) J. J. Hopfield, Proc. Natl. Acad. Sci. U.S.A. 81, 3088 (1984).
- vanVreeswijk and Sompolinsky (1996) C. vanVreeswijk and H. Sompolinsky, Science 274, 1724 (1996).
- Rabinovich et al. (2001) M. I. Rabinovich et al., Phys. Rev. Lett. 87, 068102 (2001).
- McKay (1998) B. D. McKay, J. Algorithms 26, 306 (1998).
- Jeong et al. (2000) H. Jeong et al., Nature 407, 651 (2000).
- Shefi et al. (2002) O. Shefi et al., Phys. Rev. E 66, 021905 (2002).
- Hilgetag et al. (2000) C. C. Hilgetag et al., Philos. Trans. R. Soc. London, Ser. B 355, 91 (2000).
- Silberberg et al. (2002) G. Silberberg, A. Gupta, and H. Markram, Trends Neurosc. 25, 227 (2002).
- Maass et al. (2002) W. Maass, T. Natschlager, and H. Markram, Neural Comp. 14, 2531 (2002).