Demonstration of a 1/4 cycle phase shift in the radiation-induced oscillatory-magnetoresistance in GaAs/AlGaAs devices
Abstract
We examine the phase and the period of the radiation-induced oscillatory-magnetoresistance in GaAs/AlGaAs devices utilizing in-situ magnetic field calibration by Electron Spin Resonance of DiPhenyl-Picryl-Hydrazal (DPPH). The results confirm a -independent 1/4 cycle phase shift with respect to the condition for , and they also suggest a small ( 2) reduction in the effective mass ratio, , with respect to the standard value for GaAs/AlGaAs devices.
pacs:
73.21.-b,73.40.-c,73.43.-f; Journal-Ref: Phys. Rev. Lett. 92, 146801 (2004)Measurements 1 of GaAs/AlGaAs devices including a 2-Dimensional electron system (2DES) have recently shown that vanishing resistance can be induced by photo-excitation at liquid helium temperatures, in a weak-magnetic-field large-filling-factor limit.1 ; 2 ; 3 The possibility of identifying a new physical mechanism for inducing vanishing resistance in the 2DES has motivated much theoretical interest in this phenomenon,4 ; 5 ; 6 ; 7 ; 8 ; 9 which shares features of the zero-resistance states in the quantum Hall situation, minus Hall quantization.10 ; 11
Experiments suggest that this novel effect is characterized, in the Hall geometry, by a wide magnetic field, , interval where the diagonal resistance, , becomes exponentially small upon photo-excitation in the low temperature, , limit.1 ; 2 ; 12 Measurements have also indicated that increasing the radiation frequency, , linearly shifts distinguishing features to higher .13 ; 14 Thus, one might define from a field scale , where is the electron-charge, and is an effective mass.1 According to theory, the observed periodicity reflects the interplay between the photon energy, , and integral () cyclotron energies, , and is defined by .4 ; 6 ; 8 Hence, in the expression for , is a known constant, can be measured accurately, and can be taken, initially, to be the standard value for in GaAs/AlGaAs, although it could involve corrections.
A problem of interest is to identify the intervals that exhibit vanishing resistance at a fixed , and to connect them in a simple way to because the relation between the two scales , which is set by , is likely to be essential in the underlying physics. In earlier work, we had reported that resistance minima occur about and resistance maxima transpire about , with =1,2,3… 1 This ”minima about ” result might also be loosely reformulated as a ”1/4 cycle phase shift” with respect to the condition.15
Our ”minima about ” result seems incongruent, however, with a report which identified radiation induced resistance minima with , i.e., , and resistance maxima with , i.e., , where .14 Briefly, that study of low mobility specimens exhibited -insensitive oscillations, a large non-vanishing resistance at the minima even at the lowest , and the absence of a phase shift.14 A subsequent study of high mobility specimens identified resistance maxima with , as it placed resistance minima on the high magnetic field side of .2
A recent reformulation16 asserts that the phase of the oscillations in ref.2 are consistent with a 1/4 cycle phase shift,1 but only at low-, i.e., . Although this reinterpretation has helped to bring overlap between theory,4 ; 6 ; 8 and recent experiment,1 ; 2 ; 12 ; 13 ; 16 there continues to be a phase-variance in the regime of low , , between our initial report announcing these novel zero-resistance states [ZRS], and the report by Zudov et al., confirming the same.1 ; 2
Phase characterization in this context requires an accurate measurement of since the observed oscillations are referenced to , which sets . In the laboratory, the transport set-up typically includes a high-field superconducting magnet, and is often determined from the magnet coil current, , via a calibration constant. At low-, , this approach to -measurement can be unreliable due to nonlinearity and hysteresis in the characteristics of the field-coil, and offsets due to trapped flux and/or current-offsets in the magnet power supply. An in-situ Hall probe can be applied to correct this problem. However, even this approach is prone to field measurement errors arising from misalignment-voltages in the Hall sensor or changes in the Hall constant.17 To reduce such uncertainties, we have carried out microwave transport studies of the 2DES with in-situ -field calibration by Electron Spin Resonance (ESR) of DiPhenyl-Picryl-Hydrazal (DPPH). The results demonstrate a -independent 1/4 cycle phase shift in the radiation-induced oscillatory-magnetoresistance, and they suggest a small reduction in the mass ratio characterizing this phenomena, with respect to the standard value for , .18
Experimental details have been reported elsewhere.1 ; 12 ; 13 Here, for GHz, the samples were photo-excited with a digital-frequency-readout microwave generator, with a 1 ppm uncertainty in in the CW mode.19 At higher frequencies, mechanical -meters with an uncertainty of 0.4 above 100 GHz were used in conjunction with calibration tables to determine .20 Thus, is thought to be better characterized below 50 GHz. ESR of DPPH was performed in the immediate vicinity of the 2DES at GHz using a second digital-frequency-readout microwave source.21 The g-factor for the unpaired electron undergoing ESR on DPPH is 2.0036, which corresponds to 28.043 GHz/T.22
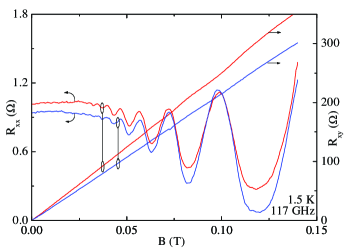
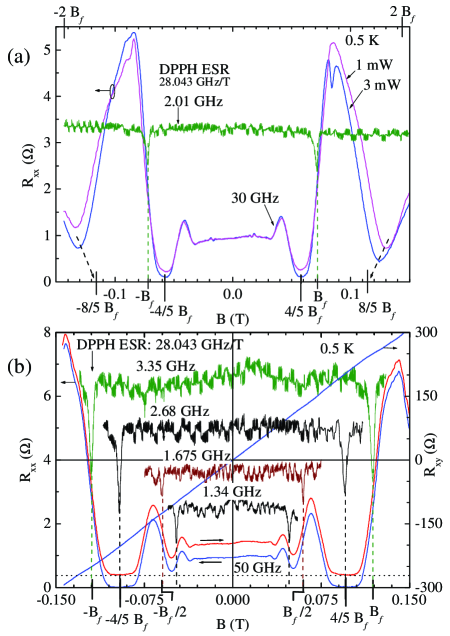
Fig. 1(a) shows the magnetoresistance measured in a GaAs/AlGaAs device with microwave excitation at 30 GHz. Also shown is the ESR of DPPH at 2.01 GHz, which marks for = 30 GHz and = 0.067. The data of Fig. 1 (a) indicate that the ESR field marker coincides neither with a minimum nor with a maximum in the signal.1 Fig. 1(a) also indicates a strong resistance minimum below , about , which is the member of . These data at 30 GHz also exhibit a deep minimum between and , which is identified here as the possible principal minimum for a two-photon process with a fundamental field , expected to form about . The data suggest a convergence to , as the minimum becomes deeper with increasing microwave power.
Fig. 1(b) shows under photoexcitation at 50 GHz. This panel includes DPPH-ESR field markers which identify , , and , for = 50 GHz. These data show that, at , there is once again neither a maximum nor a minimum in the , as in Fig. 1(a). In addition, a zero-resistance state forms about the field marker, and there is neither a maximum nor a minimum in near the marker.1 Thus, the data of Fig. 1 indicate that the maxima do not coincide with .1 ; 2 ; 14 ; 16 They also confirm the absence of intrinsic sweep-direction dependent hysteretic effects.
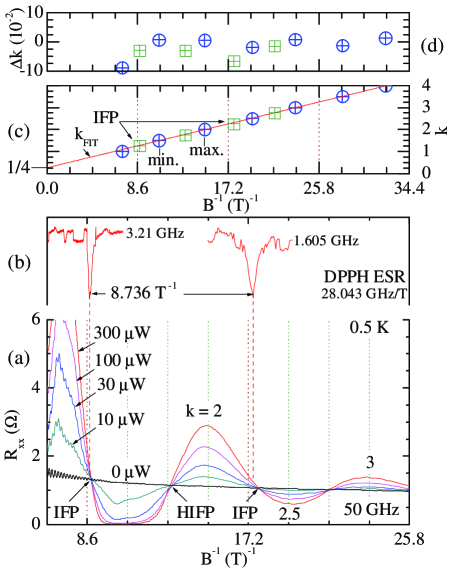
Fig. 2(a) exhibits vs. at 50 GHz for several radiation intensities. This plot shows regular-in- oscillations with a number of ”fixed points” where is independent of the microwave power. According to the theory,8 the conductance under radiation should equal the dark conductance at . We denote these as Integral Fixed Points (IFP). Experiment also indicates Half-Integral Fixed Points (HIFP) in the vicinity of .12 The -measurement of IFP’s by ESR of DPPH is shown in Fig. 2(b). Here, the ESR of DPPH at = 3.21 GHz marks the first IFP in the data of Fig. 2(a). Fig. 2 (a) and (b) indicate that, when is selected to mark the first IFP, /2 marks a that is slightly below the second IFP, suggesting a small correction. This correction is attributed here to the observed asymmetry between the resistance increase- and the resistance decrease- with respect to the dark value. That is, as the increase under excitation can easily exceed, in magnitude, the decrease, peaks tend to span a wider interval than the valleys. This tends to relocate the IFP to a slightly higher value, than where the condition actually holds true.
Another method for determining the period and the phase of the oscillations involves the application of a half-cycle plot, shown in Fig 2(c). Typically, the procedure assumes a cosine waveform. Thus, the maxima and minima are labelled by integers and half-integers, respectively. These labels, denoted here by the index , are plotted vs. extremal values of , as in Fig. 2(c). A linear fit, , then serves to determine the slope, = , and the ordinate intercept. Here, in Fig. 2(c), the ordinate intercept at 1/4 demonstrates a 1/4 cycle phase shift of with respect to the assumed (cosine) waveform.13 The residual difference, , between and for the extrema and fixed points, has been shown in Fig. 2(d). Fig. 2(d) confirms a small phase distortion, discussed above, at the lowest fixed points. It also confirms that the = 1 maximum, which tends to be upshifted from = 3/4, is a special case,12 see also Fig. 3(a).
There are two parameters in the half-cycle analysis: the intercept and the slope. Yet, the root-parameter in the slope is since , and can be measured. The question then arises whether the measured agrees with expectations.
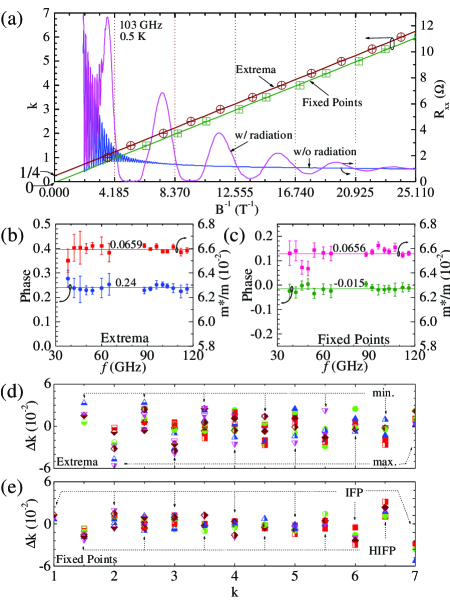
In order to obtain a representative sampling of the phase and , we have carried out a half-cycle analysis of a data set obtained over a range . For this work, both the extrema and the fixed points were subjected to a separate half-cycle analysis at each frequency, as illustrated in Fig. 3(a) for = 103 GHz. Since the analysis of the extrema has been discussed above, we note only that an analogous half-cycle analysis of the fixed points involves associating IFP’s with integers and HIFP with half-integers, and plotting the resulting index vs. .
A linear least squares fit served to determine the slope and the ordinate intercept of the vs. plots, as in Fig. 3(a). The characteristic field, , and were extracted using = , and = , where m is the electron mass. The resulting phase and have been shown in Fig. 3(b) and Fig. 3(c). Fig. 3(b) shows that the average phase for the extrema is 0.24 ( 0.015), which is 1/4 within uncertainty. On the other hand, Fig. 3(c) shows that the average phase for the fixed points is -0.015 ( 0.012), which is approximately zero. Thus, the phase related results are broadly consistent with resistance minima at , resistance maxima at , IFP’s at = , and HIFP’s at = , for j = 1,2,3…12 The residual difference, = , for the extrema and fixed points have been shown in Fig. 3(d) and Fig 3(e), respectively. Here, the scatter spans a smaller band in Fig. 3(e) than in Fig. 3(d). Doublet formation on the maximum at large or low , akin to ”spin splitting,” has been found to introduce scatter in Fig. 3(d).
So far as the mass ratios are concerned, Fig. 3(b) suggests = 0.0659 ( 0.0004), and Fig. 3(c) indicates that = 0.0656 ( 0.0006). These mass ratios are roughly 2 below the standard value, = 0.067,18 and 1 below our previously reported result, = 0.0663.1 Here, the difference between the average mass of Fig. 3 (b) and (c), and the standard value, appears to exceed the resolution limit of this experiment.
Mass corrections can originate from, for example, the polaron effect,23 where an electron polarizes the lattice and creates phonons, and the dressing of the electron by the phonon cloud leads to a mass change, usually a mass increase. An observed mass reduction could be related to some such renormalization effect, if the associated effect is somehow switched off in this context, so that the measurement comes to reflect a bare mass, which then looks like a mass reduction. A theoretical study appears necessary to examine such a possibility. Band non-parabolicity can lead to a dependence of on the electron density, , or the Fermi energy. Fig. 4 shows, however, that the oscillation period remains unchanged as is varied by 15 using the persistent photo-effect.
In summary, we have demonstrated a -independent 1/4 cycle phase shift of the extrema in the radiation induced oscillatory-magnetoresistance with respect to the or condition for 1.4 ; 6 ; 8 We also find that is 1 smaller than previously reported,1 and about 2 smaller than the standard value.18
References
- (1) R. G. Mani, J. H. Smet, K. von Klitzing, V. Narayanamurti, W. B. Johnson, and V. Umansky, Nature (London) 420, 646 (2002).
- (2) M. A. Zudov, R. R. Du, L. N. Pfeiffer and K. W. West, Phys. Rev. Lett. 90, 046807 (2003).
- (3) R. Fitzgerald, Phys. Today 56 (4), 24 (2003).
- (4) V. I. Ryzhii, Fiz. Tverd. Tela (Leningrad) 11, 2577 (1969) [Sov. Phys. - Sol. St. 11, 2078-2080 (1970)].
- (5) J. C. Phillips, Sol. St. Comm. 127, 233 (2003).
- (6) A. C. Durst, S. Sachdev, N. Read, and S. M. Girvin, Phys. Rev. Lett. 91, 086803 (2003).
- (7) A. V. Andreev, I. L. Aleiner, and A. J. Millis, Phys. Rev. Lett. 91, 056803 (2003).
- (8) J. Shi and X. C. Xie, Phys. Rev. Lett. 91, 086801 (2003).
- (9) P. W. Anderson and W. F. Brinkman, cond-mat/0302129; K. N. Shrivastava, cond-mat/0302320; S. Mikhailov, cond-mat/0303130; P. H. Rivera and P. A. Schulz, cond-mat/0305019; R. Klesse and F. Merz, cond-mat/0305492; F. S. Bergeret, B. Huckestein, and A. F. Volkov, Phys. Rev. B 67, 241303 (2003); A. A. Koulakov and M. E. Raikh, Phys. Rev. B 68, 115324 (2003); V. Ryzhii and R. Suris, J. Phys. Condens. Mat. 15, 6855 (2003); X. L. Lei and S. Y. Liu, Phys. Rev. Lett. 91, 226805 (2003); I. A. Dmitriev, A. D. Mirlin, and D. G. Polyakov, Phys. Rev. Lett. 91, 226802 (2003); V. Ryzhii and A. Satou, J. Phys. Soc. Jpn. 72, 2718 (2003).
- (10) R. E. Prange and S. M. Girvin, (eds) The Quantum Hall Effect, 2nd Ed., Springer-Verlag (New York, 1990).
- (11) D. C. Tsui, H. Stormer, and A. C. Gossard, Phys. Rev. B 25, 1405 (1982).
- (12) R. G. Mani et al., cond-mat/0306388.
- (13) R. G. Mani et al., cond-mat/0303034; cond-mat/0305507; cond-mat/0311010; cond-mat/0310474. R. G. Mani, Physica E (in press).
- (14) M. A. Zudov, R. R. Du, J. A. Simmons, and J. L. Reno, Phys. Rev. B 64, 201311 (2001).
- (15) Minima about would also constitute a 1/4 cycle phase shift, although in the other direction.
- (16) M. A. Zudov, cond-mat/0306508.
- (17) R. G. Mani and K. von Klitzing, Appl. Phys. Lett. 64, 3121 (1994); Appl. Phys. Lett. 64, 1262 (1994); Z. Phys. B 92, 335 (1993). R. G. Mani, J. Phys. Soc. Jpn. 65, 1751 (1996); Phys. Rev. B 55, 15838 (1997).
- (18) S. M. Sze, Physics of Semicond. Devices, 2nd Edn. (Wiley, New York, 1981) p. 850; G. E. Stillman, C. M. Wolfe, and J. O. Dimmock, Sol. St. Comm. 7, 921 (1969).
- (19) 83650B Synthesized Swept-Signal Generator: Agilent Technologies, Palo Alto, CA 94303. www.agilent.com
- (20) Series 072 Frequency Meter: Flann Microwave Inc., Bodwin, Cornwall PL31 2QL, UK. www.flann.com
- (21) HP83711A Synthesized CW Generator: Agilent Technologies, Palo Alto, CA 94303. www.agilent.com
- (22) R. E. Gerkin et al., J. Chem. Phys. 66, 4166 (1997); F. J. Teran et al., cond-mat/0306634.
- (23) D. M. Larsen, Phys. Rev. 135, A419 (1964).