Resonant Inelastic X-Ray Scattering at the K Edge of Ge
Abstract
We study the resonant inelastic x-ray scattering (RIXS) at the edge of Ge. We measure RIXS spectra with systematically varying momenta in the final state. The spectra are a measure of exciting an electron-hole pair. We find a single-peak structure (except the elastic peak) as a function of photon energy, which is nearly independent of final-state momenta. We analyze the experimental data by means of the band structure calculation. The calculation reproduces well the experimental shape, clarifying the implication of the spectral shape.
1 Introduction
Inelastic x-ray scattering is a promising method to study electronic structures in matters. Since intensities are much smaller than those on the elastic part, high-brilliance synchrotron sources are necessary. It is advantageous to use a resonant enhancement by tuning photon energy near absorption edge. This resonant inelastic x-ray scattering (RIXS) is described by a second-order optical process, in which a core electron is excited by an incident photon and then this excited state decays by emitting a photon to fill the core hole. Thereby electron-hole pairs remain in the final state. We can cover the momentum of the final state over the wide range by using the K edge of transition metals. Such RIXS experiments have recently been carried out on cuprates[1, 2] and manganites[3], having revealed characteristics of charge excitations through the momentum dependence of spectra.
On semiconductors and insulators such as silicon[4], graphite[5], boron nitride[6], and others[7], RIXS experiments have already been performed, where corresponding photon energies are in the soft x-ray region. The spectra are a measure of exciting an electron-hole pair. Band structure calculations have reproduced well the spectral shape due to small electron correlations. In this paper, we carry out a RIXS experiment using the K edge in Ge. Since corresponding photon energies are in the hard x-ray region, we expect that a new insight would come out through the momentum dependence of the spectra. A similar experiment has already been reported[8]. The present experiment is much thorougher with systematically varying momenta in the wide range. Against our expectation, the experimental spectra as a function of photon energy show a broad single peak (except the elastic peak), and keep almost the same shape with varying momenta.
We analyze the experimental data by calculating the spectra within the local density approximation (LDA). We disregard the core-hole potential in the intermediate state, expecting that this neglect would cause only a minor error[9]. This is partly justified from our calculation of the absorption coefficient, which agrees near the edge with the experimental one, as shown below. The final state consists of one electron in the conduction band and one hole in the valence band. If the core-hole level in the intermediate state is sharp enough, we can select the momentum of the excited electron in the conduction band by sharply tuning the incident-photon energy, because the denominator in the formula of the second order process (eq. (1)) selects a particular process through enhancement. Then, selecting the final-state momentum by setting the scattering geometry, we can specify the momentum of the hole in the valence band. In this situation, one expects sharp peaks at the energy of the electron-hole pair, as a function of photon energy. On the other hand, if the core-hole level is broad, many channels are opened to excite an electron with different momenta in the conduction band. We need to sum up each contribution. We calculate the RIXS spectra with varying values of the core-level width. This leads to an examination of determining the band structure from RIXS spectra[10]. The core level of Ge is rather broad with width of about 2 eV. Summing up each contribution of band-to-band transitions, we obtain the spectra in good agreement with the experiment. Thus the analysis based on the band structure calculation demonstrates the origin of the spectra.
2 Experimental Measurements
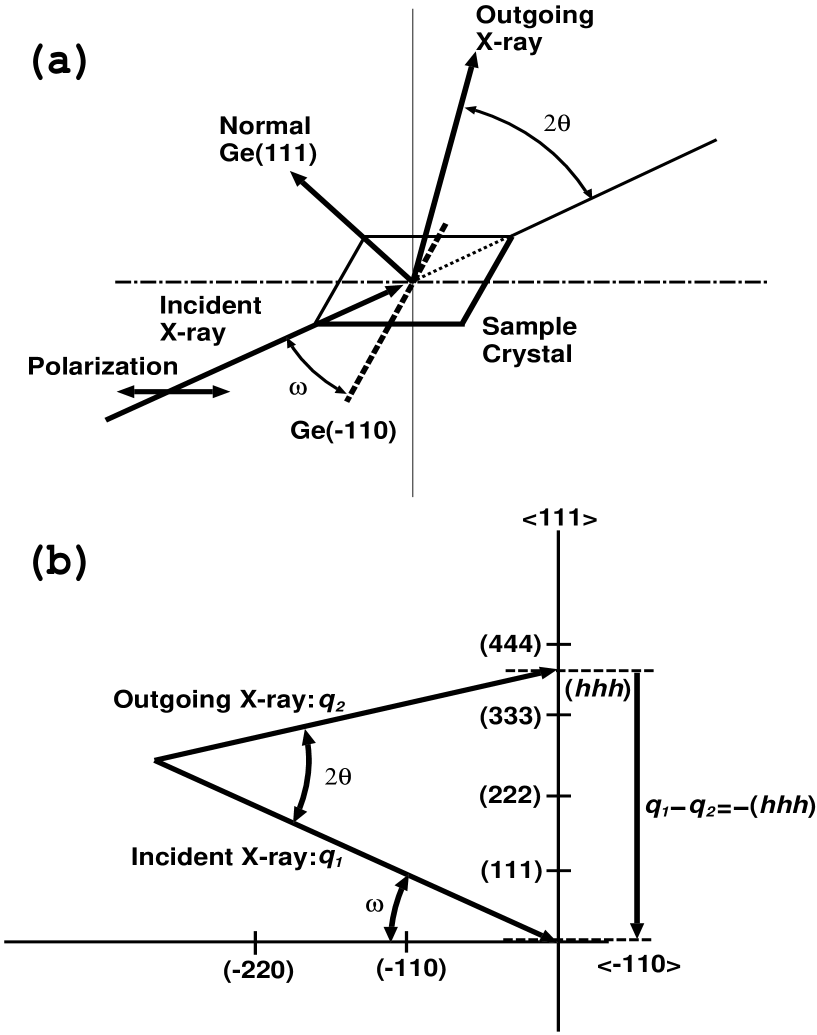
The experimental set up is shown in Fig. 1 (a). The geometrical arrangement () is determined as shown in Fig. 1(b), for the momentum transfer from the incident X-ray with momentum to the outgoing X-ray with momentum . Experiment was performed at the bending magnet beam-line (7C) of the Photon Factory, Institute of Materials Structure Science. This beamline consists of a Si (111) double-crystal monochromator with the sagittal focusing mechanism and a focusing double mirror, and provides linear polarized x-rays. The incident beam size at the sample position was about 1.5 mm in horizontal and 1 mm in vertical; the photon flux was estimated to be 1011 photons/s. The dimension of the Ge single crystal was 10 mm 10 mm 5 mm. Emitted x-rays were analyzed by means of a cylindrically-bent InSb(880) crystal and measured by a position sensitive proportional counter. The total energy resolution of the emission spectrum in the present apparatus was 3.0 eV. More details of the spectrometer has already been described in ref. References.
3 Formulation
3.1 Double Differential Scattering Cross-Section
RIXS is described by a second-order process. Using the generalized Fermi’s golden rule where the interaction between light and electrons is treated by second order perturbation theory, we obtain the double differential scattering cross-section.
| (1) |
Here , and , and denote the polarization vector, the energy and the momentum vector of the incident () and emitted () photon, respectively, and denote the position and momentum of electron . Kets , and represent initial, intermediate and finale states of the material system, respectively, with their energies , , and . The is the life time of the intermediate state .
For germanium, an independent particle treatment for electron system seems to be appropriate, since electron correlations are weak [10]. For usual situations, the initial state is assumed to be the ground state . The incident photon with momentum excites an electron from the core state with crystal momentum to the conduction band (whose band index is ) with crystal momentum . Neglecting the core-hole potential in the intermediate state, we express the intermediate state by , where is the creation(annihilation) operator for the electron of state. Then, the intermediate state decays with emitting photon with momentum and annihilating an electron in the valence band (whose band index is ) with crystal momentum to fill the core hole. Therefore, we have the final state . Since the final state uniquely determines the intermediate state, eq. (1) is rewritten as
| (2) |
where , and are energy and momentum of the final state. , and are the energy of the excited electron with crystal momentum in the conduction band, that of the hole with crystal momentum in the valence band, and that of the core state, respectively. The crystal momentum conservation for the whole process is contained in the factor of Kronecker ,
| (3) |
where is the set of reciprocal lattice vectors. Overlined quantities indicate their complex conjugates. Within the dipole approximation, , where , and are the position vector of atom in unit cell, Bloch-wave function of a electron in the -band with crystal momentum , and 1-atomic orbital, respectively. These quantities are evaluated on the basis of the band structure calculation described in the following sub-section.
3.2 Band Structure Calculation of Ge
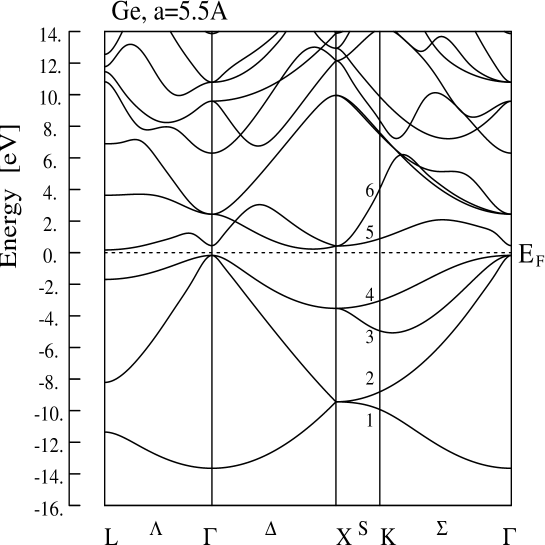
We perform a band structure calculation using the full-potential linearized augmented-plane-wave (FLAPW) method [12] within the LDA. The local exchange-correlation functional of Vosko, Wilk and Nusair is employed [13]. The angular momentum in the spherical-wave expansion is truncated at and for the potential and wave function, respectively. The energy cutoff of the plane wave is 12 Ry for the wave function. It is well known that the density-functional theory underestimates bandgaps. For Ge, the density-fuctional calculation fails to obtain a finite bandgap: the valence-band top and the conduction-band bottom overlap in energy at the point, leading to a negative value of bandgap. Experiments suggests a finite bandgap, 0.744 eV. Many-body theories based on the Green function such as the calculation may be necessary to reproduce a collect size of the band gap. For the present purpose, however, it is sufficient to employ a simple remedy for the problem: carrying out a calculation on a system of a smaller lattice constant. The bandgap becomes larger for smaller lattice constants, since the splitting between bonding and antibonding bands becomes larger. We obtain a bandgap of 0.35 eV between the and points for the lattice constant ( in the real system). Figure 2 shows the energy vs. momentum relation thus evaluated. The energy band is labeled by attached numbers for later use. Note that a slight change of the lattice constant has little influence on the dispersion relation except the band gap.
4 Comparison of experimental results and theoretical calculations
We present the experimental data in comparison with the calculated spectra. The calculation is made by following the procedure mentioned above with assuming eV (for all ) and eV (measured from Fermi level).
4.1 Absorption coefficient at the K edge
Before going to the RIXS spectra, we first calculate the absorption coefficient at the K edge. Figure 3 shows the calculated result in comparison with experimental results by Kokubun et al. [14, 15]. The experiment shows no sign of core exciton. The calculated curve is in agreement with the experimental one in the energy region between 11,100 eV and 11,110 eV, indicating that the effect of core hole potential seems unimportant in the energy region of our interest. The calculation predicts extra peaks at about 11,115 eV and 11,125 eV, deviating from the experimental curve. This fault come from a linearizing procedure in the FLAPW method, which becomes less accurate for high energy states.
4.2 RIXS spectra
Figure 4 shows experimental RIXS spectra with varying incident photon energy between 11,099 eV and 11,141 eV. The final-state momenta are set to be and . There are two peaks. One is an elastic peak, which is larger for the final-state momentum close to a reciprocal lattice vector. Another is an inelastic peak. Both get closer for the incident photon energy getting close to the threshold. Since the tail of elastic contribution masks the inelastic contribution, we have to subtract the former from experimental data in order to extract the latter contribution. Assuming that the elastic contribution dominates the intensity in the region of , we evaluate the elastic contribution for by the value at . This may be a slight overestimate of the elastic contribution in the region of . Figure 5 shows the inelastic contribution evaluated this way in comparison with the calculation. The calculated intensity is normalized such that the peak height coincides with the experimental one at eV. We find a single broad peak, whose intensity increases with increasing incident photon energies. The calculation reproduces well such experimental behavior. This behavior of the peak intensity corresponds to the behavior of absorption coefficient at the K edge in the energy region between 11,100 eV and 11,107 eV where absorption coefficient increases with increasing incident photon energies (See Figure 3).
Figure 6 shows RIXS spectra as a function of the Raman shift () for eV. The final-state momenta vary from to . The elastic contribution is subtracted in the same way as above. The calculated results are in good agreement with the experimental ones. The spectra are nearly independent of final-state momenta. The reason will be discussed in the following subsection.
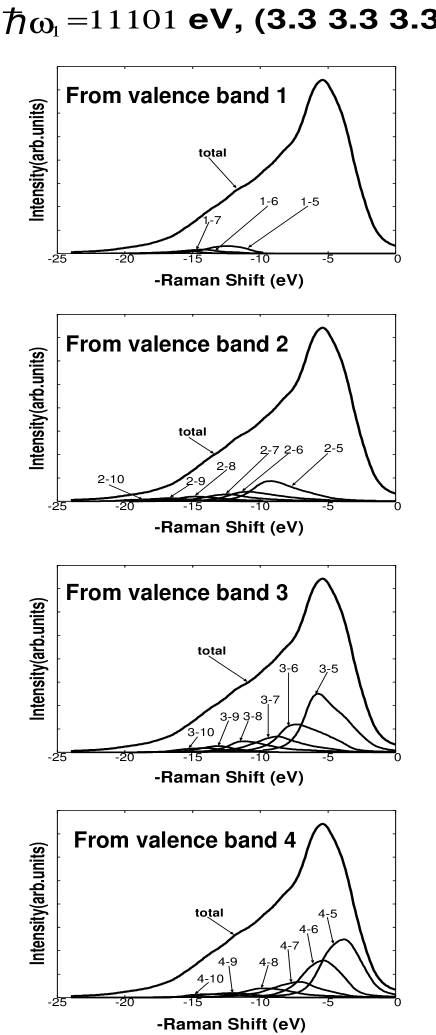
The spectra are decomposed into each contribution of band-to-band transitions specified by band indices. Figure 7 shows the result for , eV. We notice that the peak is mainly composed of transitions from the bands 3 and 4 to the band 5.
4.3 Reconsideration of the idea of band-structure determination from RIXS spectra
We examine more closely eq. (2) to clarify the origin of the spectral shape. This leads to the idea of band-structure determination from RIXS spectra proposed by Ma [10].
We start by defining a function (here we neglect -dependence of and write ),
| (4) |
Since the core hole can carry momentum, the excited electron can take any value of momentum according to . Here, we consider the following limit case opposite to the real situation in Ge. If the value of is much smaller than the band-with of a branch in the conduction band, the denominator in eq. (4) can become very small for a certain value of . In the case of band structure of Ge, the L point is selected when the incident photon energy is tuned at the absorption edge. Thus eq. (4) is approximated by
| (5) |
Substitution of this relation into eq. (2) leads to
| (6) |
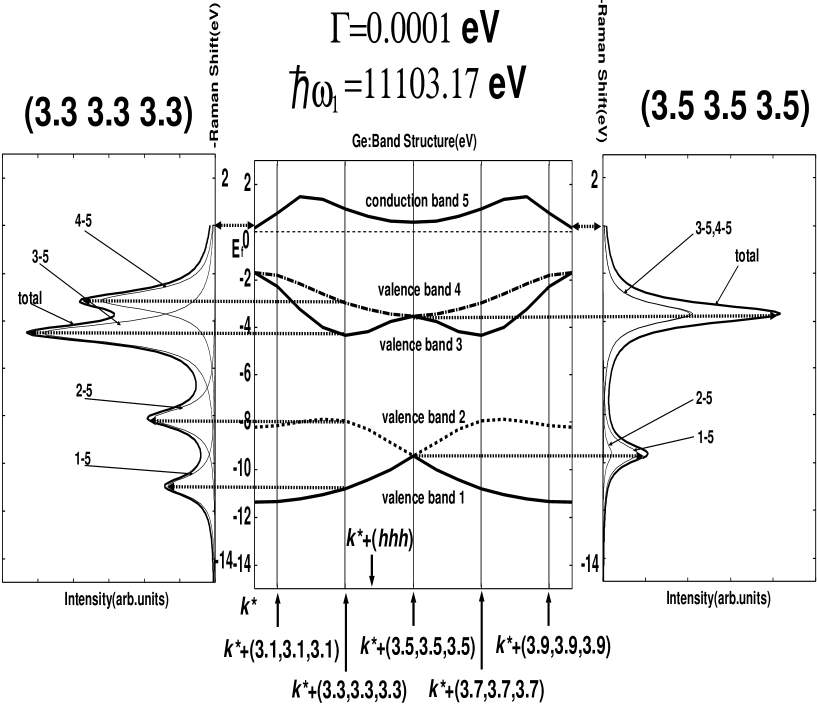
The spectra consist of several -functions as a function of , whose positions move with varying values of . Figure 8 illustrates how the band is determined when the incident photon energy is tuned at the absorption edge ( is at L-point). Thereby we can trace the valence band structure from the peak position by means of scanning .
Next we consider the following limit case opposite to discussion mentioned above. For germanium, the value of at the K-edge is estimated about 2 eV. This value is nearly equal to the band-with of the lowest conduction band of Ge. In such a situation, one may safely put the -dependence on , that is, put
| (7) |
This relation leads to an approximate expression to the differential cross-section,
| (8) |
with
| (9) |
where is the average of over in the Brilloin zone. Since selects symmetric states within the dipole approximation, is analogous to the density of states (DOS) projected onto -symmetric states. The spectra are given by a superposition of the -DOS, and this naturally explains why the spectra are nearly independent of final-state momenta.
5 Concluding Remarks
We have carried out a RIXS experiment at the edge of Ge with systematically varying final-state momenta. We have obtained a broad inelastic peak as a function of photon energy, whose shape is nearly independent of final-state momenta. We have analyzed the experimental data on the basis of the band structure calculation, summing up each contribution of band-to-band transitions. The band calculation has reproduced well the experimental data, demonstrating the origin of the spectra.
We have examined a possibility of determining band structure from RIXS experiment. For smaller values of core-level widths, we can trace the energy dispersion with varying final-state momenta. To obtain sizable momentum change, however, photon energy is required to be larger than 2-3 keV. But, since corresponding core-level widths are usually large, the spectra are likely to be independent of final state momenta, thus making it difficult to determine the band structure.
Acknowledgments
Some of the author (Y.N, M.U and J.I) greatly thank to Prof. N. Hamada for allowing us to use his FLAPW code.
References
- [1] M. Z. Hasan, E. D. Isaacs, Z.-X. Shen, L. L. Miller, K. Tsutsui, T. Tohyama, and S. Maekawa, Science 288 (2000) 1811.
- [2] Y. J. Kim, J. P. Hill, C. A. Burns, S. Wakimoto, R. J. Birgeneau, D. Casa, T. Gog, and C. T. Venkataraman, Phys. Rev. Lett. 89 (2002), 177003.
- [3] T. Inami, T. Fukuda, J. Mizuki, S. Ishihara, H. Kondo, H. Nakao, T. Matsumura, K. Hirota, Y. Murakami, S. Maekawa, and Y. Endoh, Phys. Rev. B 67 (2003) 045108.
- [4] Y. Ma, K. E. Miyano, P. L. Cowan, Y. Aglitzkiy, and B. A. Karlin, Phys. Rev. Lett. 74 (1995) 478.
- [5] J. A. Carlisle, E. L. Shirley, E. A. Hudson, L. J. Terminello, T. A. Calcott, J. J. Jia, D. L. Ederer, R. C. C. Perera, and F. Himpsel, Phys. Rev. Lett. 74 (1995) 1234.
- [6] J. J. Jia, T. A. Callcott, E. L. Shirley, J. A. Carlisle, L. J. Terminello, A. Asfaw, D. L. Ederer, F. J. Himpsel, and R. C. C. Perera, Phys. Rev. Lett. 76 (1996) 4054.
- [7] A. Kotani and S. Shin, Rev. Mod. Phys. 73 (2001) 203.
- [8] A. Kaprolat and W. Schülke, Applied Phys. A 65 (1997) 169.
- [9] At the edge of graphite, a core exciton is observed. The effect on the RIXS spectra is studied by Carlisle et al.(Ref. References) and by M. van Veenendaal and P. Carra, Phys. Rev. Lett. 78 (1997) 2839.
- [10] Y. Ma, Phys. Rev. B 49 (1993) 5799
- [11] T, Iwazumi, K. Kobayashi, S. Kishimoto, T. Nakamura, S. Nanao, D. Ohsawa, R. Katano and I. Isozumi: Phys. Rev. B 56 (1997) 14267.
- [12] H. J. F. Jansen and A. J. Freeman, Phys. Rev. B 30 (1984) 561.
- [13] S. H. Vosko, L. Wilk and M. Nusair, Can. J. Phys. 58 (1980) 1200.
- [14] J. Kokubun: private communication.
- [15] J. Kokubun, M. Kanazawa, K. Ishida, and V. E. Dmitrienko: Phys. Rev. B 64 (2001) 073203.