Abstract
Using differential magneto-optical imaging, we address the question of mesoscopic inhomogeneity in underdoped Bi2Sr2CaCu2O8 (Bi-2212) single crystals. Among other features, it is shown that an anomalous temperature dependence of the penetration field and of the first order transition (FOT) field of the vortex lattice in such crystals can be understood as arising from inhomogeneity. The effect of chemical inhomogeneity and pinning on flux penetration and the FOT is discussed.
keywords:
Superconductivity, Vortex Lattice, First Order Transition, Inhomogeneity, Disorder[Disorder in Underdoped Bi-2212 Superconductor]First Order Transition of the Vortex Lattice in Disordered BI-2212 Crystals
1 Introduction
It is commonly assumed that the vortex lattice undergoes a first order transition (FOT) to the so-called vortex-liquid state in very clean, defect free superconducting single crystals only [1, 2, 3]. In disordered crystals, the transition to a vortex liquid is presumed to be second order, although, at present, only very few reports substantiate this [4, 5]. In the high temperature superconductors, the FOT is observed irrespectively of the oxygen content of the material [6] .
The FOT in oxygen-underdoped Bi2Sr2CaCu2O8 (Bi-2212) deserves special attention. Single crystals of this material cannot be obtained by annealing optimally doped material, and only recently has a technique been developped to grow them [7]. Even then, underdoped Bi-2212 crystals present nanometer-scale inhomogeneity of the superconducting gap [8, 9], as well as chemical inhomogeneity on larger scales [11].
Here, we present Hall-probe array magnetometry and differential mag-neto-optical (DMO) [13] imaging experiments on strongly underdoped Bi-2212 single crystals. The local induction measured by both techniques shows a well-resolved discontinuity at the same FOT field, . DMO allows us to map the spatial variation of within a crystal, and to obtain its temperature dependence in different locations. It is argued that the spatial variation of is responsible for magnetization anomalies near the critical temperature, .
2 Experimental Details
Sample growth
Two crystalline boules of underdoped Bi2Sr2CaCu2O8 were grown using the travelling-solvent floating zone method, under 25 mbar oxygen partial pressure. They were subsequently annealed at 700∘C in flowing N2 gas for a period of one week [7]. Crystals were separated from the boule with a razor blade. A polarized light microscope was used to select specimens without obvious growth defects such as low-angle grain boundaries or colony boundaries.
Direct Magneto-optical imaging (MOI)
The crystals were further selected using “direct” magneto-optical imaging (MOI). A crystal is covered with a Lu-iron garnet thick film with in–plane magnetic anisotropy, covered by an Al mirror layer (Magistr inc., Russia), that serves as a magneto-optical indicator of the local induction [10]. After cooling down to the measurement temperature, a magnetic field is applied perpendicularly to the crystal surface and to the garnet indicator film. The local magnetic induction is measured by the Faraday rotation of linearly polarised light that twice crosses the indicator film (before and after reflection by the Al mirror). Bright regions in the images correspond to large Faraday rotation and thus a high magnetic induction, whereas dark areas correspond to small (or zero) Faraday rotation and to a small (or zero) local induction.
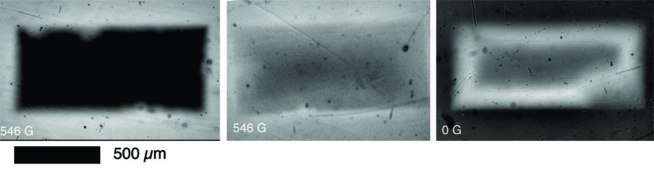
Guided by direct MOI, apparently defect-free pieces were cut from larger crystals using a wire saw. An example of flux penetration into crystal A, selected by direct MO imaging from the boule 1 material (nominal K), is shown in the top three panels of Figure 1(a). The crystal shows homogeneous, regular flux penetration, that is well described by the critical state model [12]. Judging from these images, this crystal would appear suitable for use in further physical measurements.
Differential magneto-optical imaging (DMO)
Crystals were further investigated using the DMO technique with field modulation, Oe. All measurements were conducted after zero-field cooling. A field was applied, and ten MO images of the flux distribution above the sample were acquired and summed. The applied field was then reduced to , whence ten other images were acquired and successively subtracted from the first sum. This procedure was repeated twenty times; the resulting twenty differential images were averaged to produce the final DMO images. These images should be interpreted as representing a map of the local “permeability” of the sample. The grey level outside the sample boundaries represent a “permeability” . A zero intensity (black) represents diamagnetic screening, i.e. , while intermediate grey levels represent partial screening of the field modulation. Clear regions indicate a paramagnetic response. This is of particular interest near the vortex lattice FOT: the discontinuity in the local induction at the transition [3] results in a change that is larger than by an amount , and thus in a paramagnetic signal [13]. DMO images of the FOT process at 61 K in crystal A are shown in the bottom panels of Fig. 1. The FOT first takes place on the line defects oriented at with respect to the long crystal side [14], located near the crystal edge, and progressively moves inwards to the crystal center. Regions of the crystal that have not yet undergone the FOT fully screen the field modulation.
(a)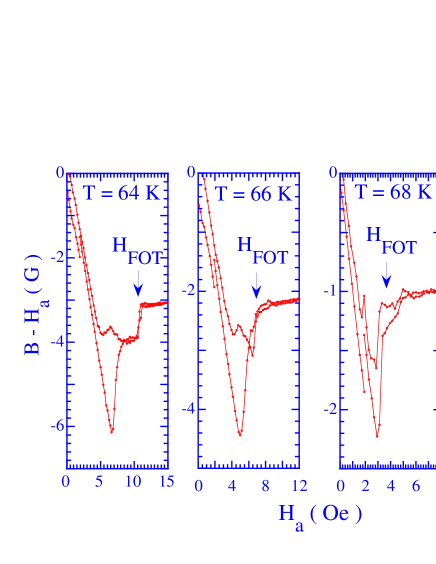 (b)
(b)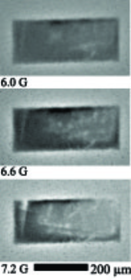
Local Hall probe magnetometry
Flux distributions over a number of crystals selected by direct MOI were measured using Hall probe magnetometry. A crystal is placed on an array of 11 Hall probes, of dimensions m2, located 10 m apart [3], with the array parallel to the shorter crystal edge, and traversing the crystal center. The local induction at each sensor is measured as the applied field is cycled, at constant temperature, from zero to a maximum field, and back to zero. Typical loops of the local “magnetisation”, , measured at a probe near the center of crystal B (originating from boule 2 with nominal K) are shown in Fig. 2(a).

3 Phase diagram and FOT process
From the cusp in the loops of local induction (Fig. 2), the field of flux penetration to the Hall probe position is identified, e.g. K) = 6.9 Oe. The step in signals the field at which the FOT occurs, e.g. K) = 11 Oe. DMO imaging on crystal B at K shows that the FOT process starts independently, at Oe, in different spots scattered throughout the crystal. Such inhomogeneity is found both with the Hall array and with DMO. For example, at Oe the central area of the crystal is already in the vortex liquid state, but the vortex lattice near the two line intergrowths [14] at the bottom transits to the liquid only here.
Figure 3 renders , , and , measured over crystal B, as function of temperature. All three decrease gradually as function of , up to K, at which starts to decrease more rapidly. Such a “collapse” of the penetration field was previously reported by Mrowka et al. [15], but they did not report on any features associated with the FOT. Note that in the temperature range of the “collapse”, 66 70 K, the step in signaling the FOT cannot be discriminated from the rapid increase of at [Fig. 2(a)]. Above 70 K, is reduced to less than 0.6 Oe and the FOT can no longer be observed at all, be it in Hall array measurements or in DMO. The inset of Fig. 3 shows that superconductivity in crystal B persists up to K: slowly decreases from G to 0.
(a) 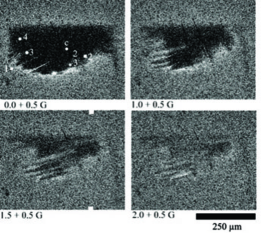 (b)
(b) 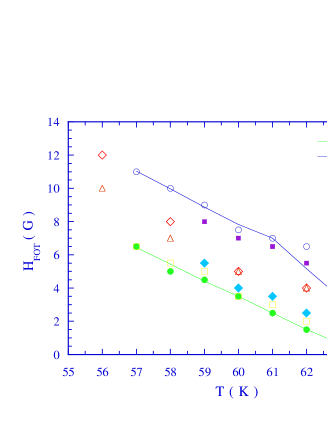
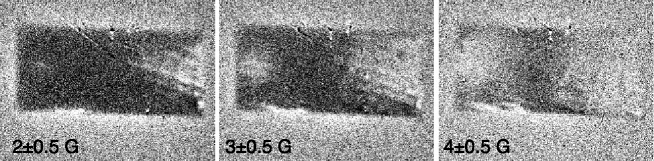
DMO images on crystals from both boules reveal that the topology of the FOT process is dominated by crystalline inhomogeneity on the scale of m. Figure 4 shows a series of four images of the FOT in crystal C (from boule 1), measured at K. The FOT in this and nearly all other investigated underdoped crystals starts at inhomogeneities near the crystal edge. Unlike observations made on optimally doped crystals [13], the FOT front always moves inwards from the edge towards the center. The distribution of local FOT fields has a temperature-independent width of typically 5 Oe [Fig. 4(b)], twice that observed in optimally doped crystals [16]. The temperature range of the “collapse” of and in the crystal center, 63 65 K, corresponds quite accurately to that over which attains .
4 Discussion and Conclusion
A (sudden) decrease of the “penetration field” must be due to the decrease of the surface or geometrical barrier limiting vortex entry into the sample [17, 18]. The condition for vortex entry is that the (Meissner) screening current at the sample edge be equal to a characteristic current (typically the depairing current). This condition can be met more easily (and the barrier suppressed) in two ways: an increase of the local Meissner current by modification of the sample geometry, or the suppression of the characteristic current, e.g. by (the vortex lattice transition at) local inhomogeneities [11]. The DMO observations suggest that the latter is at the origin of the “collapse” in single crystalline Bi-2212.
Once the barrier is overcome in the weakest spot of the crystal, the very same crystalline inhomogeneity takes on another role: the internal barriers associated with local compositional variations constitute a mesoscopic pinning potential impeding vortex motion [19]. The phase transformation front thus moves in from the edge towards the center.
To model the motion of the FOT front, we assume that the vortex
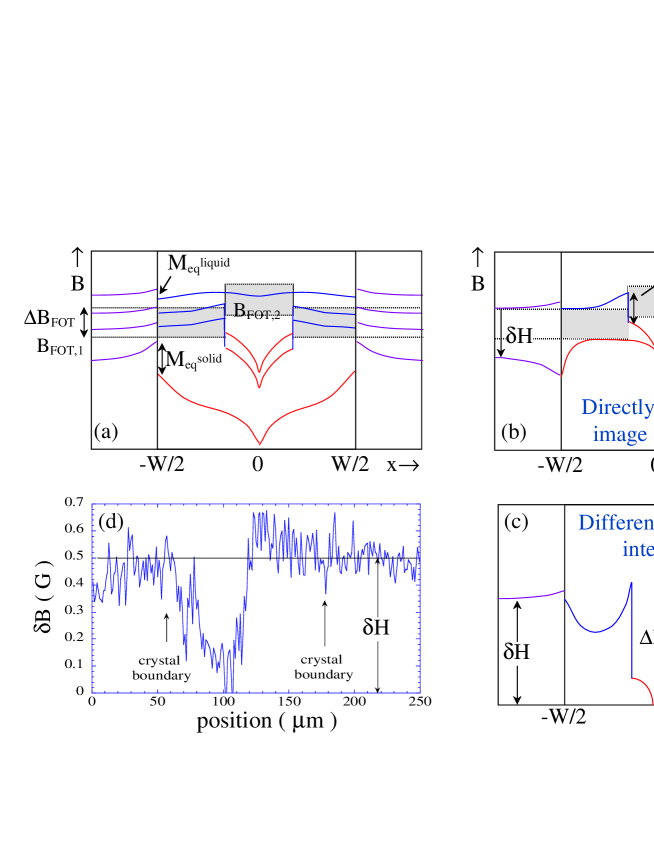
solid phase has a non-zero critical current, while the (high field) vortex liquid has negligible critical current. Then, the flux distribution in a model inhomogeneous sample containing a peripheral (1) and a central (2) region with FOT fields respectively, should be as in Fig. 5(a). At low field, one has the usual flux distribution due to the critical state [12]. As is passed, vortex liquid regions enter the crystal from the edge. As long as the local induction does not exceed , this implies the presence of a phase mixture adjacent to the FOT transformation front. Within homogeneously disordered regions (e.g. 1 and 2), in which the length scale characterising the defect structure is much smaller than the vortex spacing, the front motion is limited only by the dynamics of the liquid state and of the phase transformation itself. If the vortex liquid has negligible critical current, the front can move through the crystal until it meets a region of higher local , eliminating local screening currents due to pinning in the process (a vortex solid-liquid intermediate state may be left behind the FOT front). If, as in a DMO experiment, the applied field is lowered by , the FOT front recedes to the regions with lower local , but non-equilibrium screening currents associated with this retreat may be insufficient to change the local induction in the resolidified region [Fig. 5(b)]. A differential image [Fig. 5(c)] reveals the extremal position of the FOT front as paramagnetic only because of the demagnetizing field around regions with high local . These screen the modulation , and therefore show up as black, as in Figs. 1 and 4. If much exceeds , e.g. near [3], the discontinuity in local B is masked by the induced screening current in the regions with higher ; features associated with the FOT can then no longer be observed (see e.g. the curve at 70 K in Fig.2).
Summarizing, the First Order Transition of the vortex lattice was observed in underdoped Bi2Ca2CaCu2O8. The specific features related to the FOT in this material can be well understood as arising from mesocopic inhomogeneity. Our results constitute new proof of the robustness of the FOT to substantial amounts of crystalline disorder [20].
99
References
- [1] Safar H. et al., Phys. Rev. Lett. 69, 824 (1992).
- [2] Kwok W.K. et al., Phys. Rev. Lett. 69, 3370 (1992).
- [3] Zeldov E. et al., Nature 375, 373 (1995).
- [4] Klein T. et al., Phys. Rev. B 53, 9337 (1996).
- [5] Okuma S., Imamoto Y., and Morita M., Phys. Rev. Lett. 86, 3136-3139 (2001)
- [6] Sasagawa T. et al., Phys. Rev. Lett. 80, 4297-4300 (1998)
- [7] Ming Li et al., Phys. Rev. B 66, 024502 (2002).
- [8] Pan S.H. et al., Nature 413, 282 - 285 (2001).
- [9] Hoogenboom B.W. et al., Phys. Rev. Lett. 87, 267001 (2001)
- [10] Dorosinskiĭ L.A. et al., Physica C 203, 149 (1992).
- [11] Chikumoto N., this conference.
- [12] Brandt E.H., Phys. Rev. B 54, 4246-4264 (1996)
- [13] Soibel A. et al., Nature 406, 282 (2000).
- [14] Ming Li et al., Proc. of M2S-HTSC VIII (2003), to be published in Physica C.
- [15] Mrowka F. et al., Phys. Rev. B 60, 4370 (1999).
- [16] Soibel A. et al., Phys. Rev. Lett. 87, 167001 (2001).
- [17] Indenbom M.V., Physica (Amsterdam) C 235–240, 201 (1994).
- [18] Zeldov E. et al., Phys. Rev. Lett. 73, 1428 (1994).
- [19] Clem J.R., Huebener R.P., and Gallus D.E., J. Low Temp. Phys. 12, 449 (1973).
- [20] See also S.S. Banerjee et al., Phys. Rev. Lett. 90, 087004 (2003).