Vibrational properties of hexagonal LiBC: Infrared and Raman spectroscopy
Abstract
The paper presents infrared reflectivity and micro-Raman scattering spectra of LiBC powder pellets. The experiment allowed assignment of frequencies of all infrared and Raman active zone center modes: E1u(LO) at 1262 cm-1 and 381 cm-1, E2g at 1172 cm-1 and 174 cm-1 and A2u(LO) at 825 cm-1 and 545 cm-1. Results are compared with available ab-initio calculations; prediction of large Born effective charges on the nodes of B-C graphene sheets is confirmed.
pacs:
78.30.-j, 74.25.Kc, 63.20.-eLiBC is a layered boron carbide consisting of alternating graphene-like (BC)- sheets separated by intercalated Li+ ions. It normally crystallizes with a hexagonal structure of () space group symmetry with Li, B and C atoms in 2a, 2c and 2d Wyckoff positions, respectivelyWor95 . The structure is very close to that of the recently discovered unconventional superconductor MgB2nature1 . Electronic band structure of both materials is also quite similar, except for that LiBC is an insulator with completely filled 2p- graphene bands. Since the deformation potential due to the zone center bond stretching mode is in LiBC even higher than in MgB2Ros02 , it was predicted that the hole-doped LiBC could show superconductivity with of order of 80 K. Several groupsCava ; Souptel ; Zhao ; FoggPRB ; FoggChC ; Ren03 tried different methods to achieve superconductivity in Li deficient samples, but none of these attempts were successful. The reason of the failure (or failure of the prediction) has not yet been elucidated. In any case, comparative LiBC vs MgB2 studies are desirable for detailed understanding of the MgB2-type superconductivity.
Vibrational properties of LiBC were thoroughly studied by ab-initio methodsARSP ; ASRP ; Kwan ; Dew ; Ren03 , but due to the lack of large single crystals, the desirable experimental information is quite limited.Artem ; Ren03 ; Bha ; ourLiBC1 Group-theoretical analysis predicts ten zone-center optic lattice modes: a pair of Raman active modes (B-C bond stretching mode and B-C layers sliding mode); 2 (B-C bond stretching mode and B-C layer vs Li layer sliding mode) and (B-C layer puckering mode and B-C layer against Li layer beating mode) infrared active modes; and 2 optically silent modes. In this paper, we present results of a systematic room-temperature infrared and Raman spectroscopic study on polycrystalline LiBC pellets, which provides a complete spectrum of zone center optically active modes in LiBC ( 2 species.)
Let us briefly review the previous experimental investigations of phonons in LiBC by infrared, Raman and inelastic neutron scattering spectroscopy on microcrystals and powder samples. Inelastic neutron scattering has shown weighted phonon density of states extending up to about 1300 cm-1, with three pronounced bands in the range 350–450 cm-1, 700–850 cm-1 and 1000–1250 cm-1, corresponding to external, puckering and stretching modes of the graphene-like sheets, respectively (the lowest frequency band comprises also Li-ion vibrations.) A pair of Raman active modes was observedourLiBC1 ; Ren03 ; FoggPRB near 170 cm-1 and 1170 cm-1. These modes correspond to sliding of the graphene sheets and to the B-C bond stretching modes, respectively. In addition, another pair of sharp and strong Raman lines, presumably corresponding to modes, was seen in a metastable trigonal form of LiBCourLiBC1 . Two of four infrared active modes ( species) should contribute to the reflectivity of hexagonal faces. However, the infrared microscope experimentArtem on a micro-crystallite with a well-developed natural hexagonal face showed a more complicated spectrum, so that only the higher frequency (at 1180 cm-1) could be reliably assigned.Artem The other two infrared active modes, polarized along the hexagonal axis ( species), should contribute together with modes to the infrared response of powder samples. Unfortunately, the previously publishedBha reflectivity and transmission spectra on LiBC powder are far from the expected 4-mode spectral profile.
Samples used in this study were prepared at the University of Liverpool. Stoichiometric LiBC was synthetized in Ta ampoules at 1773 K under Ar atmosphere by the method described in Refs. Wor95, ; FoggPRB, . The golden polycrystalline powder, handled under inert atmosphere, was characterized by laboratory x-ray diffraction test proving a single LiBC phase with lattice parameters Å and Å. On a closer inspection, small systematic shoulders on the Bragg reflections were found, indicatingFoggChC a small amount of Li deficient phase with composition of about Li0.95BC ( Å, Å). The powder was then isostatically pressed to form 0.65 mm thick pellets with 8 mm diameter. Spectroscopic experiments were carried out in IOP ASCR in Praha within 20 hours after opening of the sealed glass ampoules containing the pellets.
The Raman experiments were carried out using a Renishaw Raman microscope with 514.5 nm (2.41 eV) argon laser excitation. The instrument allows both the direct microscope observation and measurement of polarized Raman spectra in back scattering configuration from a spot size down to 1-2 microns in diameter. To minimize heating of the sample in the laser focus, the laser power was kept below 1mW.
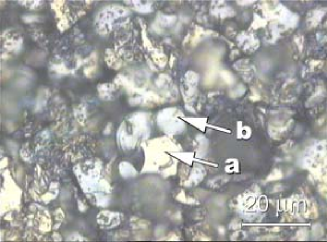
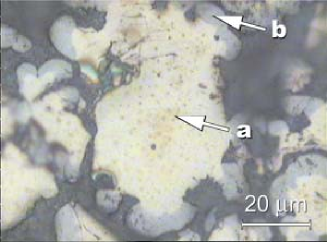
The ”yellowish” (a) and ”bluish” (b) regions correspond to stoichiometric (LiBC) and non-stoichiometric (Li0.95BC) compositions, respectively.
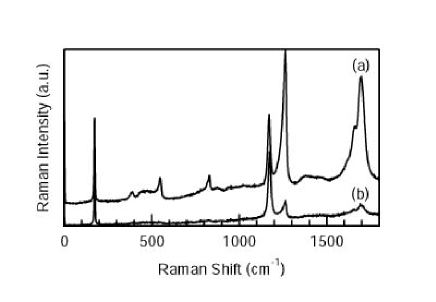
Surface of virgin pellets showed a dark golden-brown metallic appearance at naked eye view, but optical microscope observations revealed crystallites with bluish and yellowish faces with typical size of order of 10 microns. The borders of bluish faces were often rounded or kidney-shaped, while the borders of the yellowish faces were more straight (Fig. 1). Residual area corresponded to holes or black material without any Raman signal. After polishing of the surface, it became apparent that the border area of larger crystallites tends to be bluish, while the interior part is yellowish, with a well defined boundary between the bluish and yellowish regions (Fig. 2). Raman spectra of the bluish regions show a pair of modes near 160 cm-1 and 1184 cm-1 and weak, broad features d1, d2 and d3 reminiscent of the phonon density of states bands, superposed on a strong luminescent background (see Fig. 3). Very similar Raman spectra were observed previously on the annealed LiBC in Ref. ourLiBC1, . In contrast, the luminescent background was practically absent in the yellowish crystallites, and the lines were significantly sharper and at a somewhat ”repelled” positions 174 cm-1 and 1172 cm-1 (see Fig. 3). Furthermore, the yellowish crystallites revealed strong asymmetric bands near 1700 cm-1 and 2500 cm-1, which strongly reminiscent of two-phonon double resonant Raman scattering lines in graphite.ThomsenReich These bands, first reported in Ref. FoggPRB, , indeed correspond well to doubled frequency of the puckering and B-C bond stretching vibrations, and will be investigated in more detail elsewhere. From the above observations, we conclude that the yellowish regions correspond to the stoichiometric LiBC, while bluish regions correspond to the non-stoichiometric Li0.95BC component seen by X-ray diffraction.
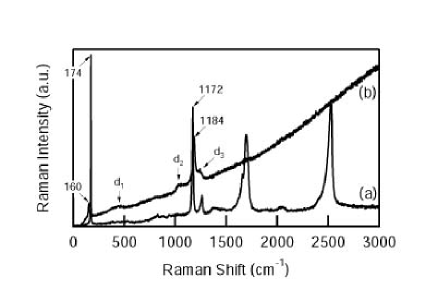
Finally, let us stress that none of the Raman spectra taken from this sample showed the additional pairourLiBC1 of sharp and strong -like Raman lines near 546 cm-1 and 830 cm-1, so that the present sample is clearly free from the low symmetry modification. We have observed, however, in some of the yellowish regions, a very weak but quite sharp lines near 388 cm-1, 548 cm-1 and 828 cm-1, which, as will be shown below, correspond surprisingly well to the LO frequencies of infrared active optic modes. We speculate that these weak features may be coupled LO phonon-plasmon modes.plasmon In this case, such modes should be absent in cross-polarized geometry, which was indeed observed (see Fig. 4).
Infrared reflectivity at near-normal incidence was measured using a Bruker 113v spectrometer. To improve the surface quality, we tried both dry and wet polishing using diamond paste and different organic liquids, but we were not able to achieve a mirror-like reflection over the entire surface of the pellet. Therefore, we have rather measured directly the reflectivity of the as received (”virgin”) surface. The absolute value of reflectivity is calculated as a ratio of of the sample and Al mirror spectra. After the measurement, about 300 nm of Au was evaporated on the measured pellet surface, in order to perform an auxiliary reflectivity measurement allowing to estimate the area of highly reflecting microcrystalline faces arranged parallel to the surface. Reflectivity of these surfaces was then determined as a ratio of virgin pellet and Au-coated reflectivities.

Resulting reflectivity spectrum (Fig. 5.) shows two clear bands corresponding to E1u phonon modes (with LO frequencies near 1262 cm-1 and 381 cm-1). This is obvious from comparison with the single-crystal reflectivity calculated for normal incidence c-face reflection
| (1) |
using the usual damped harmonic oscillator expression for in-plane dielectric permittivity
| (2) |
with ab-initio calculatedKwan parameters (electronic permittivity , E1u(TO) frequencies cm-1, cm-1, screened plasma mode frequencies cm-1, cm-1) and assuming a reasonable damping as in Ref. Kwan, . The general agreement indicates that the majority of microcrystalline faces on the surface are parallel to the hexagonal plane, as could be guessed from the typical plate-like habitus of LiBC powder grains. Two small additional dips near 545 cm-1 and 825 cm-1 are close to ab-initio frequencies of A2u(LO) modes, suggesting that few crystallites on the surface have nevertheless a different orientation. While the values of TO and LO frequencies of E1u modes could be easily adjusted to match the experimental data, the overall increase of the measured reflectance between 1500 and 200 cm-1 cannot be attributed to the dielectric contribution of these phonon modes only. This additional contribution could be an effect related to the powder form of the LiBC sample or due to a metallic impurity component in the sample etc. On the other hand, the sharp increase of the reflectivity below 50 cm-1 could be modeled by a Drude model with cm-1 what might be considered as intrinsic LiBC effect compatible with dc conductivity of LiBCSouptel .
| mode | ab-initio | Raman | IR | ||
|---|---|---|---|---|---|
| Ref. Ren03, | Ref. ARSP, | Ref. Kwan, | |||
| E2g | 176 | 171 | 169 | 174 | |
| E2u | 301 | 306 | 292 | ||
| B1g | 319 | 289 | 299 | ||
| E | 354 | 352 | 346 | 356 | |
| E | 382 | 367 | (388) | 381 | |
| A | 457 | 422 | 407 | ||
| A | 563 | 499 | (548) | 545 | |
| B2u | 548 | 540 | 510 | ||
| A | 819 | 802 | 803 | ||
| A | 840 | 833 | (828) | 825 | |
| B1g | 843 | 821 | 829 | ||
| E | 1136 | 1194 | 1143 | 1174 | |
| E | 1231 | 1236 | 1262 | ||
| E2g | 1145 | 1204 | 1153 | 1172 | |
Frequencies of all measured phonon modes are compared with available ab-initio calculations in Tab. I. From Raman measurement, only the data from the inner yellowish regions are shown. It is remarkable that the LO frequencies calculated as zeros of the adjusted dielectric permittivity coincides within 10 cm-1 with the LO frequencies determined from Raman measurements. Generally, the experimental frequencies of E1u and of E2g modes tend to be somewhat higher than the theoretical ones.
The mode experimental screened plasma frequencies (=147 cm-1 and =459 cm-1) are quite close to the ab-initio calculated values 135 and 469 cm-1. These values can be used for evaluation of in-plane diagonal components of Born effective charge tensors. Let us consider modes polarized along the x-axis. The eigenvector of the -th mode can be defined by three nonzero components of its mass-reduced polarization vectors , . The screened plasma frequency of the mode () is then given by
| (3) |
where
| (4) |
is the ionic (in-plane) screened plasma frequency, is the in-plane diagonal components of Born effective charge tensor of ion and is its relative mass. The common factor
| (5) |
includes elementary charge , atomic mass unit , permittivity of vacuum , volume of primitive unit cell and relative in-plane electronic permittivity .
Assuming that the lower frequency mode involves purely rigid motion of of graphene sheets, eigenvectors of TA, TO1 and TO2 modes are given by columns of the matrix
| (6) |
where and . Using the experimental values of screened plasma frequencies of TO1 and TO2 modes ( and ) and for , , , eqns. (3 and (6)yield unique solution , , . The corresponding in-plane diagonal components of Born effective charge tensors directly follows from eqs.(4) and (5), giving (for Å3 and )
| (7) |
These values are indeed close to ab-initio valuesKwan 0.81, 2.37 and -3.17.
In conclusion, although the present experiment cannot substitute single crystal measurements, we were able to observe all optically active modes of LiBC and estimate their frequencies. The screened plasma frequencies frequencies of modes were used to determine in-plane diagonal components of Born effective charge tensors at Li, B and C ions. The obtained results are in a perfect agreement with first-principle predictions for vibrational properties of stoichiometric LiBC.
Acknowledgements.
The work has been supported by Czech grant project AVOZ 1-010-914.References
- (1) M. Wörle, R. Nesper, G. Mair, M. Schwartz, and H.G. von Schnering, Z. Anorg. Allg. Chem. 621 1153,(1995).
- (2) J. Nagamatsu, N. Nakagawa, T. Muranaka, Y. Zenitani and J. Akimitsu, Nature 410, 63 (2001).
- (3) H. Rosner, A. Kitaigorodsky, and W. E. Pickett, Phys.Rev.Lett. 88, 127001 (2002).
- (4) A. M. Fogg, P. R. Chalker, J. B. Claridge, G. R. Darling, and M. J. Rosseinsky, Phys.Rev. B 67, 245106 (2003).
- (5) A. M. Fogg, J. B. Claridge, G. R. Darling, and M. J. Rosseinsky, Chem. Commun. 1348 (2003).
- (6) L. Zhao, P. Klavins, and Kai Liu, J. Appl. Phys. 93, 8653 (2003).
- (7) D. Souptel, Z, Hossain, G. Behr, W. Lösser, Ch. Geibel, Sol. St. Comm. 125, 17 (2003).
- (8) R. J. Cava, H. W. Zandbergen, and K. Inumaru, Physica C 385, 8 (2003).
- (9) B. Renker, H. Schober, P. Adelmann, P. Schweiss, K. B. Bohnen, and R. Heid, D. Ernst, M. Koza, P. Adelmann, cond-mat/0302036.
- (10) J. M. An, S. Y. Savrasov, H. Rosner, and W. E. Pickett, Phys.Rev. B 66, 220502 (2002).
- (11) J. M. An , H. Rosner, S. Y. Savrasov, and and W. E. Pickett, Physica B 328 1 (2003).
- (12) Kwan-Woo and W. E. Pickett, cond-mat/0302488.
- (13) J. K. Dewhurst, S. Sharma, C. Ambrosch-Draxl, and B. Jonamsson, cond-mat/0210704.
- (14) J. Hlinka, I. Gregora, J. Pokorný, A.V. Pronin, and A. Loidl, Phys. Rev. B 67, 020504 (2003).
- (15) A.V. Pronin, K. Pucher, P. Lunkenheimer, A. Krimmel, and A. Loidl, Phys. Rev. B 67, 132502 (2003).
- (16) A. Bharathi, S. Jemima Balaselvi, M. Premila, T.N. Sairam, G.L.N. Reddy, C.S. Sundar, and Y. Hariharan, Sol.St. Comm. 124, 423 (2002).
- (17) C. Thomsen and S. Reich, Phys. Rev. Lett. 85, 5214 (2000).
- (18) A. Mooradian and A. L. McWhorter, Phys. Rev. Lett. 19, 849 (1967).